Topology
The Topology window displays color-encoded nodes and links that correspond to various network elements, including switches, links, fabric extenders, port-channel configurations, virtual port-channels, and more. For information about each of these elements, hover your cursor over the corresponding element. Also, click a node or the line for a link. A slide-in pane appears from the right side of the window. This pane displays detailed information about either the switch or the link.
 Note |
You can open multiple tabs simultaneously and can function side by side to facilitate comparison and troubleshooting. |
Status
The color coding of each node and link corresponds to its state. The colors and what they indicate are described in the following list:
-
Green: Indicates that the element is in good health and functioning as intended.
-
Yellow: Indicates that the element is in warning state and requires attention to prevent any further problems.
-
Red: Indicates that the element is in critical state and requires immediate attention.
-
Gray: Indicates lack of information to identify the element or the element has been discovered.
Note
-
In the Topology window, FEX appears in gray (Unknown or n/a) because health is not calculated for FEX.
-
After moving a cable from one port to another port, the old fabric link is retained in the Topology window, and it is shown in the red color indicating that the link is down. The port movements are not updated in the Topology window. You need to rediscover the switch for the updated ports to be displayed in DCNM.
-
-
Black: Indicates that the element is down.
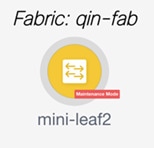
Starting from Cisco DCNM Release 11.4(1), if a switch is in maintenance mode, a Maintenance Mode badge is displayed next to the switch. If a switch is in migration mode, a Migration Mode badge is displayed next to the switch.
Scope
You can search the topology based on the scope. The default scopes available from the SCOPE drop-down list is: DEFAULT_LAN and DEFAULT_SAN. The search options differ based on the chosen scope.
The following search options are available for DEFAULT_LAN:
-
Quick Search
-
VLAN
The following search options are available for DEFAULT_SAN:
-
Quick Search
-
VLAN
-
VSAN ID/Name
Searching
When the number of nodes is large, it quickly becomes difficult to locate the intended switches and links. You can quickly find switches and links by performing a search. You are also able to search for VM tracker and generic setups. Searching feature enables you to see which leaf the host is connected to.
The following searches are available:
Note |
By default, Quick Search is selected. |
Quick Search
Quick Search enables you to search for devices by name, IP address, model, serial number, and switch role. As you enter a search parameter in the Search field, the corresponding switches are highlighted in the topology. To perform a search for multiple nodes and links, separate multiple keywords using a comma, for example, ABCD12345, N7K, sw-dc4-12345, core, 172.23.45.67. Cisco DCNM supports wildcard searches too. If you know a serial number or switch name partially, you can build a search based on these partial terms that are preceded by an asterisk, for example, ABCD*, sw*12345, core, and so on.
To limit the scope of your search to a parameter, enter the parameter name followed by a space and the parameter in the Search field, for example, name=sw*12345, serialNumber=ABCD12345, and so on.
VLAN
Search by a given VLAN ID. VLAN search provides the search for the VLAN configured on the switch or the links. If STP is enabled, then it provides information that is related to the STP protocol and the STP information for links.
VSAN ID/Name
Search by a given VSAN ID. VSAN search provides the search for VSAN configured on the switch or the links. In order to view the STP details associated with the VSAN, click STP Details link.
This shows the STP details, if STP is enabled. If the link is blocked, it is marked as red, green in case of a forwarding link, and orange if the link is blocked for one VSAN range and forwarding for the other VSAN range.
This search is applicable to both the default LAN and SAN scopes.
Show Panel
You can choose to view your topology based on the following options:
-
Auto Refresh: Check this check box to automatically refresh the topology.
-
Switch Health: Check this check box to view the switch's health status.
-
FEX: Check this check box to view the Fabric Extender.
Note
The FEX feature is available only on LAN devices. Therefore, checking this check box displays only the Cisco Nexus switches that support FEX.
Note
If a Cisco Nexus Switch is discovered as part of SAN fabric, FEX feature is not available. FEX is also not supported on Cisco Nexus 1000V devices. Therefore, such devices will not be displayed in the topology when you check the FEX check box.
-
Links: Check this check box to view links in the topology. The following options are available:
-
Errors Only: Click this radio button to view only links with errors.
-
All: Click this radio button to view all the links in the topology.
-
VPC Only: Check this check box to view only vPC peer-links and vPCs.
-
Bandwidth: Check this check box to view the color coding based on the bandwidth that is consumed by the links.
-
-
UI controls: Check the check box to show or hide the various controls on the Topology window.
-
Refresh: You can also perform a topology refresh by clicking the Refresh icon in the upper-right corner of this panel.
Layouts
The topology supports different layouts along with a Save Layout option that remembers how you positioned your topology.
-
Hierarchical and Hierarchical Left-Right: Provide an architectural view of your topology. Various switch roles can be defined that will draw the nodes on how you configure your CLOS topology.
Note
When running a large-scale setup, being able to easily view all your switches on a leaf-tier can become difficult. To mitigate this, DCNM splits your leaf-tier every 16 switches.
-
Random: Nodes are placed randomly on the window. DCNM tries to make a guess and intelligently place nodes that belong together in close proximity.
-
Circular and Tiered-Circular: Draw nodes in a circular or concentric circular pattern.
-
Custom saved layout: Nodes can be dragged around according to your preference. After you position as required, click Save to retain the positions. The next time you come to the topology, DCNM will draw the nodes based on your last saved layout positions.
Before a layout is chosen, DCNM checks if a custom layout is applied. If a custom layout is applied, DCNM uses it. If a custom layout is not applied, DCNM checks if switches exist at different tiers, and chooses the Hierarchical layout or the Hierarchical Left-Right layout. Force-directed layout is chosen if all the other layouts fail.
Zooming, Panning, and Dragging
You can zoom in and zoom out using the controls that are provided at the bottom left of the windows or by using your mouse's wheel.
To pan, click and hold anywhere in the whitespace and drag the cursor up, down, left, or right.
To drag switches, click, hold, and move the cursor around the whitespace region of the topology.
Switch Slide-Out Panel
You can click on the switch to display the configured switch name, IP address, switch model, and other summary information such as status, serial number, health, last-polled CPU utilization, and last-polled memory utilization.
From DCNM release 11.5(1), switches have only two roles, Core Router and Edge Router.
Beacon
This button will be shown for switches that support the beacon command. After beaconing starts, the button will show a countdown. By default, the beaconing will stop after 60 seconds, but you can stop it immediately by clicking Stop Beacon.
Note |
The default time can be configured in server.properties file. Search for beacon.turnOff.time. The time value is in milliseconds. Note that this requires a server restart to take effect. |
Tagging
Tagging is a powerful yet easy way to organize your switches. Tags can be virtually any string, for example, building 6, floor 2, rack 7, problem switch, and Justin debugging.
Use the search functionality to perform searches based on tags.
More Details
Click Show more details to display more information under the following tabs: System Info, Modules, FEX, License, Features, VXLAN, VLAN, Capacity and Hosts.


Starting from Cisco DCNM Release 11.4(1), the 400G tier has also been added to the Physical Capacity table under the Capacity tab. However, the Physical Capacity table under the Capacity tab will only show information about the physical ports that are present on the switch. For example, if the switch does not have a 400G physical port, the 400G tier is not displayed in the Physical Capacity table.

Link Slide-Out Panel
You can click a link to view the status and the port or switches that describe the link.
24-Hour Traffic
This feature requires Performance Monitoring to be turned ON. When Performance Monitoring is ON, traffic information is collected and the aggregate information is displayed along with a graph showing traffic utilization.
 Feedback