Applications

Cisco Data Center Network Manager (DCNM) uses the application framework to host various plugins and microservices to support operations and related features in Cisco DCNM.

The Applications Framework provides the following features:

  • An infrastructure for hosting applications that require more system resources as the scale of the network increases.

  • An independent application development-deployment-management lifecycle for applications.

Cisco DCNM Applications Framework supports two modes namely clustered mode and unclustered mode. In clustered mode, the compute nodes are clustered together whereas in the latter only the DCNM server nodes namely the active/standby exist. Most of the applications for ex: Network Insights require clustered setup to be ready before they can be uploaded and deployed using DCNM Applications Framework.

Application Framework User Interface

To use the Applications Framework feature, in the Cisco DCNM home page's left pane, click Applications.

The Applications window displays the following tabs:

  • Catalog—This tab lists the applications that are used by Cisco DCNM. These applications for performing various functions within Cisco DCNM. For more information, see Catalog.

  • Compute—This tab displays the existing compute nodes. The tab shows nodes that are part of the hosting infrastructure. The uptime indicates how long they have been part of the infrastructure. In a High Availability (HA) setup, both the active and the standby nodes appear as joined. For more information, see Compute.


    Note

    In the cluster mode, the Cisco DCNM servers will not appear under the Compute tab.


  • Preferences—This tab is relevant to the cluster mode of deployment, where the application instances are placed. This tab enables you to compute the cluster connectivity and configure the Cluster Connectivity preferences. For more information, see Preferences.

Cisco DCNM uses the following applications:

  • Kibana: This is an open-source data-visualization plug-in for Elasticsearch, which provides visualization capabilities. Cisco DCNM uses the Kibana application for the Media Controller, and Endpoint Locator.

  • San Insight Pipeline Collector(1.0)

  • SAN Insight Post Processor(1.0)
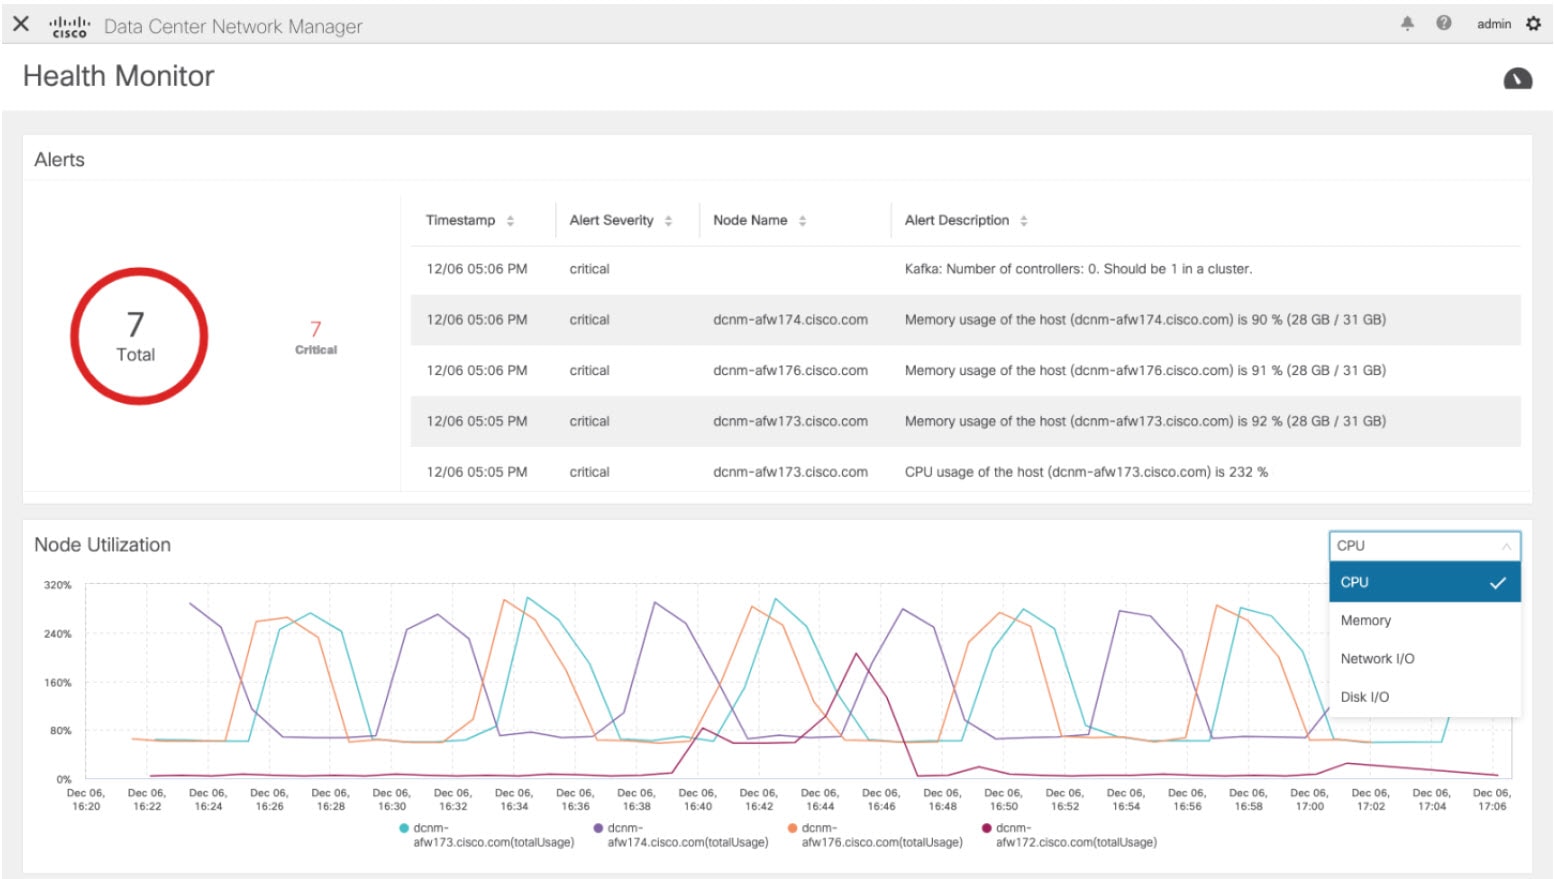
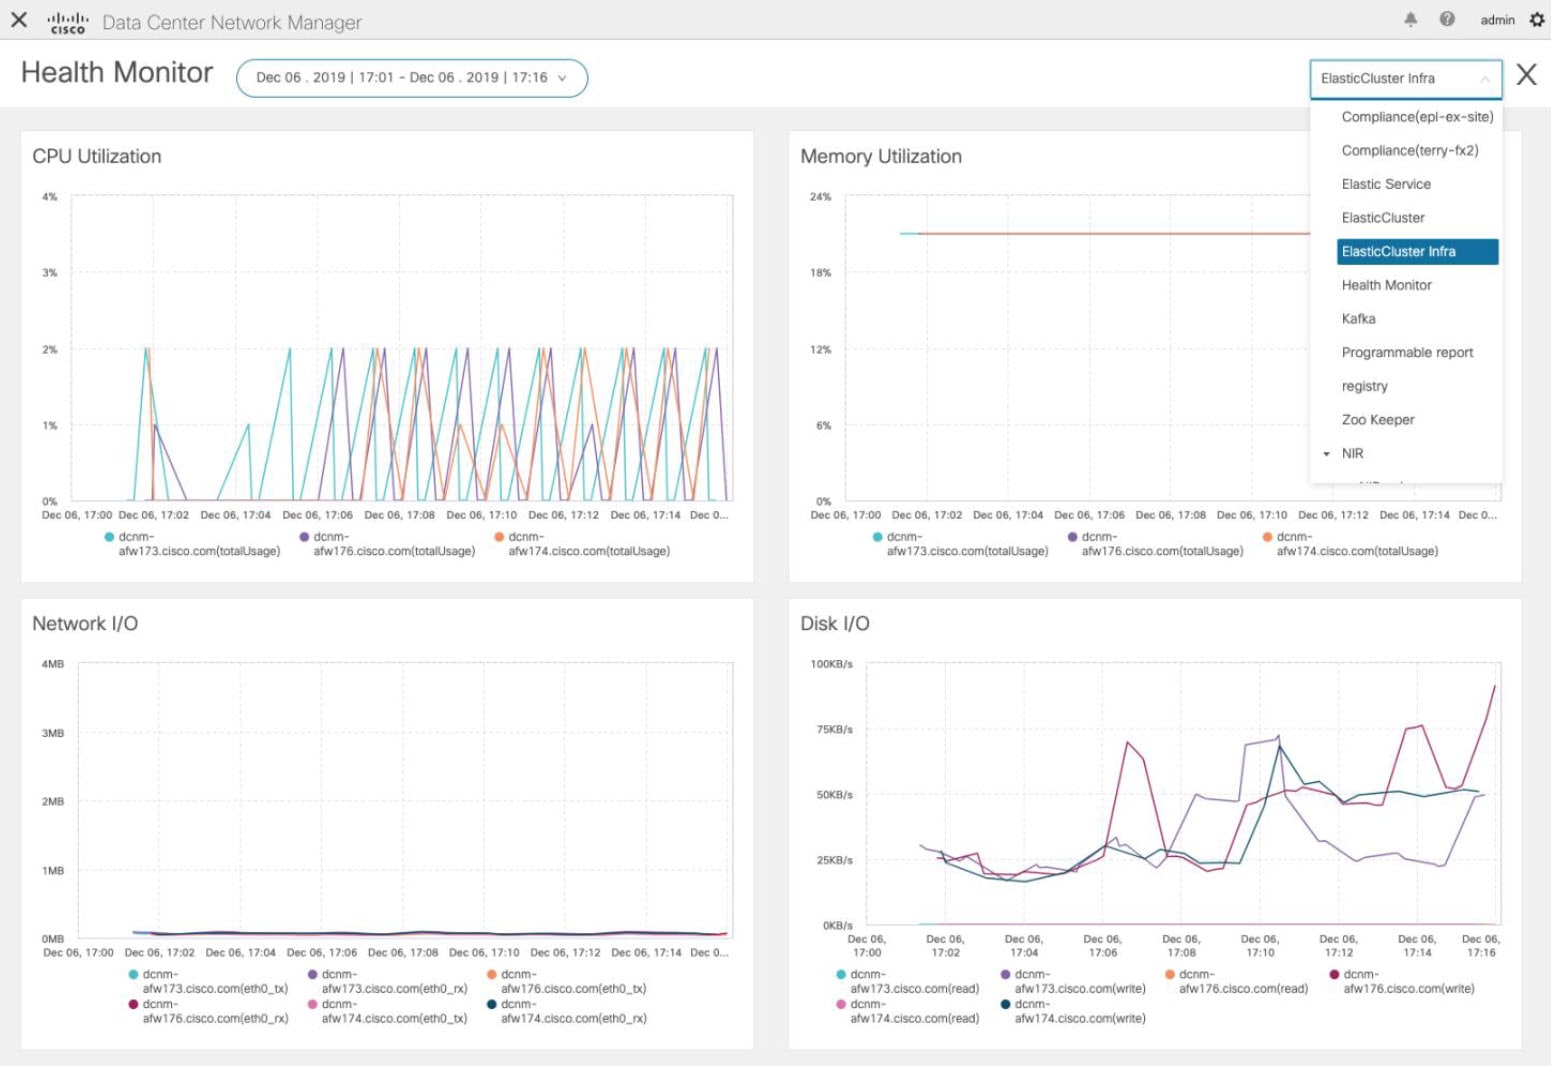
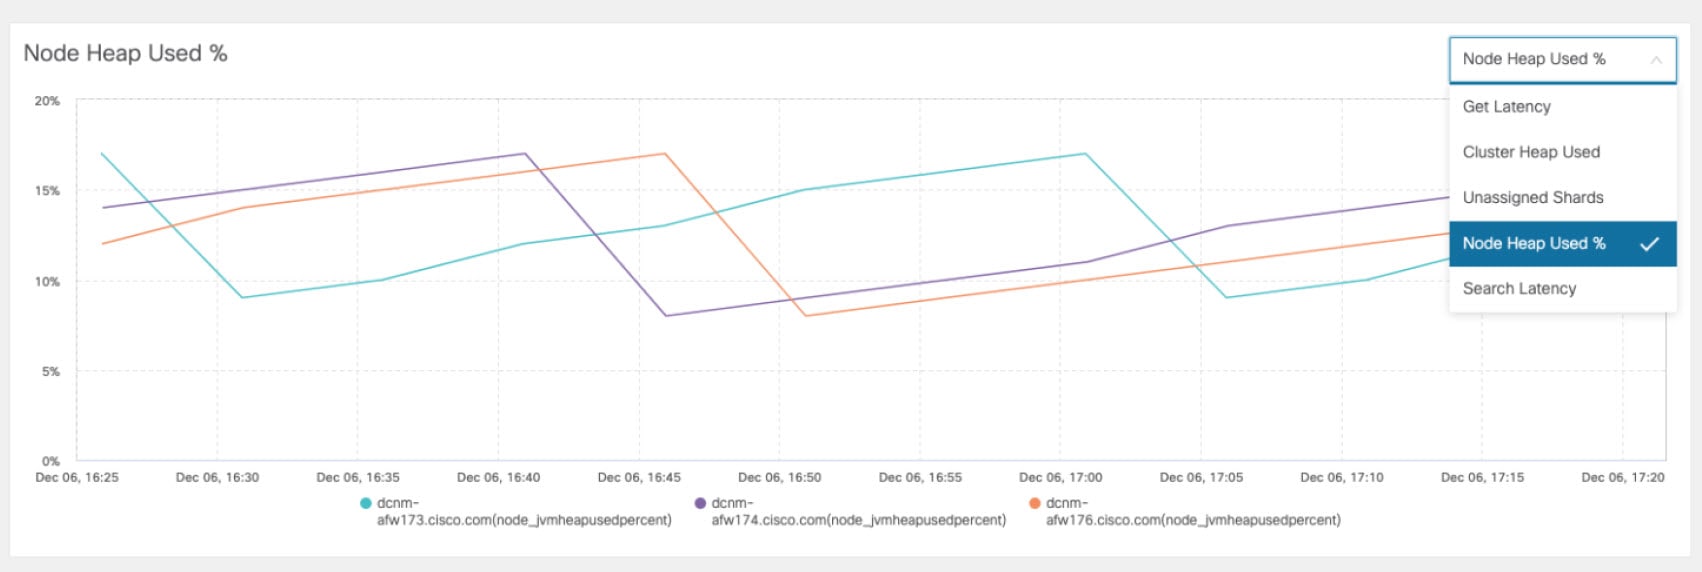
  • Health Monitor(2.0)

Catalog

The Catalog allows you to view all the applications that you have installed or enabled on the Cisco DCNM. Few applications are installed and are operational by default, when you install the Cisco DCNM.

The following applications appears based on the Cisco DCNM Deployments:

  • Health Monitor (2.1)

  • PTP Monitoring (1.1)

  • Kibana (2.0)

  • Programmable report (1.1.0)

  • Elastic Service (1.1)

  • Compliance (4.0.0)

  • Debug Tools (2.1)

  • IPAM Integrator (1.0)

  • Endpoint Locator (2.1)

  • Kubernetes Visualizer (1.1)

  • vmmplugin (4.1)


Note

The applications started by default, or also installed on the DCNM utilizes infrastructure services are operational, by default.


You can install more applications from the App Center, via the Web UI.

Health Monitor

The Health Monitor helps you to monitor the infrastructure health and status. You can monitor the Alerts, Service Utilization, and Compute Utilization using the Health Monitor application. When you install or upgrade to 11.2(1), the Health Monitor application is installed and operational, by default.

To launch the Health Monitor app, on the Cisco DCNM Web UI, choose Applications. On the Catalog tab, click on Health Monitor to launch the application.


Note

Health Monitor application is installed by default in Cisco DCNM cluster mode.


Health Monitor app broadly monitors and alerts on the following metrics for Services, Computes and DCNM server:

  • CPU utilization

  • Memory utilization

  • Network I/O (eth0)

  • Disk I/O

You can monitor the following using the Health Monitor application:

Alerts

The Alerts window provides information about the number of alerts that have occurred, from the specified date and time. You can view the alerts, based on the following categories, in the graphical view and the list view.

In the graphical view, the categories are:

  • Severity displays the alerts, based on the severity: Critical/Major/Minor/Info.

  • Type displays the alerts, based on the cluster type.

  • Compute displays the alerts, for each compute node.

  • Service displays the alerts, for all the services running on Cisco DCNM.

Click on the Refresh icon to refresh the alerts. Click on the list view icon to view the alerts in list format.

In the List View, alerts are displayed in tabular format with the following categories:

  • Timestamp displays the time when the alert triggers. Format is MM/DD HH:MM AM/PM.

  • Alert Severity displays the severity of alert.

  • Alert Type displays the cluster alert type.

  • Node Name displays the node name where the alert triggers.

  • Alert Description displays the summary of the alert.

Click on the right or left navigation arrows to move to the next or the previous page.

You can also choose to set the number of items to view on page. Select a suitable number from the Objects Per Page drop-down list.

Click on the Graphical representation icon to go to the graphical view. Click on Download Data icon to download alerts information for troubleshooting purposes.

Health Monitor generates alerts for the following metrics:

  • CPU utilization >= 65 %

  • Memory utilization >= 65 %

  • Disk utilization >= 65 %

  • Elasticsearch cluster status: Red/yellow

  • Elasticsearch unassigned shards > 0

  • Elasticsearch JVM heap used >= 65 %

  • Kafka partitions without leader: Controller offline partitions count > 0

  • Kafka controllers count: Controller active controller count != 1

  • Kafka partition leader: Controller unclear leader elections count > 0

Service Utilization

You can monitor all the services running on the Cisco DCNM on this window. Based on the time range and the service, the graphical view shows the CPU and Memory utilization for service. Click on the Service Utilization icon on the top-right corner to launch the CPU utilization graphical view.

From the Time Range drop-down list, choose the time range for which you want to view the utilization. You can select a specific time interval to view the metrics during that time interval. Click the fields showing the date and time to select the required date and time interval. You can also click the date on the calendar to set range. Click Apply to confirm the time range.

From the Services drop-down list, choose the service to view its Service utilization. This list comprises of all the services that are currently running on the Cisco DCNM.

Select the Time Range to view the Service, the Cpu Utilization, and Memory Utilization graphs. You can hover over specific points on the respective graphs for more information on CPU and Memory utilization at specific time.

The memory utilization graphical view depicts the actual memory consumption (RAM) in Gigabytes (GB).

Click [X] icon on the top-right corner to close the Service Utilization window and revert to the Alerts window.

Guidelines and Limitations for Health Monitor in Service Utilization
  • The CPU utilization for applications without a CPU limit, like Kafka, ElasticSearch, FMserver, and so on, may show 100% utilization in the graphs. 100% utilization is because this application uses one or more cores.

  • The following alerts are triggered for the CPU utilization of applications:

    • Minor alert: 200-400 %

      Major alert: 400-600%

      Critical: > 600%

  • The transient message for Kafka controller counts appears as a severe alert sometimes. You can ignore the alert if it clears within two minutes after refresh.

  • The Disk I/O and Memory Utilization metrics are not available for Kafka and Elastic Service.

  • The Network I/O metric is not available for DCNM: FMServer and DCNM: Postgres.

  • The metrics does not auto-refresh. Navigate between different windows using the options in the drop-down list to refresh the metrics. Additionally, you can change the time range to refresh the metrics for a selected period.

  • There might be duplicate alerts for the same feature.

The following additional metrics are collected for Elastic Cluster:

  • Get latency: Latency for getting a single record by id

  • Cluster heap used: Heap memory used by the cluster

  • Unassigned shards: Count of unassigned shards

  • Node heap used percentage: Percentage heap memory used by the node

  • Search latency: Latency for getting a collection of records

The following additional metrics are collected for Kafka broker:

  • CPU: CPU utilization of broker

  • Memory: Memory utilization of broker

  • Heap memory: Heap memory utilized by broker

  • Total time: Network produce, network fetch follower, network fetch consumer time

  • Purgatory size: Server fetch purgatory size, server produce purgatory size of broker

  • Data in: Bytes in for the broker

  • Data out: Bytes out for the broker

  • Messages in: Messages received by the broker

  • Fetch request: Total fetch requests for the broker

  • ISR: In-sync-replicas expands and shrinks for the broker

The following additional metrics are collected for top 5 Kafka topics:

  • Data in: Bytes in for the topic

  • Data out: Bytes out for the topic

  • Messages in: Message in count for topic

  • Messages out: Message out count for topic

  • Lag: Lag per topic

Compute Utilization

You can monitor all the computes installed with the Cisco DCNM. Based on the time range and the service, the graphical view shows the CPU and Memory utilization for service. Click on the Compute Utilization icon on the top-right corner to launch the CPU utilization graphical view.

From the Time Range drop-down list, choose the time range for which you want to view the utilization. You can select a specific time interval to view the metrics during that time interval. Click the fields showing the date and time to select the required date and time interval. You can also click the date on the calendar to set range. Click Apply to confirm the time range.

Select the Time Range to view the Service, the Cpu Utilization, and Memory Utilization graphs. You can hover over specific points on the respective graphs for more information on CPU and Memory utilization at specific time.

The memory utilization graphical view depicts the actual memory consumption (RAM) in Gigabytes (GB).

Click [X] icon on the top-right corner to close the Service Utilization window and revert to the Alerts window.

Compute

This tab displays the existing compute nodes. The tab shows nodes that are part of the hosting infrastructure. The uptime indicates how long they have been part of the infrastructure. In a High Availability (HA) setup, both the active and the standby nodes appear as joined. In clustered mode, the compute nodes status indicate if the nodes are joined or discovered.

Compute tab.


Note

If the NTP server for compute nodes is not synchronized with the NTP server for DCNM Servers (Active and Standby) and Computes, you cannot configure a cluster.

The certificates are generated with a timestamp. If you configure the Compute nodes using a different NTP server, the mismatch in timestamp will not allow to validate the certificates. Therefore, if the compute cluster is configured despite of a mismatch of NTP server, the applications will not function properly.


Note

In clustered mode, the Cisco DCNM servers will not appear under the Compute tab.


The following table describes the fields that appear on Applications > Compute.

Table 1. Field and Description on Compute Tab

Field

Description

Compute IP Address

Specifies the IP Address of the Compute node.

In-Band Interface

Specifies the in-band management interface.

Out-Band Interface

Specifies the out-band management interface.

Status

Specifies the status of the Compute node.

  • Joined

  • Discovered

  • Failed

  • Offline

Memory

Specifies the memory that is consumed by the node.

Disk

Specifies the disk space that is consumed on the compute node.

Uptime

Specifies the duration of the uptime for a compute node.

When you install a compute node with correct parameters, it appears as Joined in the Status column. However, the other two computes appears as Discovered.

To configure or modify the Cluster Connectivity preferences, see Preferences.

Preferences

This tab is relevant to the cluster mode of deployment, where the application instances are placed. This tab enables you to compute cluster connectivity and configure the Cluster Connectivity preferences.

Preferences Tab


Note

This deployment does not support the compute cluster connectivity. The Compute Cluster Connectivity fields are grayed out for this deployment.


Object Archival Configuration

The NIA application collects tech support logs for all switches in Fabric, and determines the advisory, based on the data. The logs are saved on the Cisco DCNM server for further analysis or troubleshooting. If you need to download these logs before their life span ends or to create some space on the DCNM server, you can move the logs to a remote server.

In the URI field, enter the relative path to the archive folder, in the format host[:port]/[path to archive]. Enter the username and password to access the URI, in the username and Password field. Click Submit to configure the remote server.