Monitor

This chapter contains the following topics:

Monitoring Switch

The Switch menu includes the following submenus:

Viewing Switch CPU Information

To view the switch CPU information from the Cisco DCNM Web UI, perform the following steps:

Procedure


Step 1

Choose Monitor > Switch > CPU.

The CPU window is displayed. This window displays the CPU information for the switches in that scope.

Step 2

You can use the drop-down to filter the view by Last 10 Minutes, Last Hour, Last Day, Last Week, Last Month, and Last Year.

Step 3

In the Switch column, click the switch name to view the Switch Dashboard.

Step 4

Click the chart icon in the Switch column to view the CPU utilization.

You can also change the chart timeline to Last 10 Minutes, Last Hour, Last Day, Last Week, Last Month, and Last Year. You can choose the chart type and chart options to show as well.


Viewing Switch Memory Information

To view the switch memory information from the Cisco DCNM Web UI, perform the following steps:

Procedure


Step 1

Choose Monitor > Switch > Memory.

The memory panel is displayed. This panel displays the memory information for the switches in that scope.

Step 2

Use the drop-down to filter the view by Last 10 Minutes, Last Hour, Last Day, Last Week, Last Month, and Last Year.

Step 3

Click the chart icon in the Switch column to see a graph of the memory usage of the switch.

Step 4

In the Switch column, click the switch name to view the Switch Dashboard.

Step 5

You can use the drop-down to view the chart in different time lines. Use the chart icons to view the memory utilization chart in varied views.


Viewing Switch Traffic and Errors Information

To view the switch traffic and errors information from the Cisco DCNM Web UI, perform the following steps:

Procedure


Step 1

Choose Monitor > Switch > Traffic.

The Switch Traffic panel is displayed. This panel displays the traffic on that device for the past 24 hours.

Step 2

Use the drop-down to filter the view by 24 hours, Week, Month, and Year.

Step 3

Click the Export icon in the upper-right corner to export the data into a spreadsheet.

Step 4

Click Save.

Step 5

Click the switch name to view the Switch Dashboard section.


Viewing Switch Temperature

Cisco DCNM includes the module temperature sensor monitoring feature, using which you can view the sensor temperature of a switch. You can choose an interval by which to filter the sensor list. The default interval is Last Day. Only sensors that have historical temperature data is shown in the list. You can choose between Last ten Minutes, Last Hour, Last Day, Last Week, and Last Month.

Note

It is not necessary to configure the LAN or SAN credentials under the Configure > Credentials Management > LAN Credentials screen to fetch the temperature monitoring data from the switches.


To view the switch temperature information from the Cisco DCNM Web UI, perform the following steps:

Procedure


Step 1

Choose Monitor > Switch > Temperature.

The Switch Temperature window is displayed with the following columns.

  • Scope: The sensor belongs to a switch, which is part of a fabric. The fabric that it belongs to is shown as its scope. When the scope selector at the top of Cisco DCNM is used, the sensor list is filtered by that scope.
  • Switch: Name of the switch the sensor belongs to.
  • IP Address: IP Address of the switch.
  • Temperature Module: The name of the sensor module.
  • Avg/Range: The first number is the average temperature over the interval that is specified at the top of the table. The second set of numbers is the range of the temperature over that interval.
  • Peak: The maximum temperature over the interval
Step 2

From this list, each row has a chart icon, which you can click.

A chart is displayed, which shows historical data for the sensor. The interval for this chart can be changed as well, between 24 hours, 1 week, and 1 month.

Enabling Temperature Monitoring

You can enable the temperature monitoring feature for LAN switches from the LAN Collections screen, and for the SAN switches by setting a few properties under Administration > DCNM Server > Server Properties screens.

Enabling Temperature Monitoring for SAN Switches
  1. From the menu bar, select Administration > DCNM Server > Server Properties.

  2. Navigate to the # PERFORMANCE MANAGER > COLLECTIONS area.

  3. Set the environment fields pm.collectSanTemperature & pm.sanSensorDiscovery to TRUE.

  4. Click Apply Changes to save the configuration.

  5. Restart Cisco DCNM.

Viewing Other Statistics

To view the statistics in user-defined format from the Cisco DCNM Web UI, perform the following steps:

Procedure


Step 1

Choose Monitor > Switch > User Defined.

The Other window is displayed.

Step 2

You can use the drop-down to filter the view by 24 hours, Week, Month, and Year.

There are variations to this procedure. In addition to these basic steps, you can also do the following:

  • Select the time range, and click Filter to filter the display.

  • Click the chart icon in the Switch column to see a graph of the performance for this user-defined object. You can change the time range for this graph by selecting it from the drop-down list in the upper right corner.

  • Use the chart icons to view the traffic chart in varied views.


Viewing Switch Custom Port Groups Information

To view the custom port group information from the Cisco DCNM Web UI, perform the following steps:

Procedure


Step 1

Choose Monitor > Switch > Custom Port Groups.

The Custom Port Groups window shows statistics and performance details for custom port groups.

Step 2

You can use the drop-down to filter the view by 24 hours, Week, Month, and Year.

Step 3

Click the Export icon in the upper-right corner to export the data into a spreadsheet.

Step 4

Click Save.

Step 5

Click the switch name to view the Switch Dashboard.


Viewing Accounting Information

To view the accounting information from the Cisco DCNM Web UI, perform the following steps:

Procedure


Step 1

Choose Monitor > Switch > Accounting.

The fabric name or the group name along with the accounting information is displayed.

Step 2

Select Advanced Filter beside the filter icon to search the accounting information by Source, Username,Time, and Description. Or select Quick Filter to search under each column.

Step 3

You can also select a row and click the Delete icon to delete accounting information from the list.

Step 4

You can use the Print icon to print the accounting details and use the Export icon to export the data to a Microsoft Excel spreadsheet.


Viewing Events Information

To view the events and syslog from the Cisco DCNM Web UI, perform the following steps:

Procedure


Step 1

Choose Monitor > Switch > Events.

The fabrics along with the switch name and the events details are displayed.

The Count column displays the number of times the same event has occurred during the time period as shown in the Last Seen and First Seen columns.

Click a switch name in the Switch column to view the switch dashboard.

Step 2

Select an event in the table and click the Add Suppressor icon to open the shortcut of adding an event suppressor rule.

Step 3

Select one or more events from the table and click the Acknowledge icon to acknowledge the event information for the fabric.

  • After you acknowledge the event for a fabric, the acknowledge icon is displayed in the Ack column next to the fabric.
Step 4

Select the fabric and click the Unacknowledge icon to cancel an acknowledgment for a fabric.

Step 5

Select Advanced Filter beside the filter icon to search the accounting information by Source, Username,Time, and Description. Or select Quick Filter to search under each column.

Step 6

Select a fabric and use the Delete icon to delete the fabric and event information from the list.

Step 7

Click the Print icon to print the event details.

Step 8

Click the Export to Excel icon to export the data.


Monitoring SAN

The SAN menu includes the following submenus:

Monitoring ISL Traffic and Errors

To monitor the ISL traffic and errors from the Cisco DCNM Web UI, perform the following steps:

Procedure


Step 1

Choose Monitor > SAN > ISLs.

The ISL Traffic and Errors window is displayed. This panel displays the ISL information for the end devices in that scope. You can reduce or expand the scope of what is displayed by using the scope menu.

Step 2

You can use the drop-down to filter the view by 24 hours, Week, Month, and Year.

Note 
NaN (Not a Number) in the data grid means that the data is not available.
Note 

It is empty for non-FCIP ports under the FCIP Compression Ratio column.

There are variations to this procedure. In addition to these basic steps, you can perform the following steps to view detailed information for ISLs:

  • To change the time range for this graph, select it from the drop-down list in the upper-right corner.

  • To view the detailed information for a specific period, drag the slider control to choose the time interval for which you need the information.

  • Use the chart icons to view the traffic chart in varied views. You can also use the icons to Append, Predict, and Interpolate Data. To view real-time information, choose Refresh icon from in the upper right corner. The real-time data is updated in every 10 seconds.

  • To export the data into a spreadsheet, click the Export icon in the upper-right corner and click Save.

  • For the Rx/Tx calculation, see the following Rx/Tx calculation formula.

    Note 
    The conversion for Fabrics is 10 bit = 1 byte and for LAN traffic, the conversion is 8 bit = 1 byte.
    • Average Rx/Tx % = Average Rx/Tx divided by Speed * 100
    • Peak Rx/Tx % = Peak Rx/Tx divided by Speed * 100

If the performance tables do not contain any data, see the Performance Setup Thresholds section to turn on performance.


Viewing Performance Information for NPV Links

To view the performance of NPV links from the Cisco DCNM Web UI, perform the following steps:

Procedure


Step 1

Choose Monitor > SAN > NPV Links.

The NPV Links window is displayed. This window displays the NPV links for the selected scope.

Step 2

You can use the drop-down to filter the view by 24 hours, Week, Month, and Year.

Step 3

Click the chart icon in the Name column to see a list of the traffic for the past 24 hours.

There are variations to this procedure. In addition to these basic steps, you can also perform the following steps to view detailed information for NPV links:

  • You can change the time range for this information by selecting from the drop-down list in the upper-right corner.

  • To view the detailed information for a specific period, drag the slider control to choose the time interval for which you need the information.

  • Use the chart icons to view the traffic chart in varied views. You can also use the icons to Append, Predict, and Interpolate Data.

  • To export the data into a spreadsheet, click the Export icon in the upper-right corner and click Save.

  • To view real-time information, choose Real Time from the drop-down list in the Chart menu.

Note 
If the performance tables do not contain any data, see the Performance Setup Thresholds section to turn on performance data collection.

Viewing Inventory Information for VSANs

To view the inventory information for VSANs from the Cisco DCNM Web UI, perform the following steps:

Procedure


Choose Monitor > SAN > VSANs.

The VSAN window is displayed, showing the VSAN details along with the status and Activated Zoneset details.


Monitoring Performance Information for Ethernet Ports

To monitor the performance of Ethernet ports from the Cisco DCNM Web UI, perform the following steps:

Procedure


Step 1

Choose Monitor > SAN > Ports.

The Ethernet Ports window is displayed.

Step 2

You can use the drop-down to filter the view by 24 hours, Week, Month, and Year.

There are variations to this procedure. In addition to these basic steps, you can also perform the following steps:

  • Choose an Ethernet port in the Name column to see a graph of the traffic across that Ethernet port for the past 24 hours. You can change the time range for this graph by selecting it from the drop-down list in the upper-right corner.

  • To export the data into a spreadsheet, click the Export icon in the upper-right corner and then Save.

  • Use the chart icons to view the traffic chart in varied views. You can also use the icons to Append, Predict, and Interpolate Data.

  • For the Rx/Tx calculation, see the following Rx/Tx calculation formula.

    Note 
    The conversion for Fabrics is 10 bit = 1 byte and for LAN traffic, the conversion is 8 bit = 1 byte.
    • Average Rx/Tx % = Average Rx/Tx divided by Speed * 100
    • Peak Rx/Tx % = Peak Rx/Tx divided by Speed * 100
Note 
If the performance tables do not contain any data, see the Performance Setup Thresholds section to turn on performance data collection.

Viewing Inventory Information for Host Ports on FC End Devices

To view the inventory information for host ports on FC end devices from the Cisco DCNM Web UI, perform the following steps:

Procedure


Step 1

Choose Monitor > SAN > FC Ports.

The Inventory > End Ports window is displayed with details of the FC End Devices on the host ports.

Step 2

Use the drop-down to view All or Warning information for the FC End devices on host ports.

Step 3

Click the Show Filter icon to enable filtering by Enclosure, Device Name, or VSAN.


Viewing Performance Information on All Ports

To view the performance of devices that are connected to all the ports from the Cisco DCNM Web UI, perform the following steps:

Procedure

Step 1

Choose Performance > End Devices.

The End Devices Traffic and Errors window is displayed.

Step 2

You can choose to display All ports, Host ports, or Storage ports from the drop-down list on the upper right corner.

Step 3

You can use the drop-down to filter the view by 24 hours, Week, Month, and Year.

Step 4

To export the data into a spreadsheet, click the Export icon in the upper-right corner and click Save.

Step 5

Click the chart icon in the Name column to see the following:

  • A graph of the traffic on that device according to the selected timeline.
  • Use the chart icons to view the traffic chart in varied views. To view real-time information, click the refresh icon from the drop-down list in the upper right corner. The real-time data is updated in every 10 seconds. You can also use the icons to Append, Predict, and Interpolate Data.
Note 
If the performance tables do not contain any data, see the Performance Setup Thresholds section to turn on performance data collection.

Viewing FICON Ports

The following table displays the traffic and error information for every FICON port.

Field Description
Scope Specifies the fabric scope, which has the FICON ports.
Switch Interface Click the Show Chart icon to view the port traffic of the selected switch interface.
Description Specifies the description of the FICON port.
FCID Specifies the fibre channel ID.
Mode Specifies the type of port. Valid values are CH and CU. The value is CH for FICON channels and CU for FICON control unit.
FICON ID Specifies the FICON port ID.
Connected To Specifies the device to which the FICON port is connected.
VSAN Specifies the VSAN ID.
Speed Specifies the speed of the FICON port.
Rx Specifies the average and peak Rx traffic.
Tx Specifies the average and peak Tx traffic.
Rx + Tx Specifies the sum of Rx and Tx traffic.
Errors Specifies the average and peak input and output errors.
Discards Specifies the average and peak input and output discards.

You can view the Port WWN details by choosing Settings > Columns and choose the Port WWN option from the drop-down list.

FICON ports

You can print, export the data, or customize the columns you want to view. Refresh the table to see the latest data.

To view the traffic and errors of FICON ports from the Cisco DCNM Web UI, perform the following steps:

Procedure

Step 1

Choose Monitor > SAN > FC Ports.

The Inventory window appears.

Step 2

Click the FICON tab.

Step 3

Click the Show Chart icon of the switch interface for which you want to view the traffic.

The real-time data is updated every 10 seconds. You can also use the icons to append, predict, or interpolate data.

Note 

Click the Do Not interpolate Missing Data icon to remove the missing data gap in the graph. By default, the missing data is interpolated in all graphs.

You can choose how you want to view the traffic. You can view the traffic details based on the time duration, format, and export this information.

You can view the port traffic for the following durations from the duration drop-down list:

  • 24 Hours

  • Week

  • Month

  • Year

Show: Click Show, and choose Chart, Table, or Chart and Table from the drop-down list to see how you want to view the traffic details.

If you choose Chart, hover over the traffic chart to view the Rx and Tx values, along the Y axis, for the corresponding time, along X axis. You can change the time duration values of the X axis by moving the sliders in the time range selector. You can choose the Y-axis values by checking or unchecking the Rx and Tx check boxes.

Note 

If you select Week, Month, or Year as the time duration, you can also view the Peak Rx and Peak Tx values along the Y axis.

Select Table to view the traffic information in tabular format.

Chart Type and Chart Options: Choose Area Chart or Line Chart from the Chart Type drop-down list.

You can choose the Show Fill Patterns chart option.

Actions: Export or print the traffic information by choosing the appropriate options from the Actions drop-down list.


Viewing Performance Information for FC Flows

To view the performance of the FC Flow traffic from the Cisco DCNM Web UI, perform the following steps:

Procedure


Step 1

Choose Monitor > SAN > FC Flows.

The FC Flows window is displayed.

Step 2

You can use the drop-down to filter the view by 24 hours, Week, Month, and Year.

Step 3

To export the data into a spreadsheet, click the Export icon in the upper-right corner and then click Save.

Step 4

Click the chart icon in the Name column to see:

  • A graph of the traffic on that device according to the selected timeline.

  • Use the chart icons to view the traffic chart in varied views. To view real-time information, click the Refresh icon from the drop-down list in the upper right corner.

  • You can also use the icons to Append, Predict, and Interpolate Data.

Note 
If the performance tables do not contain any data, see the Performance Setup Thresholds section to turn on performance data collection.

Viewing Performance Information on Enclosures

To view the performance of devices that are connected to the host enclosure from the Cisco DCNM Web UI, perform the following steps:

Procedure


Step 1

Choose Monitor > SAN > Enclosures.

The Enclosures Traffic and Errors window is displayed.

Step 2

You can select to view Host Enclosures or Storage Enclosures from the drop-down list on the upper right corner.

Step 3

You can use the drop-down to filter the view by 24 hours, Week, Month, and Year.

Step 4

To export the data into a spreadsheet, click the Export icon in the upper-right corner and then click Save.

Step 5

Click the chart icon in the Name column to see:

  • A graph of the traffic on that device according to the selected timeline.
  • Use the chart icons to view the traffic chart in varied views.
  • You can also use the icons to Append, Predict, and Interpolate Data.
Note 
If the performance tables do not contain any data, see the Performance Setup Thresholds section to turn on performance data collection.

Viewing Performance Information on Port Groups

To view the performance of devices that connected to the port groups from the Cisco DCNM Web UI, perform the following steps:

Procedure


Step 1

Choose Monitor > SAN > Port Groups.

The Port Group Traffic and Errors window is displayed.

Step 2

You can use the drop-down to filter the view by 24 hours, Week, Month, and Year.

Step 3

Click the name port group to see the members of that port group.

There are variations to this procedure. In addition to these basic steps, you can also perform the following steps to view detailed information for the port groups:

  • To change the time range for this graph, select it from the drop-down list in the upper right corner.

  • To view the detailed information for a specific period, drag the slider control to choose the time interval for which you need the information.

  • Use the chart icons to view the traffic chart in varied views.

  • You can also use the icons to Append, Predict, and Interpolate Data.

  • To export the data into a spreadsheet, click the Export icon in the upper-right corner and click Save.

Note 
If the performance tables do not contain any data, see the Performance Setup Thresholds section to turn on performance data collection.

SAN Host Redundancy

The SAN Host Path Redundancy check enables you to view the non-redundant host storage paths. It helps you identify the host enclosure errors along with the resolution to fix the errors.


Note

All fabrics that are discovered must be licensed or this feature will be disabled in the Cisco DCNM Web Client. When the feature is disabled, a notification is displayed stating unlicensed fabrics are discovered.

Host Path Redundancy determines that the ports are part of the same enclosure by using the enclosure name displayed in DCNM. If the enclosure names are not exactly the same, then they will be viewed as separate devices. When the names are not exactly the same, the user must manually change the names in the edit enclosure dialog in DCNM, in order for Host Path Redundancy and other features to consider them the same device.


From the menu bar, choose Monitor > SAN > Host Path Redundancy.

You can see two parts in this window:

Tests to Run

Procedure

Step 1

Choose Monitor > SAN > Host Path Redundancy.

Step 2

Under the upper Tests to Run area, use the check boxes to select the host redundancy optional checks.

Step 3

Check the Automatically Run Check Every 24 hours check box to enable periodic running of the checker. The checker will run every 24 hours starting 10 minutes after the server starts.

Step 4

Check Limit by VSANs check box, and select Inclusion or Exclusion. Enter VSAN or VSAN range in the text field to include or skip the host enclosures that belong to VSANs from the redundancy check.

Step 5

Check other optional checks to do the relevant check.

Step 6

Click Clear Results to clear all the errors displayed.

Step 7

Click Run Tests Now to run the check at anytime.

Step 8

The results are displayed in the below Results area.


Results

Procedure

Step 1

Choose Monitor > SAN > Host Path Redundancy tab.

Step 2

The bottom Results area has four tabs that are Host Path Errors, Ignored Hosts, Ignored Storage, and Ignored Host Storage Pairs.

Step 3

Click Host Path Errors tab to display the host path redundancy errors table. On the top of the table, the colored Good, Skipped, and Errored host enclosure counts, along with the last update time are displayed.

  1. The Host Enclosure column displays the hosts that contain the errors. These are counts of each path in the host enclosures seeing an error. The Storage Enclosure/Storage Port column displays the connected storage that is involved the errors. In the Fix? column, hover the mouse cursor on the ? icon to view a solution to fix the error.

  2. Select a row and click Ignore Hosts to add the selected rows host enclosure to an exclusion list. The errors from that host will no longer be reported and the current errors will be purged from the database.

  3. Select a row and click Ignore Storage to add the selected rows storage enclosure to an exclusion list.

  4. Select a row and click Ignore Host Storage Pair to add the selected rows host-storage pair enclosure to an exclusion list.

  5. In the drop-down list next to Show on the upper right corner of the table, select Quick Filter. Enter the keywords in the column headers of the table to filter the items. Select All to display all the items.

  6. Click the circulation icon on the upper right corner of the table to refresh the table.

  7. Click the Print icon on the upper right corner of the table to print the errors as tables.

  8. Click the Export icon on the upper right corner of the table to export the table to a Microsoft excel spreadsheet.

Step 4

Click the Ignored Hosts tab to display the list of host enclosures that have been skipped or ignored by the redundancy check along with the reason the reason for skipping. The following reasons may be displayed:

  • Skipped: Enclosure has only one HBA.
  • Host was ignored by the user.
  • Host ports managed by more than one federated servers. Check can't be run.
  • Skipped: No path to storage found.

Select a host enclosure and click Delete to remove the host from the ignored list and begin receiving errors about a host you had chosen to ignore. However, you can delete entries with message Host was ignored by user.

Step 5

Click the Ignored Storage tab to display the list of storage enclosures that have been selected to be ignored during the redundancy check. Select a storage enclosure and click Delete to remove the storage from the ignored list and begin receiving errors about the storage you had chosen to ignore.

Step 6

Click the Ignored Host Storage Pair tab to display the list of host-storage pairs that have been selected to be ignored during the redundancy check. Select a row and click Delete to delete the storage pair from the ignored list.


Slow Drain Analysis

The Slow Drain Analysis enables you to view slow drain statistics at the switch level and the port level. You can monitor the slow drain issue within any duration. You can display the data in a chart format and export the data for analysis. You can also view the topology that provides a high-level view of txwait, drops, credit loss recovery, over utilization, and port monitor events.

The slow drain statistics are stored in the cache memory. Therefore, the statistics are lost when the server is restarted or a new diagnostic request is placed.

You can also watch the video and demonstrate how to use SAN Insights to identify if there are any slow drain metrics incrementing across a fabric using a Cisco DCNM. See Video: Slow Drain Analysis with SAN Insights.


Note

The jobs run in the background, even after you log off.


Procedure


Step 1

Choose Monitor > SAN > Slow Drain Analysis.

Step 2

In the Scope field, select the fabric from the drop-down list.

Step 3

In the Duration drop-down list, select Once or Daily for the scheduled daily job. Once includes intervals, such as 10 min, 30 min, 1 hour, and other hours and run the job immediately. Daily allows you to select a start time, and run the job for the selected interval. Use the radio button to select the desired interval to collect data.

Only Daily slow drain job sends out report, which can be viewed from Monitor > Report > View.

Step 4

Click Start Collection to begin polling.

The server collects the slow drain statistics based on the scope defined by you. The Time Remaining is displayed in the right-side of the page.

Step 5

Click Stop Collection to stop polling.

The server maintains the counters in the cache, until a new diagnostic request is placed. You can stop the polling before the time is up.

Step 6

Click the arrow next to Current jobs to display the slow drain details for the jobs running on the fabric. The Fabric Name, the Status of polling, Start, End, and Duration icon for each fabric is displayed.

Step 7

Select the fabric and click Result, Delete or Stop to view, delete or stop a job.

A topology of the selected fabric will appear if you select a fabric and click Result, along with the slow drain details. See Slow Drain Visualization for more information.

Step 8

Click Detail to view the saved information.

Step 9

Click Interface chart to display the slow drain value for the switch port in the chart format.

Step 10

Click Filter to display the details based on the defined value for each column.

Step 11

Select the Data Rows Only check box to filter and display the nonzero entries in the statistics.

Step 12

Click Print to print the slow drain details.

Step 13

Click Export to export the slow drain statistics to a Microsoft Excel spreadsheet.


Slow Drain Visualization

A topology of the selected fabric appears if you select a fabric and click Result, along with the slow drain details. The topology window shows color-encoded nodes and links that correspond to various network elements. For each of the elements, you can hover over to fetch some more information. The links and switches are color-coded. Enable performance collections and SNMP traps to view the slow drain information on the topology. Choose Administration > Performance Setup > SAN Collections and enable the performance collections. See Performance Manager SAN Collections for more information on enabling the performance collections. Choose Administration > Event Setup > Registration and enable SNMP traps. See for more information on enabling SNMP traps.

The following table lists the color description that is associated with the links and switches.

Table 1. Color Description

Color

Name

Description

Blue (light)

Level 5

High utilization tx-datarate >= 80%

Green

Level 4

No slow drain found

Red

Level 3

Credit loss recovery

Orange

Level 2

Drops

Yellow (dark)

Level 1.5

txwait >= 30%

Yellow (light)

Level 1

txwait < 30%

Gray (light)

No Data

No Data

A switch color represents the highest level slow drain that is found on any link to switch. The maximum value is 3 and the minimum value is 1. A switch has two colors if overutilized. The right half of the switch is colored in light blue to represent the overutilization. A number on the switch represents the number of F ports with the slow drain. The color around the number represents the highest level slow drain that is found on F ports of the switch. Click the switch to see more slow drain details. Double click the switch to filter the slow drain table to view the slow drain data of that switch alone.

Two parallel lines are used to represent the slow drain on links. Links are bidirectional, hence each direction has a color to represent the highest level of slow drain. Hover over a link to view the switch and interface name of the source and destination. Double click a link to filter the slow drain table to view the slow drain data that is related to that link alone.


Note

The highest slow drain level a link can have is Level 4. Valid colors for a link are Green, Red, Orange, Yellow (dark), Yellow (light), and Gray (light).


Viewing Inventory Information for Regular Zones

To view the inventory information for regular zones from the Cisco DCNM Web UI, perform the following steps:

Procedure


Step 1

Choose Monitor > SAN > Regular Zones.

The Regular Zones window appears.

Step 2

Click the Settings icon to choose the displaying columns.


What to do next

From Cisco DCNM Release 11.4(1), you can migrate pWWN-based SAN zones from a Brocade switch to a Cisco MDS switch using the Zone Migration tool.

This feature supports migration of Brocade’s fabric switches running Brocade Fabric OS v7.x.x or later in this release.

Zone Migration Tool

From Cisco DCNM Release 11.4(1), you can migrate pWWN-based SAN zones from a Brocade switch to a Cisco MDS switch. This involves the following steps:

  1. Generate the Brocade configuration files.

  2. Convert the files using the zone migration tool to make them compatible with Cisco MDS switches.

  3. Apply the generated zoning output to Cisco MDS switches.

This feature supports migration of Brocade’s fabric switches running Brocade Fabric OS v7.x.x or later in this release.

Generating Brocade Configuration File

Before you migrate a Brocade SAN zone to a Cisco MDS switch using Cisco DCNM, generate the Brocade configuration files.

You can generate the Brocade configuration files using one of the following options:

  • Using CLI: Log in to the Brocade switch terminal using the admin or other equivalent role with admin access. Run the cfgshow command. Copy the command output to a text file, and save it.

  • Using Brocade Fabric OS Web tools: Download the Zoning Information file from the Switch Administration window. See the Viewing and Printing a Switch Report section from the Brocade Fabric OS Web Tools Administration Guide for more information.

Converting Configuration Files Using the Zone Migration Tool

To convert the Brocade configuration files using Cisco DCNM, perform the following steps from Cisco DCNM Web UI:

Procedure

Step 1

Choose Monitor > SAN > Regular Zones.

Step 2

Click Zone Migration Tool button.

The Zone Migration Tool dialog box appears.

Step 3

Click Select Input File and choose a Brocade configuration file from your system.

Step 4

Enter the VSAN number to which the zone must be added.

The valid range is 1 to 4093.

Step 5

(Optional) Check Enhanced Zone Mode or Enhanced Device-Alias Mode check boxes.

Note 

Refer the Configuring and Managing Zones chapter and the Distributing Device Alias Services chapter from the Cisco MDS 9000 Fabric Configuration guide to see the advantages of enhanced zone mode and enhanced device-alias mode.

Step 6

Click Convert to start the conversion.

If there are no errors, the converted file will be downloaded to your local system.

Note 
  • If you try converting any hard zones or interface-based zones, you will get an error.

  • If you try to migrate more than 2000 fcAlias zones from Brocade to Cisco MDS, they will be converted into device-alias zones.


What to do next

Run the downloaded file in a Cisco MDS switch.

Applying the Zoning Output on Cisco MDS Switches

After you convert Brocade configuration files to a format compatible with the Cisco MDS switches, apply them on your Cisco MDS switch.

To apply the output on a Cisco MDS switch, perform the following steps:

Procedure

Step 1

Log into your Cisco MDS switch console.

Step 2

Open the converted file using a text editor.

Step 3

Open the converted file using a text editor.

Step 4

Save the configurations using the copy running-config startup-config command.

The zones are migrated to the Cisco MDS switch.


Viewing Inventory Information for IVR Zones

To view the inventory information for IVR zones from the Cisco DCNM Web UI, perform the following steps:

Procedure


Step 1

Choose Monitor > SAN > IVR Zones.

The IVR Zones window is displayed with inventory details of the fabrics for the IVR zone.

Step 2

Click the Settings icon to choose the displaying columns.


Monitoring Insights Flows

The SAN Insights page displays the health-related indicators in the interface so that you can quickly identify issues in your environment. You can use health indicators to understand where problems are in your fabrics.

From Release 11.3(1), Cisco DCNM allows you to view SAN Insights metrics based on two protocols, SCSI and NVMe. By default, the SCSI protocol is selected. However, you can change this setting from the Administration > DCNM Server > Server Properties. Ensure that you restart the SAN Insights service to use the new properties. (Restart the SanInsight service on Linux or Pause/Resume Post Processor App on SAN-OVA/ISO/SE deployments)


Note

If the interface is down, it’s displayed in grey color.


Procedure


Step 1

To monitor the SAN Insights feature, choose Monitor > SAN > SAN Insights. The SAN Insights page appears.

Monitor SAN Insights

This page provides the basis for Insights data visualization showing counter data, visual topology map with indicators on the map. Also, you can view analytical information and historical insights. From Cisco DCNM Release 11.3(1), you can choose the data type to stream SAN Insights data. Select SCSI or NVMe to select the data type. The system time is displayed at the right corner of the window.

In Monitor > SAN Insights window, you can perform the tasks that are mentioned in the steps below.

The color of the status is arrived as an hourly average of Read and Write deviation for the respective Initiator Target Pairs.

Note 

Click the red status balls to View SAN Insights Metrics under the Read (% dev) or Writer (% dev) columns of the Initiator-target Pair table to navigate to the ECT Analysis page for more details on the respective Initiator-Target pair.

Step 2

View details about Host Enclosure, Storage Enclosure, or IT Pairs.

You can choose to view the enclosure details based on the average values as shown in the figure below. The Host Enclosures, Storage Enclosures, or IT-pairs can be filtered using the quick-filter functionality.

enclosure details

By default, the filter type Average ECT Deviation is selected. The Initiator target Pairs display the status of Read and Write deviation as colored status balls, upon which you can click to View SAN Insights Metrics. However, for all other filter types, the status of Read and Write percentage deviation is displayed in numerical format.

You can sort the Enclosures/IT-Pairs by Read/Write operation for the filtered metric. Click on the column headers to change the sorting. By default, it’s sorted by Read operation.

Step 3

Select time interval (such as now, 6-hours ago, 12-hours ago) to calculate status and fetch flow and port counters.

Step 4

For each selected enclosure, view initiator target pair details such as Source Alias, SID, Destination Alias, DID, Fabric name, Read (% dev) and Writer (% dev).

view initiator target pair details

You can click the Status circle icon under Read (% dev) or Writer (% dev) columns in the Initiator-target Pair table to navigate to the ECT Analysis window, with corresponding Initiator and Target WWPNs prefiltered.

monitoring SAN Insights

Step 5

Use the map to view end-to-end connectivity from initiator to target. Host, storage, and switch have colored status indications. The color codes in the Topology area are only for the switch status. The switch color is governed by the Health score calculated for each switch. Double click on the colored switch icons to view the switch overlay for more details.

The switch interfaces also have status indications. The switch interface is rendered as a small circle at the end of the link that is attached to the switch. Selecting a switch interface populates one of the counter tables. Map displays latest connectivity (not affected by time slider setting).

Step 6

View counter data for the selected flow and switch interface.

The data in the Switch Interface table is populated from Performance Monitoring and Slow Drain. You must enable Performance Monitoring for the fabric and schedule Slow Drain jobs. This table shows NA, otherwise.

To enable Performance Monitoring, choose Administration > Performance Setup > SAN Collections. Select the Fabric to monitor. Select all the parameter check boxes against the Fabric. Click Apply to begin Performance Monitoring.

To enable Slow Drain metrics, choose Monitor > SAN > Slow Drain Analysis. Configure a current job on the Fabric. On the Monitoring SAN Insights, click the interface on the map. The Slow Drain Metrics is displayed in the Switch Interface table.

  • Select the IT flow to display the topology and the flow metrics from the switch telemetry infrastructure in the bottom-left table.

    Select the specific interface in the topology view to display interface metrics from port-monitoring infrastructure. Beginning from Release 11.4(1), the interface corresponding the enclosure/IT pair selected is selected by default.

Step 7

On the Flow table and the Switch Interface tables, click on show chart icon 
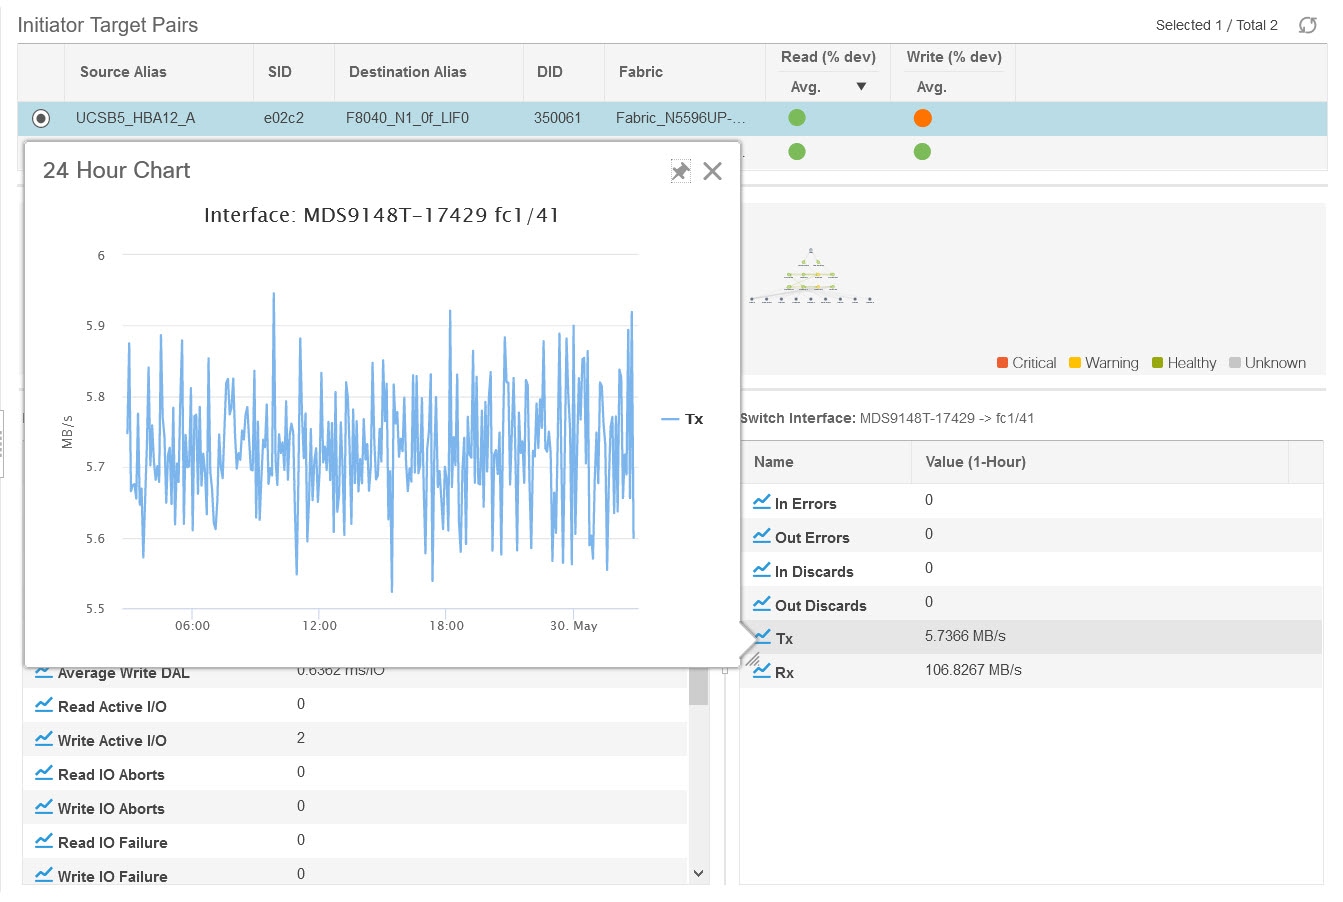
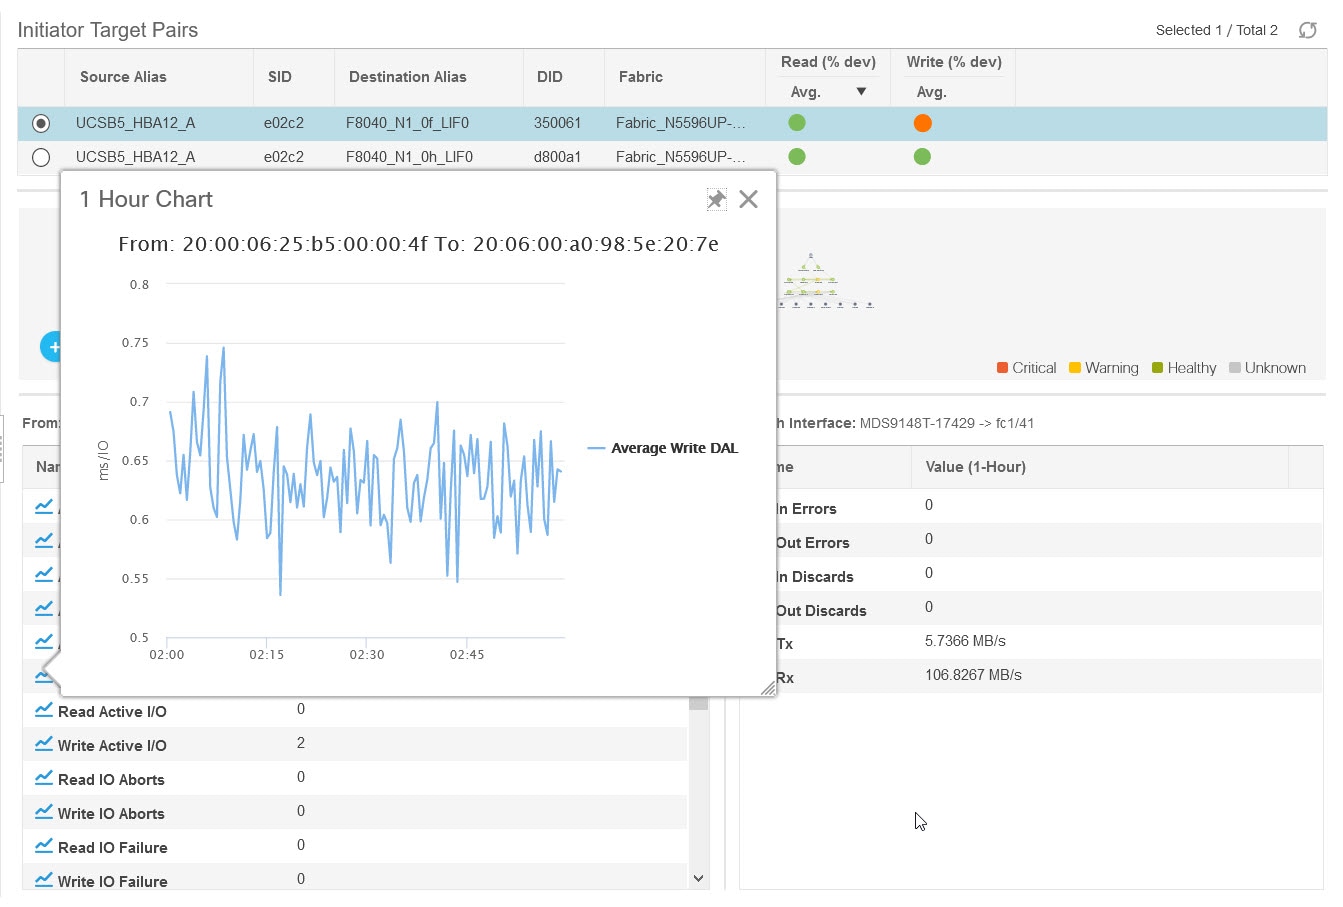
icon to view the 24-hour chart.

Switch Interface 24-hour chartFlow table 1-hour chart


Viewing Host Enclosures

From Release 11.3(1), Cisco DCNM allows you to view SAN Insights metrics based on two protocols, SCSI and NVMe. By default, the SCSI protocol is selected. However, you can change this setting from the Administration > DCNM Server > Server Properties. Ensure that you restart the SAN Insights service to use the new properties. (Restart the SanInsight service on Linux or Pause/Resume Post Processor App on SAN-OVA/ISO/SE deployments)

To view the Host Enclosures from the Cisco DCNM Web UI, perform the following steps:

  1. Choose Monitor > SAN > SAN Insights, and then choose Host Enclosure.

    Host Enclosures

  2. Specify a time interval using the time slider.

  3. Select a host from the Host Enclosures table, which lists all the host enclosures.

  4. Select one initiator-target pair from the Initiator Target Pairs table.

    This table lists all the initiator-target pairs for the selected host. The flow table shows the details of all metrics on ECT/DAL/read/write times, active I/Os, aborts, failures etc. along with their 1-hour average and the baseline information.

  5. Select a switch interface from the topology map.

    From Release 11.4(1), the switch interface is picked and selected by default. The Switch Interface table displays data for the last hour period selected for the selected interface. The switch name and the interface name are displayed on top of the switch interface table.

  6. Click on the Status circle icon under Read (% dev) or Write (% dev) columns in the Initiator-target Pair table to navigate to the ECT Analysis window, with corresponding Initiator and Target WWPNs prefiltered.

Viewing Storage Enclosures

From Release 11.3(1), Cisco DCNM allows you to view SAN Insights metrics based on two protocols, SCSI and NVMe. By default, the SCSI protocol is selected. However, you can change this setting from the Administration > DCNM Server > Server Properties. Ensure that you restart the SAN Insights service to use the new properties. (Restart the SanInsight service on Linux or Pause/Resume Post Processor App on SAN-OVA/ISO/SE deployments)

To view the Storage Enclosures from the Cisco DCNM Web UI, perform the following steps:

  1. Choose Monitor > SAN > SAN Insights, and then choose Storage Enclosure.

    Storage Enclosures

  2. Specify a time interval using the time slider.

  3. Select a storage enclosure from the Storage Enclosures table.

  4. Select an initiator-target pair from the Initiator Target Pairs table.

  5. Click on the Status circle icon under Read (% dev) or Write (% dev) columns in the Initiator-target Pair table to navigate to the ECT Analysis window, with corresponding Initiator and Target WWPNs prefiltered.

  6. View the topology map represented for the selected initiator-target pair and the flow metrics.

    The flow metrics are displayed in the flow table.

  7. Select a switch interface from the topology map.

    The Switch Interface table displays data for the selected interface. From Release 11.4(1), the switch interface is picked and selected by default.

Viewing IT Pairs

From Release 11.3(1), Cisco DCNM allows you to view SAN Insights metrics based on two protocols, SCSI and NVMe. By default, the SCSI protocol is selected. However, you can change this setting from the Administration > DCNM Server > Server Properties. Ensure that you restart the SAN Insights service to use the new properties. (Restart the SanInsight service on Linux or Pause/Resume Post Processor App on SAN-OVA/ISO/SE deployments)

To view the IT Pairs from the Cisco DCNM Web UI, perform the following steps:

  1. Choose Monitor > SAN > SAN Insights, and then choose IT Pairs.

    Viewing IT Pairs

  2. Specify a time interval using the time slider.

  3. Choose a flow from the IT Pairs table.

    The initiator-target pairs are listed in the Initiator Target Pairs table, the topology map is represented for the selected I-T pair. The flow metrics are displayed in the IT Pairs table.

  4. The flow table in this window shows details about all metrics on ECT/DAL/read/write times, active I/Os, aborts, failures, and so on.

    Also, the flow table shows 1-hour average and the baseline information.

  5. Click the status ball in the Initiator Target Pairs table.

    24-hour normalized R/W ECT deviation chart is displayed for the selected IT-pair.

  6. Select a switch interface from the topology map.

    The Switch Interface table displays data for the selected interface.

Monitoring LAN

The LAN menu includes the following submenus:

Monitoring Performance Information for Ethernet

To monitor the performance information for ethernet from the Cisco DCNM Web UI, perform the following steps:

Procedure


Step 1

Choose Monitor > LAN > Ethernet.

The Ethernet window is displayed.

Step 2

You can use the drop-down to filter the view by Last 10 Minutes, Last Hour, Last Day, Last Week, Last Month, and Last Year.

There are variations to this procedure. In addition to these basic steps, you can also perform the following steps:

  • Select the name of an Ethernet port from the Name column to see a graph of the traffic across that Ethernet port for the past 24 hours. You can change the time range for this graph by selecting it from the drop-down list in the upper-right corner.

  • To export the data into a spreadsheet, click the Export icon in the upper-right corner and click Save.

  • Use the chart icons to view the traffic chart in varied views. You can also use the icons to Append, Predict, and Do not interpolate data.

    Note 

    Set the pmchart.doInterpolate property in the Server Properties window to false to use the Do not interpolate data option.

  • For the Rx/Tx calculation, see the following Rx/Tx calculation.

    Note 
    The conversion for Fabrics is 10 bit = 1 byte and for LAN traffic, the conversion is 8 bit = 1 byte.
    • Average Rx/Tx % = Average Rx/Tx divided by Speed * 100

    • Peak Rx/Tx % = Peak Rx/Tx divided by Speed * 100

Note 
If the performance tables do not contain any data, see the Thresholds section to turn on performance data collection.
Note 

To change traffic display unit from bytes to bits, From Cisco DCNM Web UI, choose Administration > DCNM Server > Server Properties, enter value as true for pm.showTrafficUnitAsbit property, and click Apply Changes.


Monitoring ISL Traffic and Errors

To monitor the ISL traffic and errors from the Cisco DCNM Web UI, perform the following steps:

Procedure


Step 1

Choose Monitor > LAN > Link.

The ISL Traffic and Errors window is displayed. This panel displays the ISL information for the end devices in that scope. You can reduce or expand the scope of what is displayed by using the scope menu.

Step 2

You can use the drop-down to filter the view by Last 10 Minutes, Last Hour, Last Day, Last Week, Last Month, and Last Year.

Note 
NaN (Not a Number) in the data grid means that the data is not available.

There are variations to this procedure. In addition to these basic steps, you can perform the following steps to view detailed information for ISLs:

  • To change the time range for this graph, select it from the drop-down list in the upper-right corner.

  • To view the detailed information for a specific period, drag the slider control to choose the time interval for which you need the information.

  • Use the chart icons to view the traffic chart in varied views. You can also use the icons to Append, Predict, and Do not interpolate data.

    Note 

    Set the pmchart.doInterpolate property in the Server Properties window to false to use the Do not interpolate data option.

  • To export the data into a spreadsheet, choose Export from the drop-down list in the Chart menu and then click Save.

  • For the Rx/Tx calculation, see the following Rx/Tx calculation.

    Note 
    The conversion for Fabrics is 10 bit = 1 byte and for LAN traffic, the conversion is 8 bit = 1 byte.
    • Average Rx/Tx % = Average Rx/Tx divided by Speed * 100

    • Peak Rx/Tx % = Peak Rx/Tx divided by Speed * 100

Note 
If the performance tables do not contain any data, see the Performance Setup Thresholds section to turn on performance.

Monitoring a vPC

The virtual port channel (vPC) feature enables you to view the links that are physically connected to different devices as a single port channel. A vPC is an extended form of a port channel which allows you to create redundancy and increase bisectional bandwidth by enabling multiple parallel paths between nodes and allowing load balancing traffic. Traffic is distributed among two single device vPC endpoints. If there is an inconsistency in the vPC configurations, the vPC does not function correctly.


Note

To view the vPC in vPC Performance, both primary and secondary device should be designated to the user. If either one kind of switch is not designated, vPC information is isplayed.


Cisco DCNM Web Client > Monitor> vPC displays only consistent vPCs displays both the consistent and inconsistent vPCs.

You can identify the inconsistent vPCs and resolve the inconsistencies in each vPC by using the Cisco DCNM Web UI > Configure > Deploy > vPC Peer and Web Client > Configure > Deploy > vPC.

Table 1 displays the following vPC configuration details in the data grid view.

Table 2. vPC Performance

Column

Description

Search box

Enter any string to filter the entries in their respective column.

vPC ID

Displays vPC ID's configured device.

Domain ID

Displays the domain ID of the vPC peer switches.

Multi Chassis vPC EndPoints

Displays the multi-chassis vPC endpoints for each vPC ID under a vPC domain.

Primary vPC Peer - Device Name

Displays the vPC Primary device name.

Primary vPC Peer - Primary vPC Interface

Displays the primary vPC interface.

Primary vPC Peer - Capacity

Displays the capacity for the primary vPC peer.

Primary vPC Peer - Avg. Rx/sec

Displays the average receiving speed of primary vPC peer.

Primary vPC Peer - Avg. Tx/sec

Displays the average sending speed of primary vPC peer.

Primary vPC Peer - Peak Util%

Displays the peak utilization percentage of primary vPC peer.

Secondary vPC Peer - Device Name

Displays the vPC secondary device name.

Secondary vPC Interface

Displays the secondary vPC interface.

Secondary vPC Peer - Capacity

Displays the capacity for the secondary vPC peer.

Secondary vPC Peer - Avg. Rx/sec

Displays the average receiving speed of secondary vPC peer.

Secondary vPC Peer - Avg. Tx/sec

Displays the average sending speed of secondary vPC peer.

Secondary vPC Peer - Peak Util%

Displays the peak utilization percentage of secondary vPC peer.

You can use this feature as following:

Monitoring vPC Performance

You can view the relationship among consistent virtual port channels (vPCs). You can view the statistics of all member interfaces and the aggregate of the statistics at the port-channel level.


Note

This tab only displays consistent vPCs.


To view the VPC performance information from the Cisco DCNM Web UI, perform the following steps:

Procedure

Step 1

Choose Monitor > LAN > vPC.

The vPC Performance statistics is displayed. The aggregated statistics of all vPCs are displayed in a tabular manner.

Step 2

Click the vPC ID.

The vPC topology, vPC Details, Peer-link Details, and Peer-link Status are displayed.

The vPC Consistency, Peer-link Consistency, and vPC Type2 Consistency for the vPC are displayed.

  • Click the vPC Details tab, you can view the parameter details of vPC Basic Setting and Layer 2 Settings for both Primary and Secondary vPC devices.

  • Click the Peer-link Details tab, to view the parameter details of peer-link vPC Global Setting and STP Global Settings for both Primary and Secondary vPC devices.

  • Click the Peer-link Status tab, the vPC Consistency, and Peer-Link Consistency status is displayed. The parameter details of Role Status and vPC Peer keep-alive Status for both Primary and Secondary vPC devices is also displayed.

Step 3

Click the peer-link icon in front of the Device Name in the Primary vPC peer or Secondary vPC peer column to view its member interface.

Step 4

Click the Show Chart icon of the corresponding interface to view its historical statistics.

The traffic distribution statistics appear at the bottom of the vPC window. By default, the Cisco DCNM Web Client displays the historical statistics for 24 hours.

There are variations to this procedure. In addition to these basic steps, you can also perform the following steps to view detailed information for flows:

  • To change the time range for this graph, select it from the drop-down list in the upper right corner.

  • To view the detailed information for a specific period, drag the slider control to choose the time interval for which you need the information.

  • Use the chart icons to view the traffic chart in varied views.

  • You can also use the icons to Append, Predict, and Do not interpolate data.

    Note 

    Set the pmchart.doInterpolate property in the Server Properties window to false to use the Do not interpolate data option.

  • To print the vPC Utilization data, click the Print icon in the upper-right corner. The vPC Utilization page appears.

  • To export the data into a spreadsheet, click the Export icon in the upper-right corner and click Save File.

Note 
If the performance tables do not contain any data, see the Thresholds section to turn on performance data collection.

Monitoring Report

The Report menu includes the following submenus:

Viewing Reports

You can view the saved reports that are based on the following selection options:

  • By Template

  • By User

  • From the menu bar, select Monitor > Report > View.

To view the reports from the Cisco DCNM Web UI, perform the following steps:

Procedure


Step 1

In the left pane, expand By Template or By User folder.

Step 2

Select the report that you wish to view.

You can view the report in the main screen or you can select the report in the Report column to view the HTML version of the report in a new browser.

Step 3

To delete a specific report, select the check box and click the Delete icon.

Step 4

To delete all reports, check the check box in the header, and click the Delete icon.

Note 
If you have multiple fabrics, you can select the DCNM-SAN group in the Scope to view Host to Storage connectivity of multiple fabrics in a single report.

The report is divided into two sections:

  • A summary report for all the devices that have faulty modules. The table displays information for every device that includes the device hostname, number of faulty modules, and the module number with its PID.

  • The information for the device of the module. The table contains details about the tests failed.


Generating a Report

You can generate reports that are based on a selected template or you can schedule the report to run at a specified time.

Procedure


Step 1

From the menu bar, select Monitor > Report > Generate.

You see the Generate Report window.

Step 2

In the configuration window, use the drop-down to define the scope for report generation.

In the Scope drop-down, you can select a scope group with dual fabrics, the traffic data that is generated by hosts and storage end devices are displayed side by side which enables you to view and compare traffic data that is generated on dual fabrics. To view this report, in the Other Predefined folder, select Traffic by VSAN (Dual Fabrics). Click Options to select the Device Type and Fabrics. Click Save to save the configuration.

Step 3

In the pane on the left, expand the folders and select the report.

Step 4

(Optional) In the pane on the right, you can edit the Report Name.

Step 5

(Optional) Check the Export to Csv/Excel check box to export the report to a Microsoft Excel spreadsheet.

Step 6

In the Repeat radio buttons, if you select:

  • Never - The report is generated only during the current session.

  • Once - The report is generated on a specified date and time apart from the current session.

  • Daily - The report is generated everyday based on the Start and End date at a specified time.

  • Weekly - The report is generated once a week based on the Start and End date at a specified time.

  • Monthly - The report is generated once every month based on the Start and End date at a specified time.

When you generate a report for Network Configuration Audit, the daily job generates a report for the selected devices for last one day. Similarly, the weekly job generates a report for the last 7 days, and the monthly job generates a report for the last 30 days.

Step 7

Click the Create button to generate a report that is based on the specifications.

You see the report results in a new browser window.

Alternatively, you can view the report by choosing Monitor > Report > View and selecting the report name from the report template that you used in the navigation pane.

Note 
The Start Date must be at least five minutes earlier than the End Date.

The report is divided into two sections:

  • A summary report for all the devices that have faulty modules. The table displays information for every device that includes the device hostname, number of faulty modules and the module number with its PID.

  • A detailed information for the device of the module. The table contains details about the tests failed.


Creating SAN User Defined Reports

You can create custom reports from all or any subset of information that is obtained by Cisco DCNM-SAN. You create a report template by selecting events, performance, and inventory statistics you want in your report and set the desired SAN, fabrics, or VSAN to limit the scope of the template. You can generate and schedule a report of your fabric that is based on this template immediately or later. Cisco DCNM Web Client saves each report, which is generated based on the report template, and the time you generate the report.

Since the Cisco MDS NX-OS Release 5.0, the report template design has changed to resolve the limitations of the earlier versions. With the new design model, you can perform add, delete, and modify functionalities on a single page. You can choose multiple fabrics and VSANs using the new navigation system, which allows you to add new items and categories in the future.

The new design model has three panels:

  • Template panel - The Template panel allows you to add new templates, modify existing templates and delete existing templates.
  • Configuration panel - The Configuration panel allows you to configure a new template when it is added, and modify an existing template. The options in the configuration panel are disabled until you either add a new template or select an existing template. The upper portion of the configuration panel contains many categories that you can choose and configure.
  • User Selection panel - The User Selection panel displays your configuration options in real time. While the configuration panel can display information pertaining to one category at a time, the User Selection panel displays all of your selections or configurations.

To create custom reports from the Cisco DCNM Web UI, perform the following steps:

Procedure


Step 1

Choose Monitor > Report > User Defined.

The Create User-Defined window is displayed.

Step 2

In the Template panel, under the Name column, select CLICK TO ADD NEW CUSTOM to edit the Name of the new report.

Step 3

In the Configuration panel, click Scope to define scope of the report. The default scope includes Data Center, SAN, LAN, and Fabric configurations.

Step 4

Click Inventory and use the checkbox to select the inventory information that is required in the report. You can also use the drop-down to filter by selecting the Top performance and the timeline that is required in the report.

Step 5

Click Performance and use the checkbox to select the performance information required in the report.

Step 6

Click Health and use the checkbox to select the health information required in the report.

Step 7

Click Save to save this report template.

A confirmation message is displayed confirming that the report is saved.


Deleting a Report Template

To delete a report template from the Cisco DCNM Web UI, perform the following steps:
Procedure

Step 1

In the Template panel, select the report template that you want to delete.

Step 2

Click the Delete icon to delete the report.

Step 3

In the confirmation pop-up, click Yes to delete the template.


Modifying a Custom Report Template

Procedure

Step 1

Choose Monitor > Report > User Defined.

You see the Template, Configuration, and User Selection panels.

Step 2

Select a report from the Template panel.

You see the current information about this report in the User Selection panel.

Step 3

Modify the information in the Configuration panel.

Step 4

Click Save to save the report template.

A confirmation message is displayed confirming that the report is saved.

Note 
You cannot change the scope for an existing report. Generate a new report for a new scope.

Viewing Scheduled Jobs Based on a Report Template

To view the scheduled jobs that are based on a report template from the Cisco DCNM Web UI, perform the following steps:

Procedure


Step 1

Choose Monitor > Report > Jobs.

The Report Jobs window is displayed with details of the reports that are scheduled for generation along with its status.

Step 2

Select the checkbox for a specific report and click the Delete Job icon to delete a report.


Alarms

The Alarms menu includes the following submenus:

Viewing Alarms and Events

You can view the alarms, cleared alarms, and events.

Procedure


Step 1

Choose Monitor > Alarms > View.

Step 2

Choose any of the following tabs.

  • Alarms: This tab displays the alarms that are generated for various categories. This tab displays information such as ID (optional), Severity, Failure Source, Name, Category, Acknowledged, Creation Time, Last Updated (optional), Policy, and Message. You can specify the Refresh Interval in this tab. You can select one or more alarms and then acknowledge or unacknowledge their status using the Change Status drop-down list. In addition, you can select one or more alarms and then click the Delete button to delete them.
  • Cleared Alarms: This tab displays the cleared alarms. This tab displays information such as ID (optional), Severity, Failure Source, Name, Category, Acknowledged, Creation Time, Cleared At (optional), Cleared By, Policy, and Message. You can select one or more alarms and then click the Delete button to delete them.
  • Events: This tab displays the events that are generated for the switches. This tab displays information such as Ack, Acknowledged user, Group, Switch, Severity, Facility, Type, Count, Last Seen, and Description. You can select one or more events and then acknowledge or unacknowledge their status using the Change Status drop-down list. In addition, you can select one or more alarms and then click the Delete button to delete them. If you want to delete all events, click the Delete All button.

Monitoring and Adding Alarm Policies


Note

  • Alarm policies are stored in compute nodes. Therefore, run the appmgr backup command on each compute node in addition to taking a backup of DCNM.

  • In case the Monitor>Alarms>Policies window was open while migrating the Performance Manager data, the alarm index may get deleted. In such scenarios, restart the DCNM server for the alarm policies to work as expected.


In Cisco DCNM SAN Federation deployment on Windows and Linux, ensure that the alarm.enable.external value in the Server Properties is set to true on both the Primary and Secondary nodes. Navigate to Administration > DCNM Server > Server Properties. Locate the alarm.enable.external field, and ensure that it is set to true. You must restart DCNM Server to bring this into effect.

You can forward alarms to registered SNMP listeners in DCNM. From Cisco DCNM web UI, choose Administration > DCNM Server > Server Properties, enter an external port address in alarm.trap.listener.address field, click Apply Changes, and restart DCNM services.


Note

Ensure that you select Forwarding check box in Alarm Policy creation dialog window to enable forwarding alarms to external SNMP listener.


You can add alarm policies for the following:

  • Device Health: Device health policies enable you to create alarms when Device ICMP Unreachable, Device SNMP Unreachable, or Device SSH Unreachable. Also, these policies enable you to monitor chassis temperature, CPU, and memory usage.

  • Interface Health: Interface health policies enable you to monitor Up or Down, Packet Discard, Error, Bandwidth details of the interfaces. By default all interfaces are selected for monitoring.

  • Syslog Alarm: Syslog Alarm Policy defines a pair of Syslog messages formats; one which raises the alarm, and one which clears the alarm.

Procedure


Step 1

Choose Monitor > Alarms > Alarm Policies.

Step 2

Select the Enable Alarms check box to enable alarm policies.

Step 3

From the Add drop-down list, choose any of the following:

  • Device Health Policy: Select the devices for which you want to create policies. Specify the policy name, description, CPU Utilization parameters, Memory Utilization parameters, Environment Temperature parameters, device availability, and device features. Under Device Features, you can select the BFD, BGP, and HSRP protocols. When these check boxes are selected, alarms are triggered for the following traps: BFD- ciscoBfdSessDown, ciscoBfdSessUp, BGP- bgpEstablishedNotification, bgpBackwardTransNotification, cbgpPeer2BackwardTransition (), cbgpPeer2EstablishedNotification, and HSRP- cHsrpStateChange. Please refer https://snmp.cloudapps.cisco.com/Support/SNMP/do/BrowseOID.do?local=en for detailed trap OID definition.
  • Interface Health Policy: Select the devices for which you want to create policies. Specify the policy name, description, link-state, Bandwidth (In/Out), Inbound errors, Outbound errors, Inbound Discards, and Outbound Discards.
  • Syslog Alarm Policy: Select the devices for which you want to create policies and then specify the following parameters.
    • Devices: Define the scope of this policy. Select individual devices or all devices to apply this policy.

    • Policy Name: Specify the name for this policy. It must be unique.

    • Description: Specify a brief description for this policy.

    • Severity: Define the severity level for this syslog alarm policy. Choices are: Critical, Major, Minor, and Warning.

    • Identifier: Specify the identifier portions of the raise & clear messages.

    • Raise Regex: Define the format of a syslog raise message. The syntax is as follows: Facility-Severity-Type: Message

    • Clear Regex: Define the format of a syslog clear message. The syntax is as follows: Facility-Severity-Type: Message

    The Regex definitions are simple expressions but not a complete regex. Variable regions of text are noted using $(LABEL) syntax. Each label represents a regex capture group (.+), which corresponds to one or more characters. The variable texts found in both raise and clear messages are used to associate the two messages. An Identifier is a sequence of one or more labels that appear in both messages. An Identifier is used to match a clear syslog message to the syslog message that raised the alarm. If the text appears only in one of the messages, it can be noted with a label and exclude it from the identifier.

    Example: A policy with "Value": "ID1-ID2",

    "syslogRaise": "SVC-5-DOWN: $(ID1) module $(ID2) is down $(REASON)"

    "syslogClear": "SVC-5-UP: $(ID1) module $(ID2) is up."

    In the example, ID1 and ID2 labels can be marked as an identifier to find the alarm. This identifier will be found in corresponding syslog messages. Label “REASON” is in the raise but not in the clear message. This label can be excluded from the identifier, as it has no impact on the syslog message to clear the alarm.

    Table 3. Example 1

    Identifier

    ID1-ID2

    Raise Regex

    ETHPORT-5-IF_ADMIN_UP: Interface Ethernet15/1 is admin up .

    Clear Regex

    ETHPORT-5-IF_DOWN_NONE: Interface Ethernet15/1 is down (Transceiver Absent)

    In the above example, the regex expressions are part of the syslog messages that appear in the terminal monitor.

    Table 4. Example 2

    Identifier

    ID1-ID2

    Raise Regex

    ETH_PORT_CHANNEL-5-PORT_DOWN: $(ID1): $(ID2) is down

    Clear Regex

    ETH_PORT_CHANNEL-5-PORT_UP: $(ID1): $(ID2) is up

    Table 5. Example 3

    Identifier

    ID1-ID2

    Raise Regex

    ETHPORT-5-IF_SFP_WARNING: Interface $(ID1), High Rx Power Warning

    Clear Regex

    ETHPORT-5-IF_SFP_WARNING: Interface $(ID1), High Rx Power Warning cleared

Step 4

Click OK to add the policy.


Syslog Messages in Terminal Monitor and Console

The following examples show how the syslog messages appear in the terminal monitor and the console. The regex expression is matched with the part of the syslog messages after the % sign.

leaf-9516# terminal monitor
leaf-9516# conf t
leaf-9516(config)# int e15/1-32
leaf-9516(config-if-range)# no shut
2019 Aug 2 04:41:27 leaf-9516 %ETHPORT-5-IF_ADMIN_UP: Interface
Ethernet15/1 is admin up .
2019 Aug 2 04:41:27 leaf-9516 %ETHPORT-5-IF_DOWN_NONE: Interface
Ethernet15/1 is down (Transceiver Absent)
2019 Aug 2 04:41:27 leaf-9516 %ETHPORT-5-IF_ADMIN_UP: Interface
Ethernet15/2 is admin up .
2019 Aug 2 04:41:27 leaf-9516 %ETHPORT-5-IF_DOWN_NONE: Interface
Ethernet15/2 is down (Transceiver Absent)
2019 Aug 2 04:41:28 leaf-9516 %ETHPORT-5-IF_ADMIN_UP: Interface
Ethernet15/3 is admin up .

The syslog messages in the console have a similar format as they would appear in the terminal monitor, except for the additional port information enclosed in the %$ signs. However, the regex expression is matched with the part of the syslog messages after the last % sign.

SR-leaf1# 2019 Aug 26 23:55:45 SR-leaf1 %$ VDC-1 %$ %PLATFORM-1-
PFM_ALERT: FAN_BAD: fan6
2019 Aug 26 23:56:15 SR-leaf1 %$ VDC-1 %$ %PLATFORM-1-PFM_ALERT:
FAN_BAD: fan6
2019 Aug 26 23:56:18 SR-leaf1 %$ VDC-1 %$ %ASCII-CFG-2-CONF_CONTROL:
System ready
2019 Aug 26 23:56:25 SR-leaf1 %$ VDC-1 %$ %PLATFORM-1-PFM_ALERT:
FAN_BAD: fan6
2019 Aug 26 23:56:35 SR-leaf1 %$ VDC-1 %$ %PLATFORM-1-PFM_ALERT:
FAN_BAD: fan6
2019 Aug 26 23:56:39 SR-leaf1 %$ VDC-1 %$ %VMAN-2-ACTIVATION_STATE:
Successfully activated virtual service 'guestshell+'
2019 Aug 26 23:56:39 SR-leaf1 %$ VDC-1 %$ %VMAN-2-GUESTSHELL_ENABLED:
The guest shell has been enabled. The command 'guestshell' may be used
to access it, 'guestshell destroy' to remove it.
2019 Aug 26 23:56:45 SR-leaf1 %$ VDC-1 %$ %PLATFORM-2-FAN_REMOVED: Fan
module 5 (Serial number ) Fan5(sys_fan5) removed
2019 Aug 26 23:56:45 SR-leaf1 %$ VDC-1 %$ %PLATFORM-1-PFM_ALERT:
System will shutdown in 2 minutes 0 seconds due to fan policy
__pfm_fanabsent_any_singlefan.
2019 Aug 26 23:56:45 SR-leaf1 %$ VDC-1 %$ %PLATFORM-1-PFM_ALERT:
FAN_BAD: fan6
2019 Aug 26 23:56:54 SR-leaf1 %$ VDC-1 %$ %PLATFORM-1-PFM_ALERT:
System will shutdown in 1 minutes 40 seconds due to fan policy
__pfm_fanabsent_any_singlefan.
2019 Aug 26 23:56:54 SR-leaf1 %$ VDC-1 %$ %PLATFORM-1-PFM_ALERT:
FAN_BAD: fan6
2019 Aug 26 23:57:03 SR-leaf1 %$ VDC-1 %$ %PLATFORM-2-FANMOD_FAN_OK:
Fan module 5 (Fan5(sys_fan5) fan) ok
2019 Aug 26 23:57:03 SR-leaf1 %$ VDC-1 %$ %PLATFORM-1-PFM_ALERT:
FAN_BAD: fan6

Activating Policies

After you create new alarm policies, activate them.
Procedure

Step 1

Choose Monitor > Alarms > Policies.

Step 2

Select the policies that you want to activate and then click the Activate button.


Deactivating Policies

You can deactivate the active alarm policies.
Procedure

Step 1

Choose Monitor > Alarms > Policies.

Step 2

Select the policies that you want to deactivate and then click the Deactivate button.


Importing Policies

You can create alarm policies using the import functionality.
Procedure

Step 1

Choose Monitor > Alarms > Policies and then click the Import button.

Step 2

Browse and select the policy file saved on your computer.

You can only import policies in text format.


Exporting Policies

You can export the alarm policies into a text file.
Procedure

Step 1

From the menu bar, choose Monitor > Alarms > Policies.

Step 2

Click the Export button and then select a location on your computer to store the exported file.


Editing Policies

Procedure

Step 1

From the menu bar, choose Monitor > Alarms > Policies.

Step 2

Select the policy that you want to edit.

Step 3

Click the Edit button and then make necessary changes.

Step 4

Click the OK button.


Deleting Policies

Procedure

Step 1

From the menu bar, choose Monitor > Alarms > Policies.

Step 2

Select the policy that you want to delete.

Step 3

Click the Delete button. The policy is deleted.


Enabling External Alarms

You can enable external alarms using one of the following methods:

  • Using Cisco DCNM Web UI

    1. From Cisco DCNM Web UI, choose Administration > DCNM Server > Server Properties.

    2. Locate the alarm.enable.external property.

    3. Enter the value in the field as true.

  • Using REST APIs

    1. Go the API documentation URL from your DCNM setup: https://<DCNM-ip>/api-docs

    2. Navigate to the Alarms section.

    3. Click POST > rest/alarms/enabledisableextalarm.

    4. Choose the body parameter value as true from the Value drop-down list.

    5. Click Try it out!.

  • Using CLI

    1. Log into the DCNM server using SSH.

    2. Set the alarm.enable.external property to true in the server.properties file.

      The filepath is /usr/local/cisco/dcm/fm/config/server.properties.

Health Monitor Alarms

Starting from Cisco DCNM Release 11.4(1), alarms are registered and created under the External alarm category by the Health Monitor.

Health Monitor: Alarm Policy

The Health Monitor external alarm category policy is automatically activated and enabled on all the devices in a fabric. The severity level of this alarm policy can be MINOR, MAJOR, or CRITICAL.

Alarms are raised and categorized as CRITICAL for the following events:

  • Elasticsearch (ES) Cluster Status is Red: Critical (For Cluster/HA mode only)

  • CPU/Memory/Disk Utilization/ES JVM Heap Used Percentage >= 90%

Alarms are raised and categorized as MAJOR for the following events:

  • ES Cluster Status is Yellow (For Cluster/HA mode only)

  • ES has unassigned shards (For Cluster/HA mode only)

  • CPU/Memory/Disk Utilization/ES JVM Heap Used Percentage >= 80% and <90%

Alarms are raised and categorized as MINOR for the following events:

  • CPU/Memory/Disk Utilization/ES JVM Heap Used Percentage >= 65% and <80%

  • Kafka: Number of partitions without active leader > 0

  • Kafka: Qualified partition leader not found. Unclear leaders > 0

Choose Monitor>Alarms>Policies to display the Health Monitor alarm policies. These alarm policies are not editable on the web UI. Click Activate or Deactivate to activate or deactivate the selected policy.

In case an alarm policy is deactivated using the GUI, any alarms created or cleared for that policy will not be displayed in the Monitor>Alarms>View tab. To delete a policy, select the checkbox next to the policy and click Delete. However, we recommend not deleting a policy from the GUI. When a fabric is deleted, the alarm policy along with all the active alarms for the devices in that fabric are deleted.

Health Monitor: Active Alarms

Choose Monitor>Alarms>View to display the active alarms.

To clear active alarms, select the checkbox next to the alarm, click Change Status and select Clear.

To delete active alarms, select the checkbox next to the alarm and click Delete.

Health Monitor: Cleared Alarms

To view the cleared alarms, select Monitor>Alarms>View>Cleared Alarms.

Click the arrow icon to display detailed information about the required alarm.

To delete a cleared alarm from the list of cleared alarms, select the checkbox next to the alarm and click Delete.

For more information on Alarms and Policies, refer Alarms.