Dashboard

This chapter contains the following topics:

Summary Dashboard

The intent of the Summary dashboard is to enable network and storage administrators to focus on particular areas of concern around the health and performance of data center switching. This information is provided as 24-hour snapshots. The functional view of LAN and SAN switching consists of nine dynamic dashlets that display information in the context of the selected scope by default. The scope can be adjusted in the upper right corner of the window to display focused information that is particular to the managed domain. It offers details of a specific topology or set of topologies that is a part of the data center scope.

The various scopes that are available on the Cisco Data Center Network Manager (DCNM) web interface are:

  • Data Center

  • Default_SAN

  • Default_LAN

  • Each SAN Fabric

  • Custom scopes that you create

From the left menu bar, choose Dashboard > Summary. The Summary window displays the default dashlets.

The following are the default dashlets that appear in the Summary window:

  • Health

  • Events

  • Alarms

  • Top ISLs/Port Channels

  • Top SAN End Ports

  • SAN Insights

  • Errors

  • Discards

  • Inventory – Port Capacity

From the Dashlets drop-down list, you can choose more dashlets so that they are added to the Summary dashboard.

The panels can be added, removed, and dragged around to reorder.

Dashlets

By default, a subset of the available dashlets is automatically displayed in the dashboard. To add a dashlet that is not automatically displayed in a dashboard, from the Cisco DCNM Web UI, perform the following steps:

Procedure


Step 1

Choose Dashboard > Summary.

Step 2

From the Dashlets drop-down list, choose the dashlet that you want to add in the dashboard.

In the Dashlets drop-down list, an icon appears before the selected dashlet.

The following table lists the dashlets that you can add on the Summary Dashboard window.

Dashlet

Description

Events

Displays events with Critical, Error, and Warning severity. In this dashlet, click the Show Acknowledged Events link to go to the Monitor > Switch > Events.

Alarms

Displays alarms with Critical, Major, Minor, and Warning severity. In this dashlet, click the Show Acknowledged Alarms link to go to the Monitor > Alarms > View window. Hover the mouse cursor over the blue i icon for more information about a specific alarm. Click ACK to acknowledge a specific alarm.

Link Traffic

Displays a diagram of Inter-Switch Link (ISL) and saturation link for transmitting and receiving in the data center.

Data Center

Displays the number of access, spine and leaf devices, and a generic health score for each switch group in the current scope. Devices are aggregated by type within a switch group.

Audit Log

Displays the accounting log table of Cisco DCNM.

Network Map

Displays the populated switch groups that are visible in your Role Based Access Control (RBAC) scope on a world map. If you use the scope selector, it limits the set of switch groups displayed. If you click detach option, the map opens in a new tab and can be configured.

  • The network map dialog box has properties that are different from the Summary dashboard view:

  • You can click and drag nodes to move them around the map. The map saves their new positions.

  • You can double click a node to trigger a slider that contains the summary inventory information pertaining to a specific switch group.

  • You can upload an image of your choice as the background to the network map.

Note 

You will be prompted to upload an image file with recommended dimension, which is the current window size. Reset returns the network map to its default state, resetting the position of the nodes and clearing the custom image.

Server Status

Displays the status of DCNM and federation servers, and the health check status for the components.

The following services, server, and status details are displayed under the DCNM tab.

  • Database Server

  • Search Indexer

  • Performance Collector

  • NTPD Server

  • DHCP Server

  • SNMP Traps

  • Syslog Server

The following component status and details are displayed under the Health Check tab.

  • AMQP Server

  • DHCP Server

  • TFTP Server

  • EPLS

  • EPLC

Top ISLs/Trunks

Displays the performance data for the top ten performing ISLs, trunk ports or both. Each entry shows the current average receive and transmit percentage, with a graph depicting the percentage of time each trunk spent exceeding the currently configured thresholds.

Top SAN End Ports (SAN only)

Displays the performance data for the top ten performing SAN host and storage ports. Each entry shows the current receive and transmit percentage, with a graph depicting the percentage of time each trunk spent exceeding the currently configured thresholds.

Note 

This dashlet is only for SAN.

Top CPU

Displays CPU utilization for the discovered switches over the last 24 hours, with a red bar displaying the high watermark for that 24-hour period.

Top Temperature

Displays the module temperature sensor details of switches.

Note 

This dashlet is only for LAN.

Health

Displays the health summary that contains two columns displaying the summary of problems and summary of events for the past 24 hours.

Click the count adjacent to the warnings pertaining to switches, ISLs, hosts, or storage (other than 0) to view the corresponding inventory for that fabric.

Click the count adjacent to the event severity levels (Emergency, Alert, Critical, Error, Warning, Notice, Info, or Debug) to view a summary of the corresponding events and descriptions.

From Release 11.4(1), if you have deployed Cisco DCNM in HA mode, the Health Dashlet displays the status of the HA setup. Along with the HA State, it also displays the IP Addresses for the Active, Standby HA nodes and VIP.

Errors

Displays the error packets for the selected interface. This information is retrieved from the Errors > In-Peak and Errors > Out-Peak columns of the Monitor > LAN / Ethernet page.

Discards

Displays the error packets that are discarded for the selected interface.

Note 

The Discards dashlet is only for LAN.

Inventory (Ports)

Displays the ports inventory summary information.

Inventory (Modules)

Displays the switches on which the modules are discovered, the models name and the count.

Inventory (ISLs)

Displays the ISLs inventory summary information, such as the category and count of ISLs.

Inventory (Logical)

Displays the logical inventory summary information, such as the category and count of logical links.

Inventory (Switches)

Displays the switches inventory summary information such as the switch models and the corresponding count.

Inventory (Port Capacity)

Displays the port capacity inventory summary information such as the tiers, the number and percentage of the available ports, and the remaining days.

SAN Insights Flows (SAN only)

Displays donuts depicting the following:

  • Flow summary for Initiator-Target (IT) Pairs and Initiator-Target- LUN(ITL Flows) when the SCSI protocol is selected from the protocol dropdown list.

  • Flow summary for Initiator-Target (IT) Pairs and Initiator-Target-Namespace (ITN Flows) when the NVMe protocol is selected from the protocol dropdown list.

    You can display data for Read Completion Time or Write Completion Time by selecting the required option from the dropdown list. Hover over the sections on the donuts to display deviation percentage values. The percentage values can be configured as per your requirement by modifying the san.telemetry.deviation.low/med/high, san.telemetry.nvme.deviation.low/med/high and san.telemetry.default.protocol server properties.

    The data-points are computed based on the last available 15 minutes of data in the Elasticsearch database. The Last Record Time is displayed in red if the data in the elasticsearch is older than 15 minutes for the selected Scope.

    For more information on SAN Insights, refer Introduction to SAN Insights.

    Note 

    This dashlet is only for SAN.

Top FICON Host Ports

Displays data for top 10 performing FICON Channel (CH) Ports. Each entry shows port traffic of switch interface, specifies the device to which the FICON port is connected, specifies the average of Rx traffic and Tx traffic, and exceeded percentage value.

Top FICON Control Unit Ports

Displays data for top 10 performing FICON Control Unit (CU) Ports. Each entry shows port traffic of switch interface, specifies the device to which the FICON port is connected, specifies the average of Rx traffic and Tx traffic, and exceeded percentage value.

Top FCIP ISL

Displays data for top 10 performing FCIP ISLs. Each entry shows device name, specifies the average of Rx traffic and Tx traffic, and exceeded percentage value.

Note 

To restore the default dashlets in the dashboard page, click the Default Set link in the Dashlet drop-down list.


Storage Dashboard

The Storage dashboard provides information about the SAN and LAN storage.

To access the Storage dashboard, from the left menu bar, choose Dashboard > Storage.

Viewing Storage Enclosures Information

After a datasource is configured and the discovery is completed, the discovered storage systems are displayed under the Name column in the Storage Enclosures area. In this area, you can view details of SAN Storage Enclosures, Storage Systems, or both.

To view the storage enclosures information from the Cisco DCNM Web UI, perform the following steps:

Procedure


Step 1

Choose Dashboard > Storage.

Step 2

From the Show drop-down list, choose SAN Storage Enclosures.

Step 3

Choose the storage name to view more details.

The events, topology, and traffic information are displayed in the dashboard.

Step 4

To edit enclosure name, choose the storage name and click Rename icon. Enter a new name in the Rename Enclosure dialog box.

  • You can rename each enclosure name to a different name. Choose the enclosure name, enter a new name, click Save. Repeat this procedure to change required all the required enclosure names, and click Apply.

  • You can rename all enclosure names to the same new name. Check Include All Members checkbox, enter a new name, and click Apply.

Step 5

Click the Filter icon to filter the storage enclosures by Name or by IP Address.

Step 6

In the Traffic pane, the Enclosure Traffic is displayed by default. Click the Traffic Utilization icon to view the traffic utilization. The daily average percentage of traffic utilization of the enclosure ports is displayed as a pie chart.

Clicking on an individual port slice of the pie chart displays specific traffic utilization details for that port.


Viewing Storage Systems Information

To view information about storage systems from the Cisco DCNM Web UI, perform the following steps:
Procedure

Step 1

Choose Dashboard > Storage.

Step 2

From the Show drop-down list, choose Storage Systems.

Note 
  • The datasource must be configured and discovered at least once to display the discovered storage system(s).

  • Cisco DCNM now differentiate Block Storage and Filer Storage in terms of what it discovers and displays. Filer storage has additional elements: Shares, Quotas, and Q-trees.

    • Shares: Individual storage folders on the file server to which users have access.

    • Quotas: File and repository size limitations.

    • Q-trees: Tree based quotas. By using Q-trees, you can partition data and take advantage of different backup strategies, security styles, and settings.

Step 3

Click the Click to see more details... icon to view the storage systems summary.

The following are the elements of the Storage Systems area:


Components

Components are containers for a set or subset of the disks in a storage system. The Component elements view displays a table of disks in the collection, total number of disks managed. It also displays a summary of the collection’s used vs. raw space.

Procedure

Step 1

Use the Storage System drop-down to select the storage system.

Step 2

The right pane displays a summary of the storage components. Click each name to go to the item in the left menu.

Step 3

Hover the mouse cursor on the graph to display its details.

Step 4

In the left pane, select the storage component to view its details.

The number of disks that are managed along with its details are displayed.

Step 5

Click a Serial Number to display the disk and the mapped LUNs details.

Step 6

You can use the search box to search for a specific component.


Pools

Pools are user-defined collections of LUNs displaying the pool storage. The pools elements view displays a summary of the pools, lists the LUNs in the pool, and also displays the total managed and raw space.

Procedure

Step 1

Use the Storage System drop-down to select the storage system.

The bar graph next to each pool indicates the total managed space of that pool.

Step 2

In the left pane, select a pool to display:

  • Status of the pool

  • LUNs in the pool displaying the total raw space and the total managed space.

  • Raid Type

  • Disk Type

  • Details of the LUNs in the pool

Step 3

You can use the search box to search for a specific pool.


LUNs

LUNs refer to a storage volume or a collection of volumes that are abstracted into a single volume. It is a unit of storage which can be pooled for access protection and management. Each LUN in the LUN Element View is displayed along with the mapping from Hosts to LUNs. If the associated Fabric has also been discovered, additional information concerning the end-to-end connection between a host and LUN is also displayed.

You are able to create and delete LUNs, create and delete host and LUN maps, and create zoning for HLMs.

Procedure

Step 1

Use the Storage System drop-down to select the storage system.

Step 2

You can create LUN from Cisco DCNM by choosing Storage > LUNs.

  1. In the middle pane, click Add LUN.

  2. Enter a valid Name for the LUN, and select its Type and Size. The pool which we carve the storage from is indicated.

    Note 

    The Create LUN pop-up window can also be accessed from a Pool’s details page, when the LUN list view is selected.

  3. Click Add.

    A confirmation window displays each step. Once confirmed, the status is updated with the results of each step.

    After LUN creation completes successfully, you can Assign Hosts, or click Close and assign Hosts later from the LUN Details view.

Step 3

Select a LUN in the left navigation pane to view the details.

  • The LUN details along with its status and the number of Associated Hosts.

  • The Host LUN Mapping details along with the Access (Granted) information.

If the associated fabric has also been discovered, additional information about the switch interfaces and zoning concerning the end-to-end connection between the Host and LUN is also displayed.

Note 
All fabrics that are discovered must be licensed or the fabric correlation will be disabled in the Cisco DCNM. When the feature is disabled, all correlation fields display “Unlicensed Fabric.”
Step 4

You can delete LUNs in the SMI-S Storage Enclosure.

  1. Navigate to Storage > Storage System > LUNs.

    A list of LUNs in the SMI-S Storage Enclosure is displayed in the right.

  2. Select one LUN from the list and then click Remove.

    A confirmation window is displayed at each step. Once confirmed, the status will update with the results of each step.

  3. Click Apply.

Step 5

You can add mapping from Host to LUN.

  1. Select the LUNs from a pane on the left.

    A list of LUNs in the SMI-S Storage Enclosure is displayed in the right.

  2. Select a LUN from the list underneath.

    The details for the selected LUN are displayed, including the current Host LUN Mappings for that LUN.

  3. Click the Add button.

    The Add Hosts to Mask window pops out.

  4. Select one or more Hosts, and then click Add. The Hosts are then added to the LUN Mapping. In addition, each HLM pair is zoned if it is not already zoned.

    Note 

    Host LUN Mappings can also be added through the Host Dashboard. See Viewing Host Enclosures, for more information.

Step 6

You can remove mapping from Host to LUN.

  1. Select the LUNs from the pane on the left.

    A list of LUNs in the SMI-S Storage Enclosure is displayed in the right.

  2. Select a LUN from the list underneath.

    The details for the selected LUN are displayed, including the current Host LUN Mappings for that LUN.

  3. Select one or more existing Host LUN Mappings and click the remove icon.

    A confirmation window appears and displays each step.

  4. Click Apply.

    The status will update with the results of each step.

Step 7

(Optional) You can add Zoning to the LUNs.

  1. Select the LUNs from the left pane.

    A list of LUNs in the SMI-S Storage Enclosure is displayed in the right.

  2. Select a LUN from the list underneath.

    The details for the selected LUN are displayed, including the current Host LUN Mappings for that LUN. One of the columns of the Host LUN Mapping table identifies the existing zones if any of the HLM currently has for zoning.

  3. Select one or more HLMs which have Unknown or None for zoning, and click Add Zoning.

  4. Click Apply.

    The status will update with the results of each step.


Filer Volumes

Filer Volumes are applicable only for NetApp. The Filer Volume Element view displays the Status, Containing Aggregate along with the total capacity and used space.

To view filer volumes from the Cisco DCNM Web UI, perform the following steps:

Procedure

Step 1

Use the Storage System drop-down to select the storage system.

Step 2

In the left pane, select the filer to display:

  • The status of the filer along with the containing aggregate name.

  • Hover the mouse cursor over the graph to view the total capacity and available storage of the filer.

Step 3

You can use the search box to search for a specific Filer.


Hosts

The Hosts describe the NWWNs associated with a host or host enclosure along with the associated Host-LUN Mapping and the Host Ports. If the associated Fabric has also been discovered, additional information concerning the connection between a host and LUN is also displayed.

To configure hosts from the Cisco DCNM Web UI, perform the following steps:

Procedure

Step 1

Use the Storage System drop-down to select the storage system.

Step 2

In the left pane, select a Host to display:

  • The NWWN (Node WWN) is the WWN of the device that is connected to the switch.

  • The Host Ports along with the Host LUN Mapping.

  • In the Host Ports section, click a Host Enclosure Name to view its Events, Topology, and SAN Traffic. For more information, see the Storage section.

  • In the Host Ports sections, click a Host Interface to view the Switch Dashboard.

  • In the Host-LUN Mapping section, click a Storage Interface to view the Switch Dashboard.

  • In the Host-LUN Mapping section, click a Storage Name to view its Events, Topology, and SAN Traffic. For more information, see the Storage section.

If the associated Fabric has also been discovered, additional information about the switch interfaces and zoning concerning the connection between the Host and LUN is also displayed.

Note 
All fabrics that are discovered must be licensed or the fabric correlation is disabled in the Web UI. When the feature is disabled, all correlation fields display “Unlicensed Fabric”.
Step 3

You can use the search box to search for a specific host.


Storage Processors

Storage processors are elements on a storage system, which enable some of its features. A storage processor includes the collection of storage ports it manages. In the Storage Processor Element View, the list of Storage Ports that are associated with a Storage Processor is displayed.

Procedure

Step 1

Use the Storage System drop-down to select the storage system.

Step 2

In the left pane, select a storage processor to display:

  • The status, adapter details, and the number of ports of the storage processor.

  • The storage ports details.

Step 3

You can use the search box to search for a specific storage processor.


Storage Ports

A storage port is a single port on the Storage System. It displays the summary information of each port selected.

Procedure

Step 1

Use the Storage System drop-down to select the storage system.

Step 2

In the left pane, select a storage port to display its details.

Step 3

You can use the search box to search for a specific storage port.


Viewing Storage Enclosure Events

To view the storage enclosure events information from the Cisco DCNM Web UI, perform the following steps:

Procedure


Step 1

Choose Dashboard > Storage. Use the drop-down to select All, SAN Storage Enclosures or Storage Systems.

The list of storage enclosures is displayed in a table.

Step 2

Click the Events icon next to the storage enclosure to view the Events panel.

Step 3

You can use the slider control to resize the panel.


Viewing Storage Enclosure Topology

To view the storage enclosure topology information from the Cisco DCNM Web UI, perform the following steps:

Procedure


Step 1

Choose Dashboard > Storage. Use the drop-down to select All, SAN Storage Enclosures, or Storage Systems.

The list of storage enclosures in a table is displayed.

Step 2

Select the row to view the topology details.

Step 3

Use the mouse scroll wheel to zoom-in and zoom-out.

Step 4

Click the Fabric/Network icon to view the Fabric or Network path.

Step 5

Click the All Paths icon to view the complete setup.

Step 6

Click the First Shortest Path icon to view the shortest path.

Note 
Click Map View icon to enable the icons that are listed in the preceding Step 4, 5 and 6.
Step 7

Click the Tabular View icon to view the host topology in tabular format.


Viewing Storage Enclosure Traffic

To view the storage enclosure traffic from the Cisco DCNM Web UI, perform the following steps:

Procedure


Step 1

Choose Dashboard > Storage. Use the drop-down to select All, SAN Storage Enclosures or Storage Systems.

The list of storage enclosures is displayed in the table.

Step 2

Select the row to view the topology details.

Step 3

Use the drop-down to select the traffic according to the time duration.

Step 4

Select the icons to view the traffic as a Grid, Line Chart or Stacked Chart.

Step 5

Click the Show Events icon to view the events.

Step 6

Use the options at the bottom of the screen to view a pie chart or a line chart. Click on each name on the chart to view its details.


Introduction to SAN Insights

The SAN Insights feature enables you to configure, monitor, and view the flow analytics in fabrics. Cisco DCNM enables you to visualize the health-related indicators in the interface so that you can quickly identify issues in fabrics. Also, the health indicators enable you to understand the problems in fabrics. The SAN Insights feature also provides more comprehensive end-to-end flow-based data from the host to LUN.

From Release 11.2(1), Cisco DCNM supports SAN Telemetry Streaming (STS) using compact GPB transport, for better telemetry performance and to improve the overall scalability of SAN Insights.

For SAN insights streaming stability and performance, refer to System Requirements section in the Cisco DCNM Installation Guide for SAN Deployment Guide and the section Increasing Elasticsearch Database Heap Size of the Cisco DCNM SAN Management for OVA and ISO Deployments Configuration Guide. Ensure system RAM is of adequate size. Use of NTP is recommended to maintain time synchronization between the DCNM and the switches. Enable PM collection for viewing counter statistics.

SAN Insights Dashboard

Cisco DCNM visually displays fabric-level information in a holistic view from end-to-end. To view the SAN Insights Dashboard, choose Dashboard > SAN Insights. The SAN Insights Dashboard provides visibility for overall read/write IO operations/latency.

In the SAN Insights dashboard page, you can select protocol, fabric, and switches from protocol, fabric, and switches drop-down lists. The dashlets display insight data based on protocol, fabric, and switches that you select.

The dashboard displays the data over the last 72 hours. However, the Flow Summary and the Enclosure Summary donuts display the last 15 minutes from the latest updated time.

Dashboard > SAN Insights

From Release 11.3(1), Cisco DCNM allows you to view SAN Insights metrics based on two protocols, SCSI and NVMe. By default, the SCSI protocol is selected. However, you can change this setting from the Administration > DCNM Server > Server Properties. Ensure that you restart the SAN Insights service to use the new properties. (Restart the SanInsight service on Linux or Pause/Resume Post Processor App on SAN-OVA/ISO/SE deployments)

From the Fabric drop-down list, select the SAN Fabric for which you need to see the SAN Insights data and metrics. The switches that are capable and licensed for SAN Analytics are displayed in the drop-down list.


Note

Click on the title on top of the donuts, to navigate to the relevant page on Monitor > SAN > SAN Insights. You can also click on different colored sections on the donuts to see more detailed counts in percentages.


The total distinct ITL count and the ITN count from the trained baseline is displayed in the top right-hand corner of the Dashboard. The donuts show the active ITL/ITN count only, for the last 15 minutes. The total ITL and ITN count, however, shows the count of all the ITLs and ITN for the scope selected.

The SAN Insights dashboard contains the following dashlets.

  • Flow Summary (ECT)

    From the drop-down list, select Read Completion Time or Write Completion Time, based on which the donuts show IT Pairs and ITL Flows. These data-points are computed based on the last available 15mins data in the Elasticsearch.

  • Enclosure Summary (ECT)

    From the drop-down list, select Read Completion Time or Write Completion Time, based on which the donuts display Storage and Hosts. These data-points are computed based on the last available 15mins data in the Elasticsearch.

  • Throughput

    Displays the Read and Write throughput rate. Hover the mouse on the graph to view the value at that instance. The metrics in these line charts are computed based on the data during the last 72 hours.

  • IOPS

    Displays the Read and Write IOPs trend. The metrics in these line charts are computed based on the data during the last 72 hours.

  • Aborts

    Displays the Read and Write Aborts trend. The metrics in these line charts are computed based on the data during the last 72 hours. This metric is computed based on the read_io_aborts and write_io_aborts metric reported by the Cisco MDS SAN Analytics infrastructure.

    Click on more details to view the custom graphing for READ IO Aborts/Failures for the switch IP address that is selected on the Dashboard page.

  • Failures

    Displays the Read and Write Failures trend. The metrics in these line charts are computed based on the data during the last 72 hours. This metric is computed based on the read_io_failures and write_io_failures metric reported by the Cisco MDS SAN Analytics infrastructure.

    Click on more details to view the custom graphing for READ IO Aborts/Failures for the switch IP address that is selected on the Dashboard page.

  • Top 10 Hosts

    Represents the top 10 Host Enclosures/WWPNs/Device Alias in the selected Protocol/Fabric/Switch scope based on the metric selected in the drop-down list. The data can be sorted by Read/Write IOPS, Throughput, Exchange Completion Time or Data Access Latency.

  • Top 10 Storage

    Represents the top 10 Storage Enclosures/WWPNs/Device Alias in the selected Protocol/Fabric/Switch scope based on the metric selected in the drop-down list. The data can be sorted by Read/Write IOPS, Throughput, Exchange Completion Time or Data Access Latency.


Note

The Top 10 Hosts and Top 10 Storage are computed over the last 72 hours, based on hourly data collected for the selected protocol, Fabric(s), and Switch(es). If you change the enclosure names for specific WWPNs, the names of the old enclosures names are visible until the data ages out after 72Hours.


A warning message appears as HIGH NPU LOAD Detected on top of the Dashboard > SAN Insights window. The warning implies that one or more switches has an unacknowledged Syslog event during the previous week. The event may affect the availability of the analytics data stored or displayed. You must acknowledge these events to remove the warning.

A warning appears as HIGH ITL LOAD Detected on top of the Dashboard > SAN Insights window. The warning is displayed when the number of ITLs seen in the last interval exceeds 20,000.

Ensure that you have configured Syslog on the DCNM Device Manager, to capture NPU and ITL Loads. Choose Inventory > View > Switches. Click on a switch to view System Info. On the Device Manager tab, click on Logs > Syslog > Setup. Click Create. Enter the required parameters. Ensure that you choose the syslog radio button in the Facility area. Click Create to enable Syslog on the DCNM server.

To resolve the high NPU and high ITL loads, click on the HIGH NPU LOAD Detected or HIGH ITL LOAD Detected link. The Monitor > Switch > Events page appears. The list of events is filtered for Type: HIGH_NPU_LOAD and Type: HIGH_ITL_LOAD. Select all the switches and click Acknowledge. This removes the HIGH NPU LOAD Detected and HIGH ITL LOAD Detected warnings.

Viewing SAN Insights Metrics

To view the SAN Insights metrics, choose Dashboard >SAN Insights. The SAN Insights Dashboard page appears. Click the View SAN Insights Metrics button. From the Use Case drop-down list, choose ECT Analysis or Custom Graphing.

The dashboard displays the data over the last 72 hours. However, the Flow Summary and the Enclosure Summary donuts display the last 15 minutes from the latest updated time.


Note

The refresh interval for ECT Analysis and Custom Graphing page is 5 minutes. Click on the Play icon ">" to refresh every 5 minutes automatically.


From Release 11.3(1), Cisco DCNM allows you to view SAN Insights metrics based on two protocols, SCSI and NVMe. By default, the SCSI protocol is selected. However, you can change this setting from the Administration > DCNM Server > Server Properties. Ensure that you restart the SAN Insights service to use the new properties. (Restart the SanInsight service on Linux or Pause/Resume Post Processor App on SAN-OVA/ISO/SE deployments)

ECT Analysis

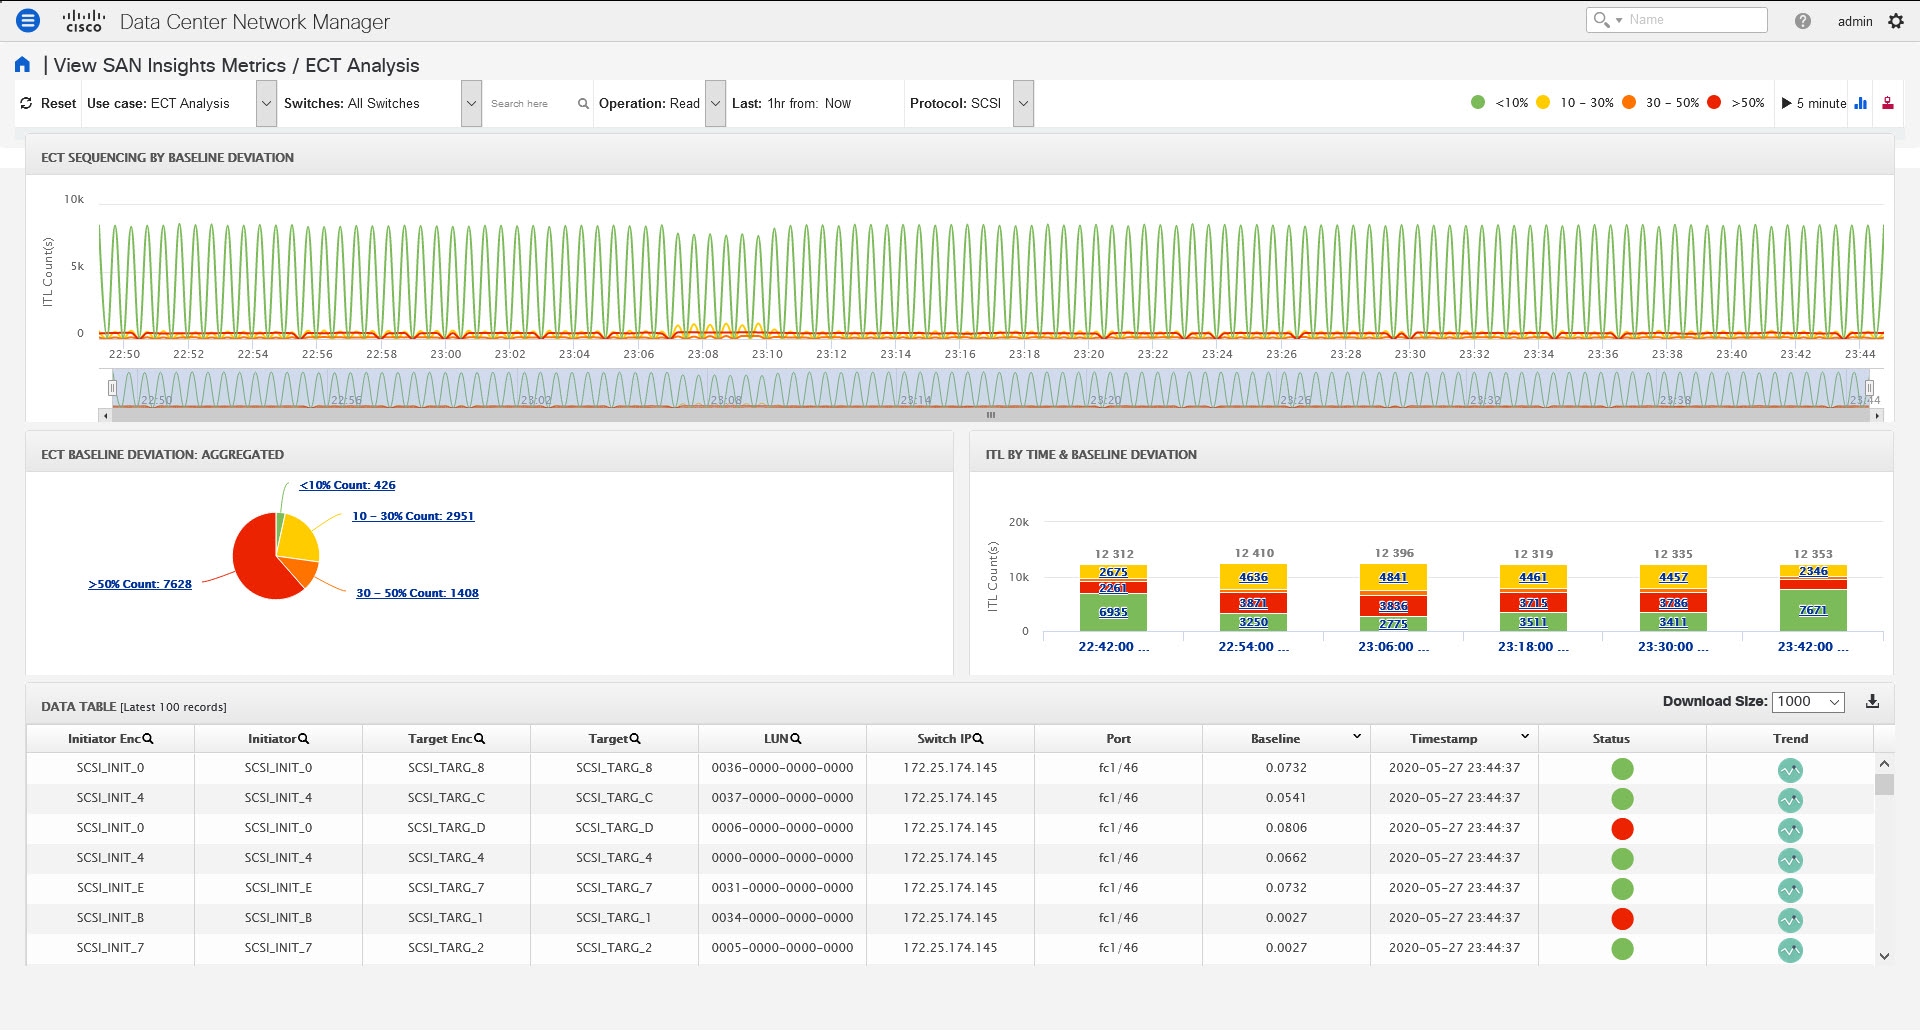
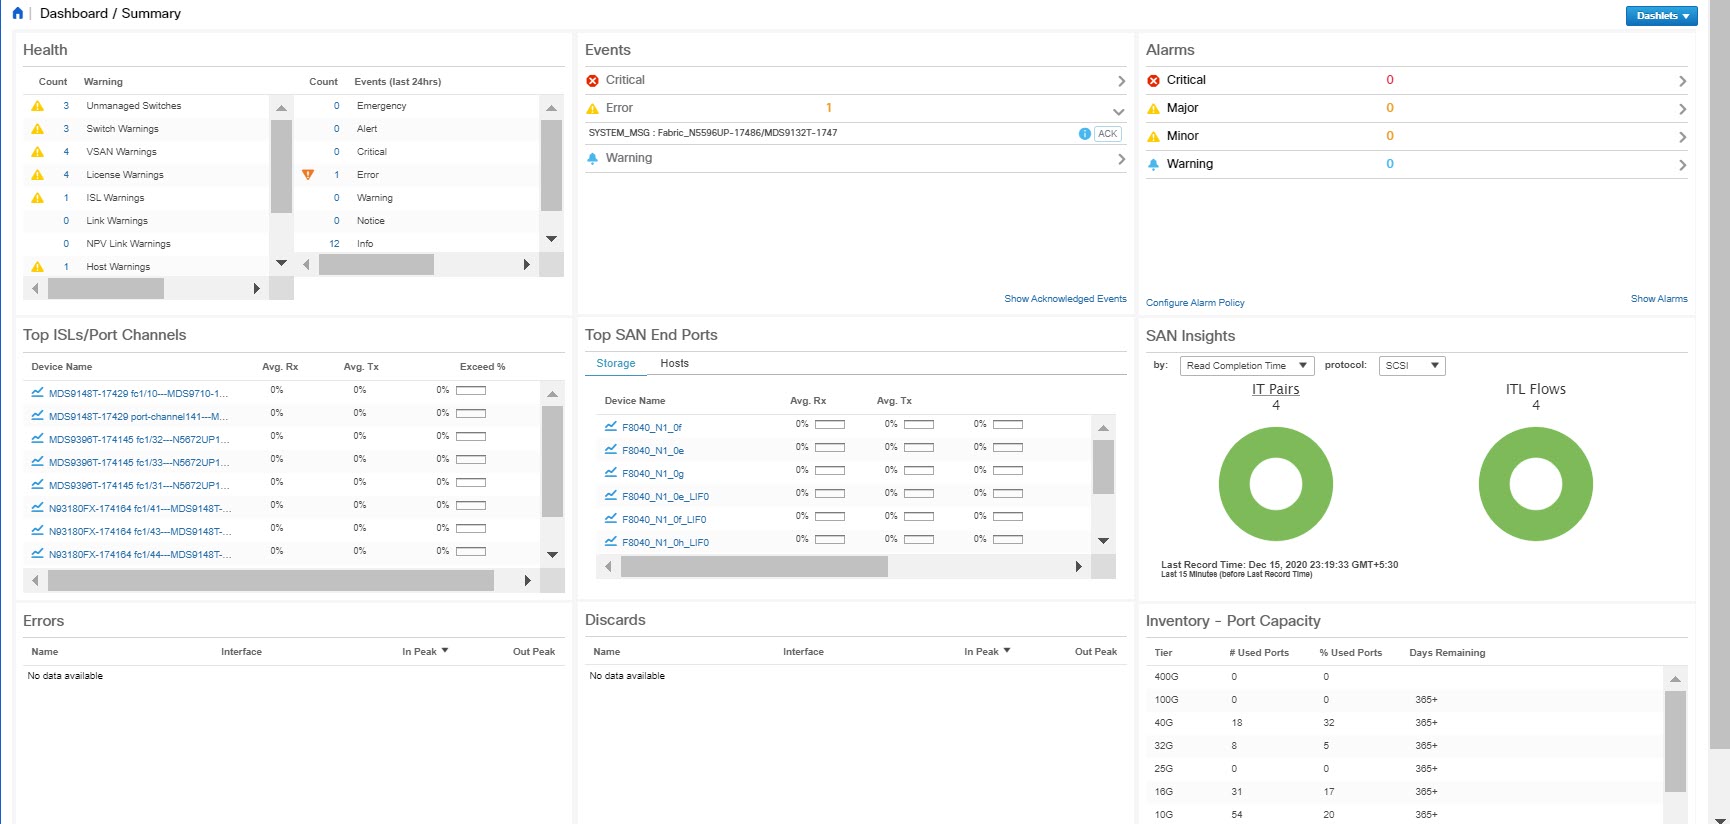
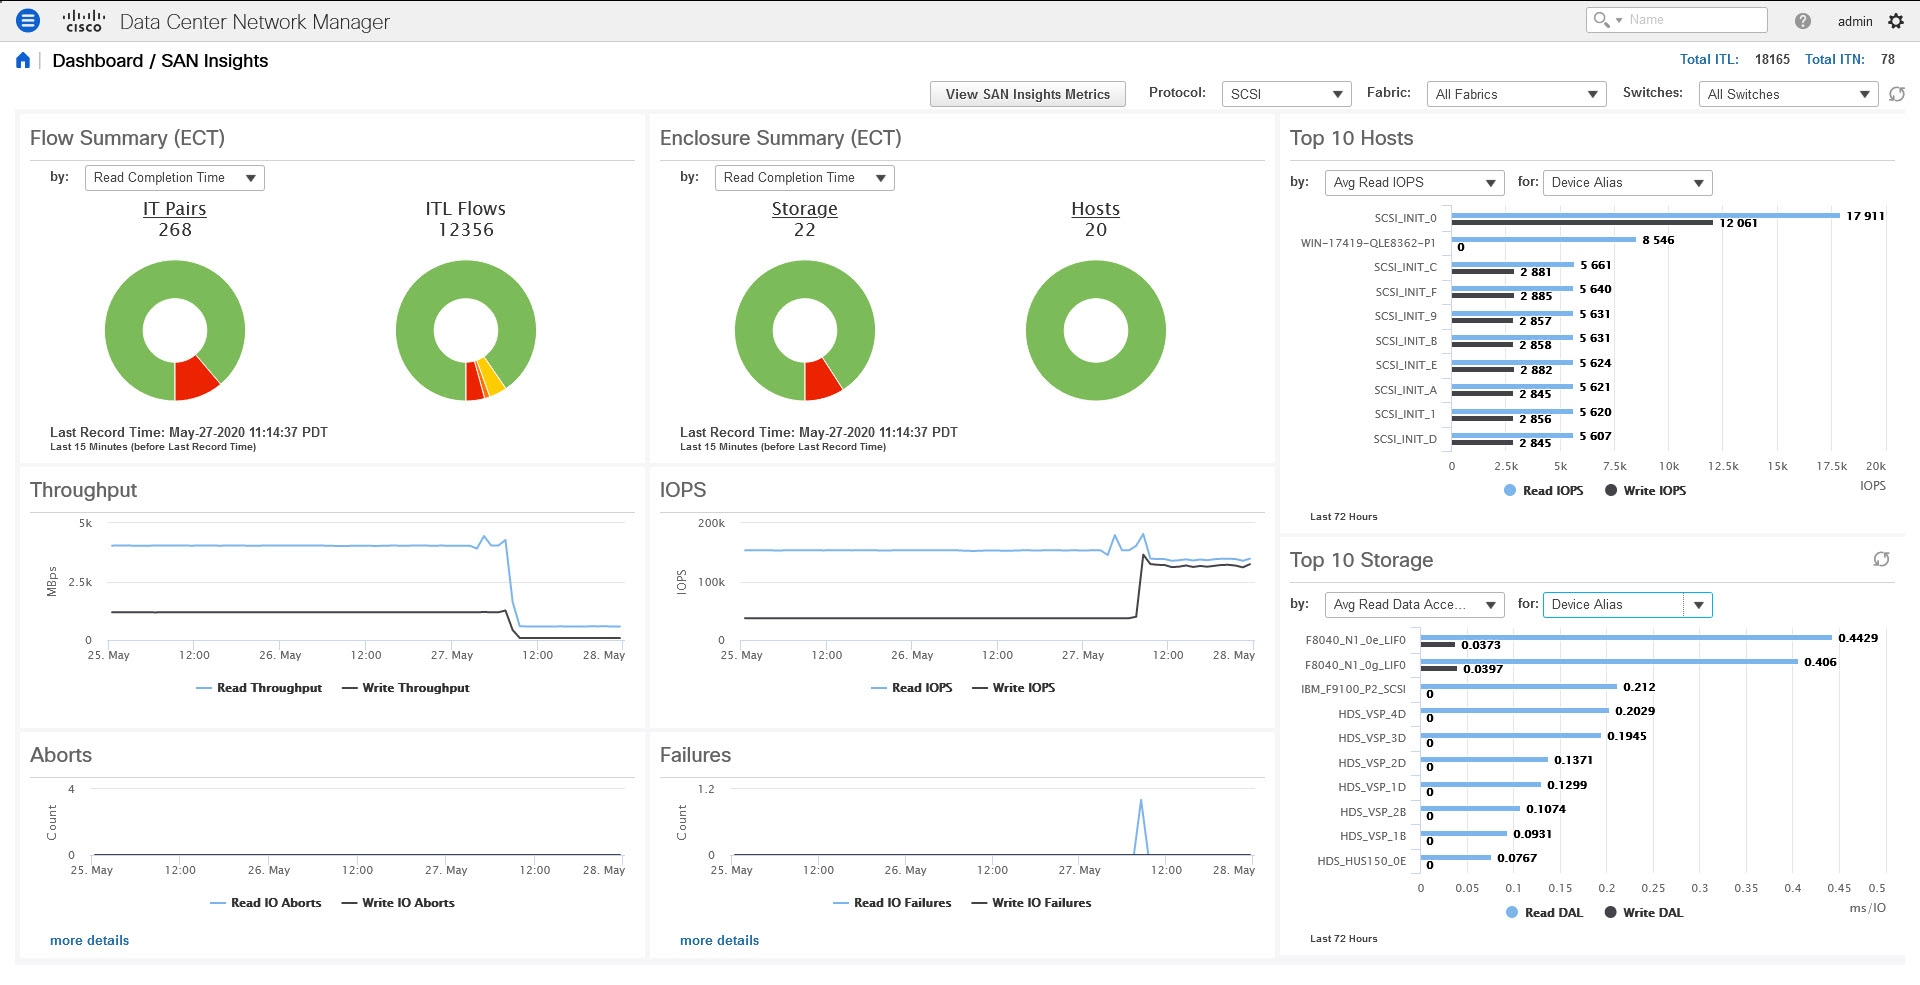
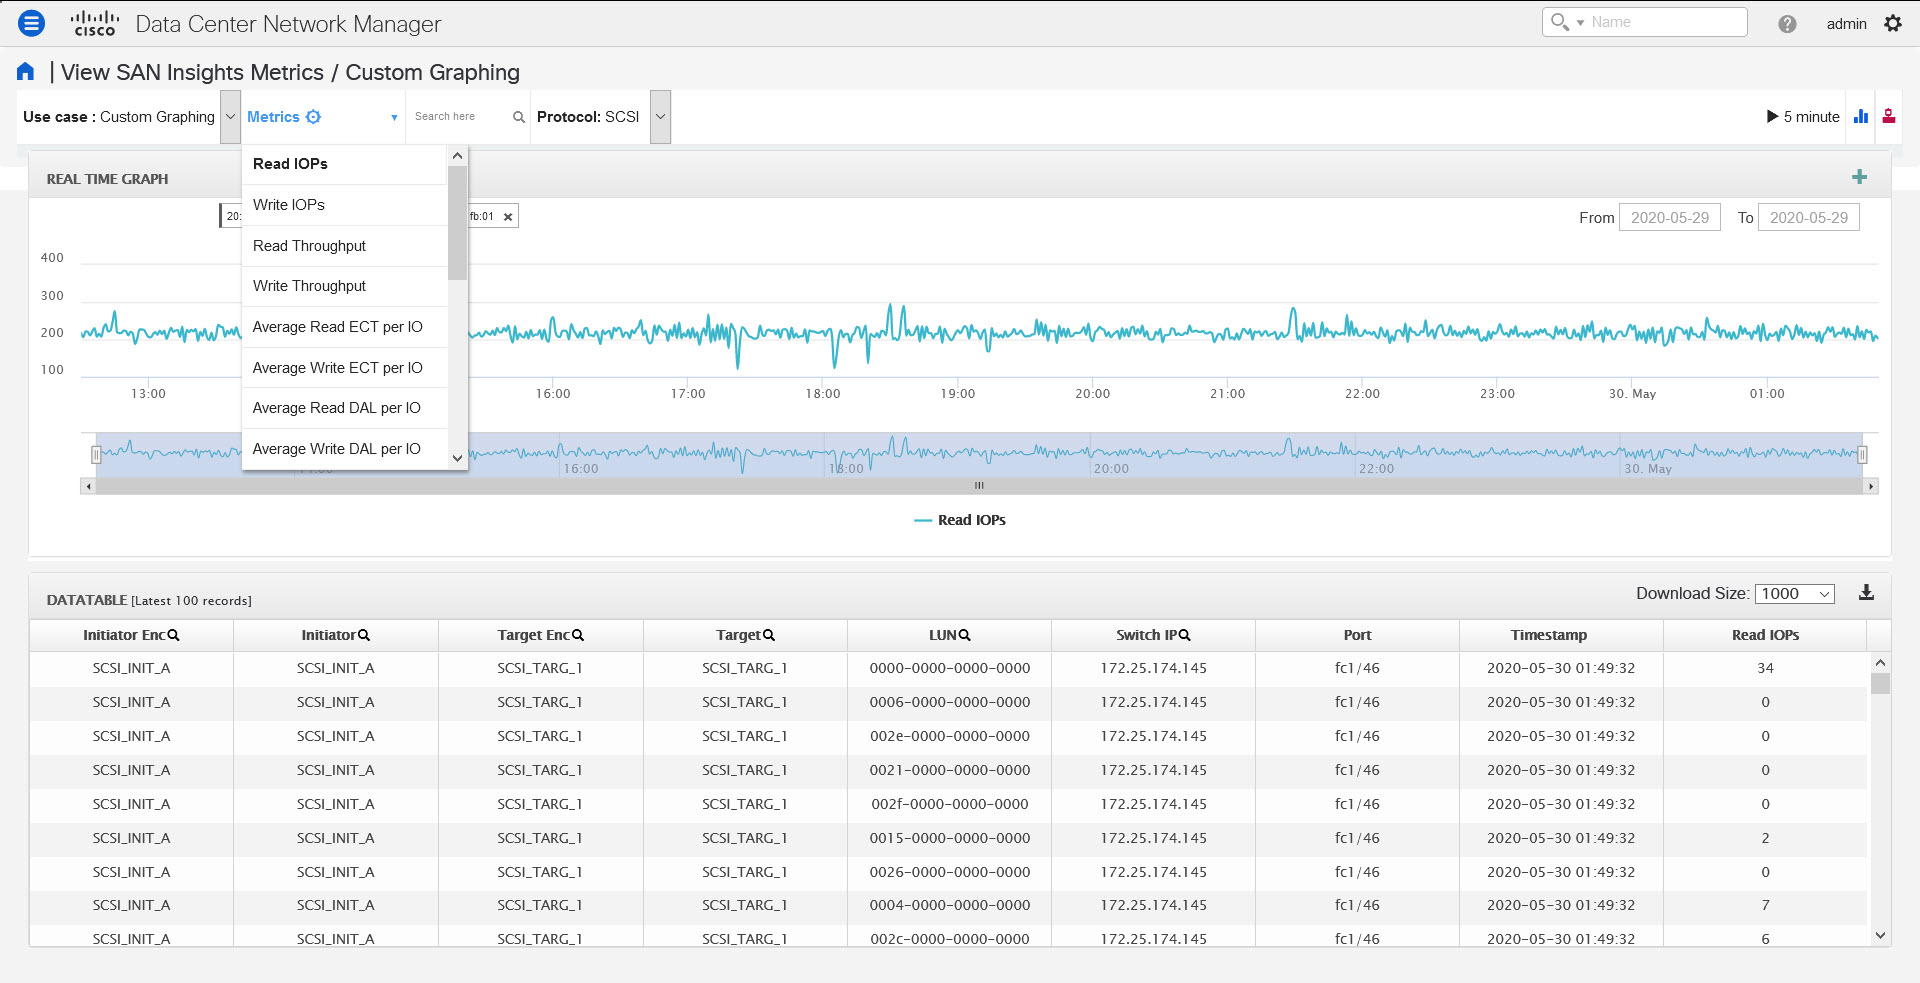
From the Cisco DCNM Web UI > Dashboard > SAN Insights, click on the View SAN Insights Metrics to view the ECT Analysis.

There are four components in ECT Analysis:

  • Data table

  • ECT Sequencing by Baseline Deviation

  • ECT Baseline Deviation Aggregated

  • ITL By Time & Baseline Deviation

From Release 11.3(1), Cisco DCNM allows you to view SAN Insights metrics based on two protocols, SCSI and NVMe. By default, the SCSI protocol is selected. However, you can change this setting from the Administration > DCNM Server > Server Properties. Ensure that you restart the SAN Insights service to use the new properties. (Restart the SanInsight service on Linux or Pause/Resume Post Processor App on SAN-OVA/ISO/SE deployments)

From Release 11.4(1), Cisco DCNM allows you to view data for a time frame of any 14 days within the last 90 days. (up to a default maximum of 90 days). You can modify the san.telemetry.expire.rollup property on the Web UI > Administration > DCNM Server > Server Properties to modify the maximum default days. You can choose the date using the date picker and view the historical data starting from the selected date at hourly granularity.


Note

The default duration of the ECT analysis 30 minutes60 minutes. You can click the Reset button to clear all the applied data filters.


ECT Analysis


Note

The Last filter displays the period of historical data. The default period of the historical data is 30 minutes60 minutes.


When you upgrade from Release 11.1(1) to 11.2(1) or 11.3(1), the old data takes two weeks to age out. The performance of the SAN Insights metrics improves after two weeks, after the upgrade.


Note

The data in the ECT Analysis view can be filtered by selecting the switch from the drop-down list or by specifying the WWPN\Enclosure Name\LUN-ID\Switch-IP in the Search here field. From Release 11.4(1), you can filter it by Device Alias, also.


You can enter the text in the Search here field to search for the value in the ECT Sequencing by Baseline Deviation table.

The Search here field in the filters indicates that you must search for their value.

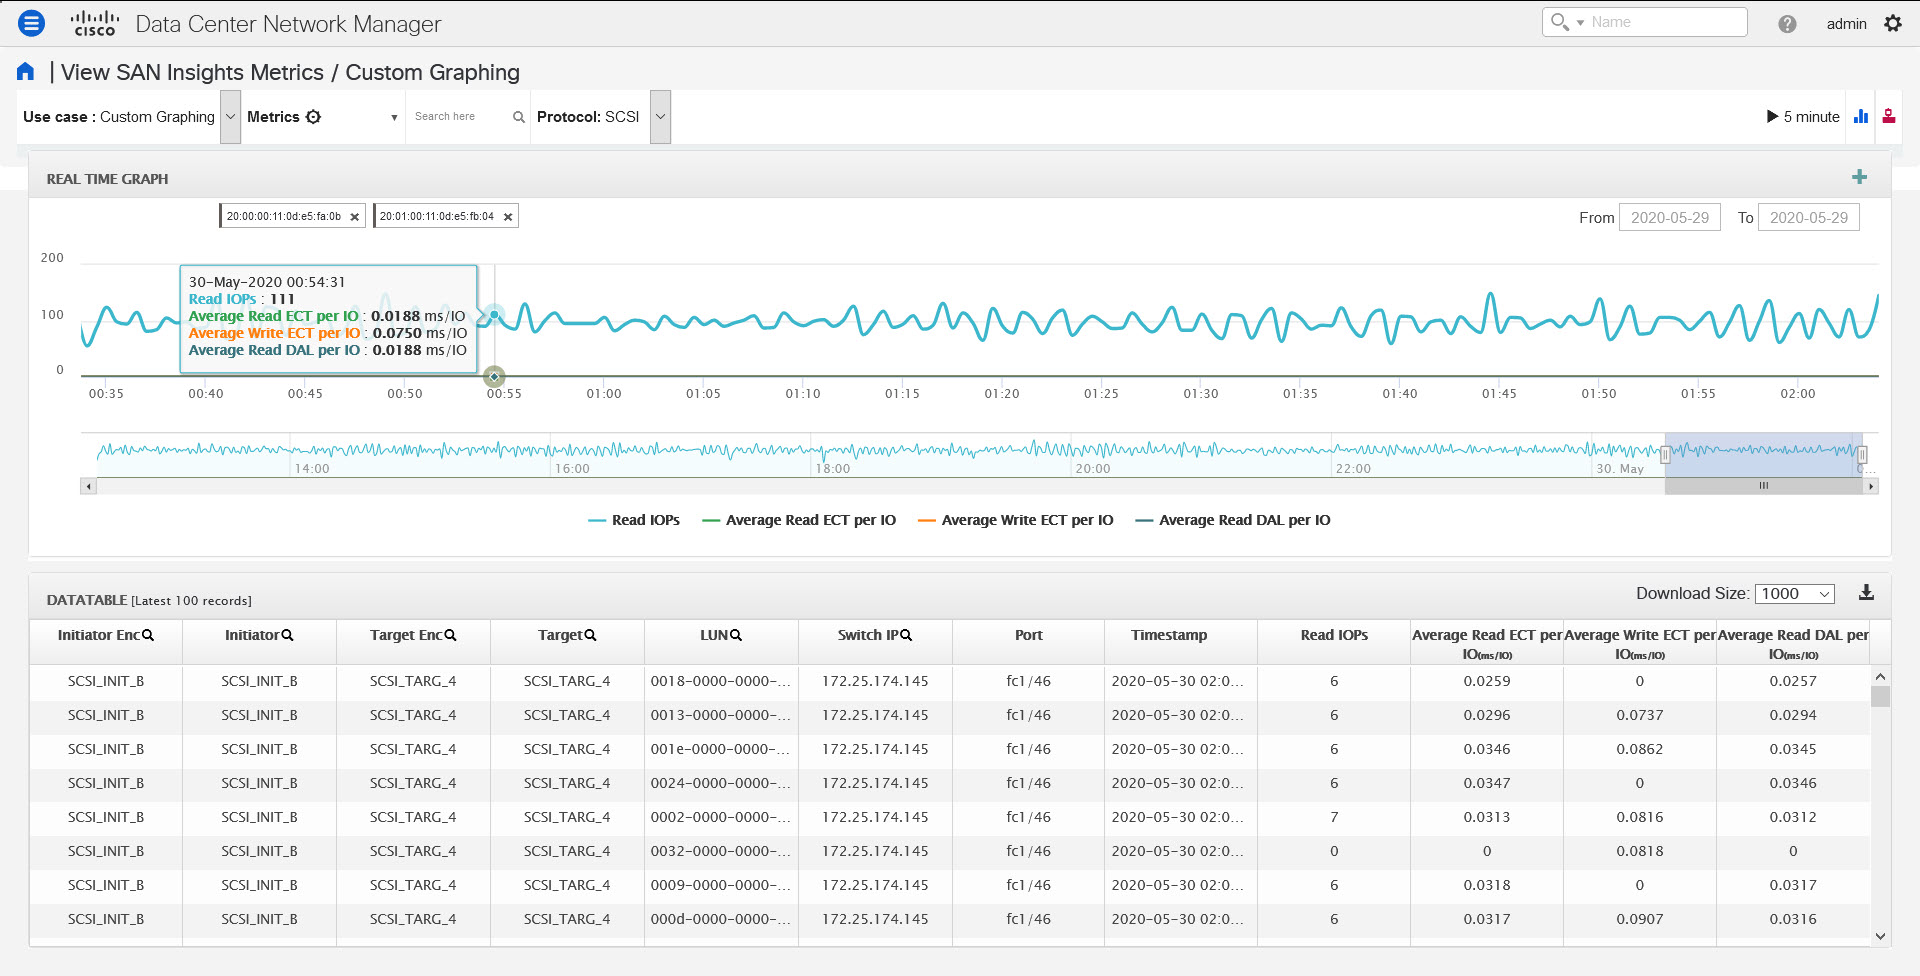
The ECT Analysis page is representing the aggregated behavior of the ITL Flows by comparing the current normalized Exchange Completion Time (ECT) to its historical behavior (ECT Baseline) using the below logic. The normalized ECT value is the amount of time it takes to transfer a KB (kilobyte) of data.

ECT Baseline for each ITL Flow (Reads and Writes) is calculated using weighted average learned continuously over a training period:

  • The ECT Baseline computation consists of two parts: the training period and the recalibration time.

  • The training period for ECT Baseline is seven days by default (configurable).

  • After the training is completed, the ECT Baseline remains the same until the recalibration is triggered after 7 days by default (configurable).

  • By default every 14 days training runs for seven days (cyclic).

  • The percentage (%) deviation shows the deviation of the current normalized ECT compared to the ECT Baseline.


    Note

    Starting 11.4 release, the deviation of the ECT less than the baseline is considered as negative deviation. The Web UI screens are expected to display negative values for the computed deviation percentage.


Beginning from Release 11.4(1), the flows that have ECT lesser than the baseline is identified as having negative deviation. This impacts the average ECT deviation, reducing the severity of momentary spikes. However, it reflects a better true value of ECT performance.

When you upgrade to Release 11.4(1), some pages on the Web UI does not display correct color for older data. After two weeks, the new data will show proper color codes.


Note

  • To configure the default training period, edit the san.telemetry.train.timeframe parameter (default 7) in the Cisco DCNM Administration > Server Properties. Restart the DCNM Server process. (Restart the SanInsight service on Linux or Pause/Resume Post Processor App on SAN-OVA/ISO/SE deployments)

  • To configure the recalibration time, edit the san.telemetry.train.reset parameter (default 14 days) in the Cisco DCNM Administration > Server Properties. Restart the DCNM Server process. Restart the SanInsight service on Linux or Pause/Resume Post Processor App on SAN-OVA/ISO/SE deployments.

  • For example, to train the baseline for four days and recalibrate the baseline 10 days after the training period set the training period to four days and the recalibration time to 14 days.


Table 1. Baseline Color Legends

Relation

Value

If ECT is above 50% from Baseline

Red

If ECT is above and in range 30–50% from Baseline

Orange

If ECT is above and in range 10–30% from Baseline

Yellow

If ECT is below 10% from Baseline

Green (implies Normal)

The range of value for the Baseline Color Legends can be modified on the Server Properties file. See the san.telemetry.deviation definitions in the Administration > DCNM Server > Server Properties. Ensure that you restart the SAN Insights service to use the new properties. Restart the SanInsight service on Linux or Pause/Resume Post Processor App on SAN-OVA/ISO/SE deployments.

You can click on the Trend Identifier () icon to navigate to Trend Identifier. For more information, see Trend Identifier.

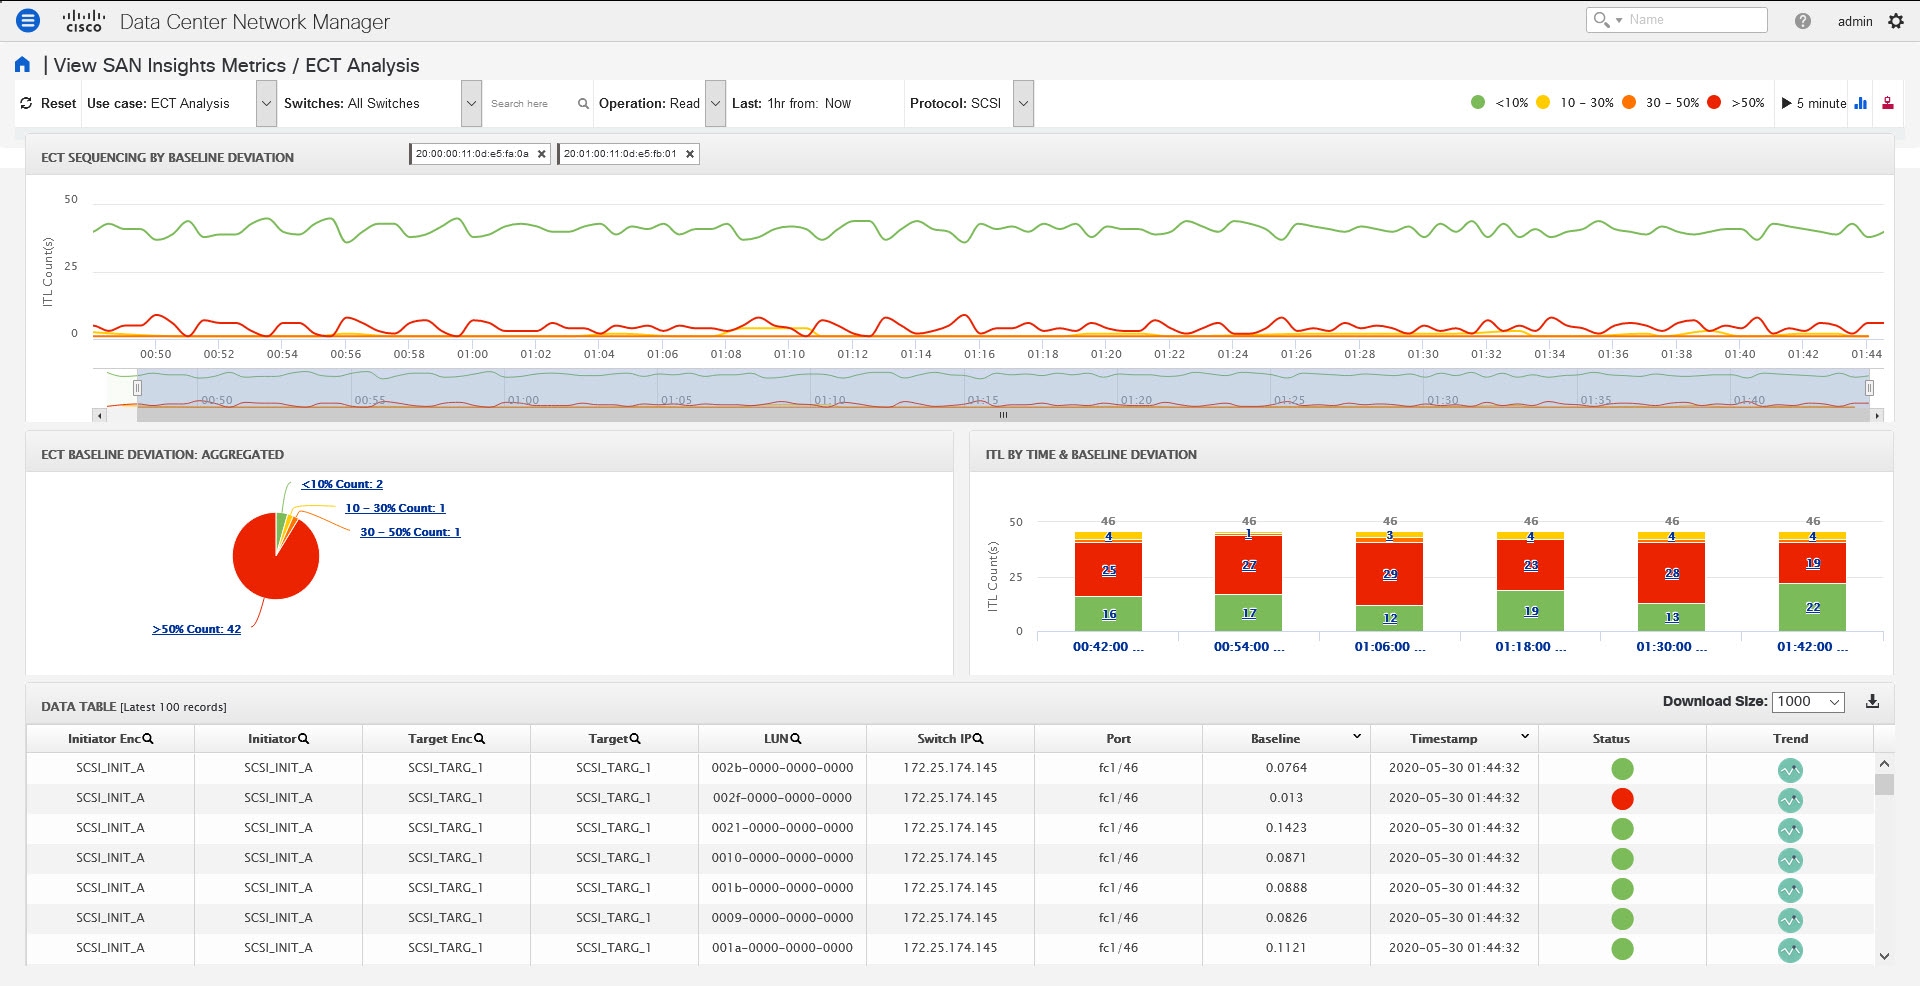
The data in the ECT Analysis UI can be filtered to view data of ITLs corresponding to the above legend, by clicking the circles to disable and enable. For example, on clicking and disabling the Yellow and Orange legend circles, the corresponding data will be displayed.

You can copy and paste the values in the data table into the Search here input field at the top of the UI to filter the data in all components. Values in all the columns marked with Magnifying Glass () icon in the data table are the only fields searchable for this functionality.

The data in the ECT BASELINE DEVIATION AGGREGATED component shows the number of ITLs that are in each deviation range. Similarly, the data in ITL BY TIME component shows the number of ITLs grouped by time that are in each deviation range. Clicking on a section of the pie chart or histogram shows drill down data with Initiator Enclosures, Initiator WWPNs, Target Enclosures, Target WWPNs, and LUN/Namespaces. Click on the corresponding section of the chart to download the results in a .csv format.


Note

The maximum ECT Baseline Deviation aggregated data is set to 20000.


ECT Baseline

Script Timeout Error in Mozilla browser

In the Mozilla browser, if you see script timeout error with option Stop or Wait, don’t click Stop. Perform the following steps to troubleshoot the script timeout error.

  1. Launch the Mozilla Firefox.

  2. On the Firefox address bar type about:config and press Return key.

  3. In the confirmation message, click I accept the risk!.

  4. In the Search field, enter dom.max_script_run_time.

    The Preference names are displayed.

  5. Right click on the dom.max_script_run_time Preference name.

    Select Modify.

  6. Enter an integer value of 0 or 20 for dom.max_script_run_time.

  7. Click OK to confirm.

  8. Restart the Mozilla Firefox browser.

Custom Graphing

This is a freestyle dashboard where multiple metrics can be selected and the real-time data for the selected metrics is shown in multi-line graph which is configured to refresh every 5 minutes and corresponding raw data will be shown in the data table.

From Release 11.3(1), Cisco DCNM allows you to view SAN Insights metrics based on two protocols, SCSI and NVMe. By default, the SCSI protocol is selected. However, you can change this setting from the Administration > DCNM Server > Server Properties. Ensure that you restart the SAN Insights service to use the new properties. (Restart the SanInsight service on Linux or Pause/Resume Post Processor App on SAN-OVA/ISO/SE deployments)


Note

The Auto Refresh option is disabled by default. You must click on the pause icon to enable the Auto Refresh feature.


There are two components in the custom graphing use case.

  • Real Time Graph

  • Datatable

The Real Time Graph is plotted with corresponding metrics with from & to date selected. This component has the slider present below the graph as per your selection. It’s dynamic in nature as the data can be refreshed every 5 minutes, and can be converted into a static graph using the pause button.

Starting 11.4 release, Cisco DCNM allows the user to view data for more than two weeks’ time frame (up to a default maximum of 90 days. You can configure this time frame in the server properties. Select the date in the past using the To: date selector and view up to two weeks historical data from the date selected.

Custom Graphing

In Release 11.4(1), the Custom Graphing metrics is enhanced to include the Write IO Failures, Read IO Failures, Write IO Aborts and Read IO Aborts to the drop-down metrics list.

When you select a failure or abort metric from the drop-down list, the table list is filtered to show only the rows that have at least one of the selected failure or abort metrics as a nonzero entry. The table displays only 100 records. However, to help find their nonzero failures you can filter the table to show the last 100 records with an Abort or Failure that is nonzero. When you select failure or aborts, the table label changes to depict this behavior.

To view, input any of the seven dimensions (Initiator WWN, LUN/NSID, Target WWN, Source enclosure, Target enclosure, Switch IP, Device Alias) in the search tab, and select an associated metric.

Click on the download icon at the right corner to download the datatable information to your local database, for further analysis.


Note

We recommend that you use Google Chrome browser to download the datatable information to your local database.

You can also add multiple graphs for comparison by clicking on the "+" icon at the top right. The data table is replaced by multiple Real Time graphs in this view and you can select the corresponding metric to be plotted by using the multiselect text search feature.

Custom Graphing Multiple graphs

Trend Identifier

Click the Trend Identifier () icon in the top-right corner to navigate to Trend Identifier.

You can also click on the Trend () icon in each row of the data table to navigate to Trend Identifier, with prepopulated ITL/ITN input fields. There are two components showing data corresponding to selected ITL. Trends ITL Metrics shows area chart of ECT, DAL, IOPs, and Baseline ECT in the selected time interval (1 hour selected). Histogram Correlation tab shows the histogram of count of correlated ITLs with current ITL binned by correlation value. Clicking on any bar in this tab converts the histogram into datatable which shows the data corresponding to the selected bar.

From Release 11.3(1), Cisco DCNM allows you to view SAN Insights metrics based on two protocols, SCSI and NVMe. By default, the SCSI protocol is selected. However, you can change this setting from the Administration > DCNM Server > Server Properties. Ensure that you restart the SAN Insights service to use the new properties. (Restart the SanInsight service on Linux or Pause/Resume Post Processor App on SAN-OVA/ISO/SE deployments)


Note

The default interval for the trend identifier is 30 minutes. You can specify the interval using the Start With Last drop-down list.


Outlier Detection

Click the Outlier Detection icon () that appears in the top-right corner of the page, to view the Outlier Detection metrics. To view data on this page, enter either Host-Enclosure or Initiator Enclosure name in the Search here input box, select a Metric, select a time range, and click Submit. This screen takes aggregated data for every 60 minutes.

ITL/ITN Distribution tab shows the scatter plot of metrics selected for all ITL/ITN’s present in the selected time interval (1week in this case). To navigate to the Trend screen, click any of the dots (corresponds to specific ITL/ITN) in the scatter plot. Functionality added two tabs namely ITL/ITN’s Below Confidence interval and ITL/ITN’s above confidence interval. These two tabs are data calculated based on the Average Confidence Interval line.

From Release 11.3(1), Cisco DCNM allows you to view SAN Insights metrics based on two protocols, SCSI and NVMe. By default, the SCSI protocol is selected. However, you can change this setting from the Administration > DCNM Server > Server Properties. Ensure that you restart the SAN Insights service to use the new properties. (Restart the SanInsight service on Linux or Pause/Resume Post Processor App on SAN-OVA/ISO/SE deployments)

You can zoom in to view the respective ITL/ITN dots at a more granular level by dragging the mouse and selecting a specific region to be viewed. Click on Reset Zoom in the zoomed screen to restore default zoom settings.

This use case consists of Multiselect text search feature, where you can search for specific text maximum up to two search criteria that can be present in any field (Initiator/Target Enclosure) and corresponding data is plotted in both the components.

Average Confidence Interval shows a band with an average line where most of the metric value lies in the selected time interval. Remaining two tabs shows Box Plot and Pie chart distribution of Top n (5 selected) Initiator/Target of the selected metric in the selected time interval.

Hosts


Note

During Release 11.3(1) and earlier releases, this feature was called Compute Dashboard. Beginning from Release 11.4(1), it is renamed as Hosts.


The Hosts dashboard provides you with all the information that are related to the discovered SAN and LAN hosts. It provides detailed information that is related to the network, such as I/O traffic, disk latency, CPU, memory statistics, topology, and events about each individual host and virtual machines that are configured on top of the virtual host. The Hosts dashboard consists of four panels:

  • Host Enclosures panel—Lists the hosts and their network attributes.

  • Traffic panel—Provides the I/O statistics, CPU and memory information, and disk latency of individual hosts or virtual machines.

  • Topology panel—Provides an end-to-end topology layout and path information between host enclosures and storage enclosures. The discovered virtual machines are displayed and when you select the virtual machine, the path to the SAN data source is displayed. You can toggle this view to list all data paths.

  • Event panel—Provides information about events of all the switch ports that are configured within a specific host enclosure.

This section contains the following topics:

Viewing Host Enclosures

Beginning with Cisco NX-OS Release 6.x, you can view and search the network servers that are connected to the Cisco NX-OS devices. Cisco DCNM extends the fabric visibility up to the server and allows you to discover and search the end devices that are attached to the network.

The following table describes the fields that appear on this page.

Field

Description

Name

Displays the hostname.

IP Address

Displays the IP address of the switch.

#Macs

Displays the number of MAC addresses.

Mac Address(es)

Displays the MAC addresses.

#WWNs

Displays the number of World Wide Names

(WWNs).

Port WWN(s)

Displays the port WWN.

FCID(s)

Specifies the associated FCID.

OS

Displays the OS details.

#VMs

Displays the number of VMs.

VHost Name

Displays the name of the virtual host.

VCluster

Displays the name of the virtual cluster.

Multipath

Displays the multipath details.

Protocol

Specifies if the Host is streaming SCSI protocol traffic or NVMe protocol traffic.

This column displays data only for the Hosts for which data is streamed to the DCNM using SAN Insights.


Note

  • Beginning with Cisco NX-OS Release 6.x, Server Credentials, Servers, and Static Server-Adapter Mapping are no longer available.

  • Beginning from Cisco DCNM Release 10.1, you are able to assign storage to hosts.

  • Collection level in the vCenter settings determines the amount of data that is gathered and displayed in charts. Level 1 is the default Collection Level for all collection intervals. Change the vCenter statistics settings to Level 2 or higher to collect disk I/O history data.

  • From DCNM Release 11.4(1), you can set the default enclosure names from the Device Alias. Choose Administration > DCNM Server > Server Properties, and edit the fabric.aliasRE property.


To view the host enclosures from the Cisco DCNM Web UI, perform the following steps:

Procedure


Step 1

Choose Dashboard > Hosts.

The list of hosts in the host enclosures table is displayed.

Step 2

Choose a host to view more details.

The events, topology, and traffic information on the dashboard are displayed. You can also click the corresponding icons on a host entry to view the events, topology, and traffic information.

From DCNM Release 11.5(1), traffic icons are added for VHost. It has multiple VM charts such as VHost CPU, and memory, latency, and network I/O. Click the radio button of a host to view respective traffic details in the traffic dashboard.

Step 3

To edit the hostname, select the row and click the Rename icon. Enter the new name in the pop-out dialog.

  • If the host is not associated with port WWN or the end port is not discovered by DCNM, it is a VHost or LAN Host. The Rename Enclosure dialog box appears only for the existing name.

  • If the host is associated with port WWN and the end port is discovered by DCNM. The Rename Enclosure dialog appears for the associated host names.

    • You can rename each enclosure name to a different name. Choose the enclosure name, enter a new name, click Save. Repeat this procedure to change all the required enclosure names and click Apply.

    • You can rename all enclosure names to the same new name. Check the Include All Members check box, enter a new name, and click Apply.

Note 

Specifying a blank name causes the server to default the name.

Cisco DCNM allows you to change the default assigned Host enclosure name or grouping multiple enclosures into the same enclosure by assigning the same name. Assigning custom enclosure names to respective WWPNs is supported on the Cisco DCNM SAN Client only.

Step 4

To assign storage to host, you can choose the host, and click the Assign icon next to the Rename icon.

The Assign Storage to Host window pops out. The selection of Host is by enclosure, and multiple selections of LUNs is allowed. Click Assign. A confirmation message is displayed. After confirmed, the status will update with the results of each step.

Step 5

Click Quick Filter drop down to filter host enclosures (not storage) by LAN, SAN, and Virtual.


Viewing Host Events

To view the host events from the Cisco DCNM Web UI, perform the following steps:

Procedure


Step 1

Choose Dashboard > Hosts.

The list of hosts in the host enclosures table is displayed.

Step 2

Click the Events icon next to the host enclosure to view the Events panel.

You can use the slider control to resize the panel.


Viewing Host Topology

To view host topology from the Cisco DCNM Web UI, perform the following steps:

Procedure


Step 1

Choose Dashboard > Hosts.

The list of hosts in the host enclosures table is displayed.

Step 2

Select the row to view the host topology details.

You can use the mouse scroll wheel to zoom-in and zoom-out.

Step 3

Click the Fabric/Network icon to view the fabric and network path.

Fabric/Network and All Paths icon

1 - Fabric/Network

6 - Custom Port Group

2 - All Paths

7 - Zoom In

3 - First Shortest Path

8 - Zoom Out

4 - Map View

9 - Zoom Fit

5 - Tabular View

Step 4

Click the All Paths icon to view the complete set-up.

Step 5

Click the First Shortest Path icon to view the first shortest path.

Note 
Click Map View icon to enable the icons that are listed in the preceding step 4, 5 and 6.
Step 6

Click the Tabular View icon to view the host topology in tabular format.

Step 7

Click the Custom Port Group icon to view the custom port group.


View Host Traffic

To view the host traffic from the Cisco DCNM Web UI, perform the following steps:

Procedure


Step 1

From the menu bar, choose Dashboard > Hosts.

The list of hosts in the host enclosures table is displayed.

Step 2

Select the row to view the host topology details.

Step 3

Use the drop-down to select the traffic according to the time duration.

Step 4

Select the icons to view the traffic as a Grid, Line Chart, or Stacked Chart.

Step 5

In the Traffic pane, the Enclosure Traffic is displayed by default. Click the Traffic Utilization icon to view the traffic utilization. The daily average percentage of traffic utilization of the enclosure ports is displayed as a pie chart.