Understanding Node Functional View
The Node Functional View (NFV) provides a visual representation of a network rack, including the node and its associated components, such as cards and chassis. You can also add or manage chassis and passive units, switch between different views, and explore detailed maps of physical connections.
Additionally, NFV enables interaction between the Map and Rack views, allowing you to highlight and zoom in on specific components and their connections, such as optical cross-connections and port details.
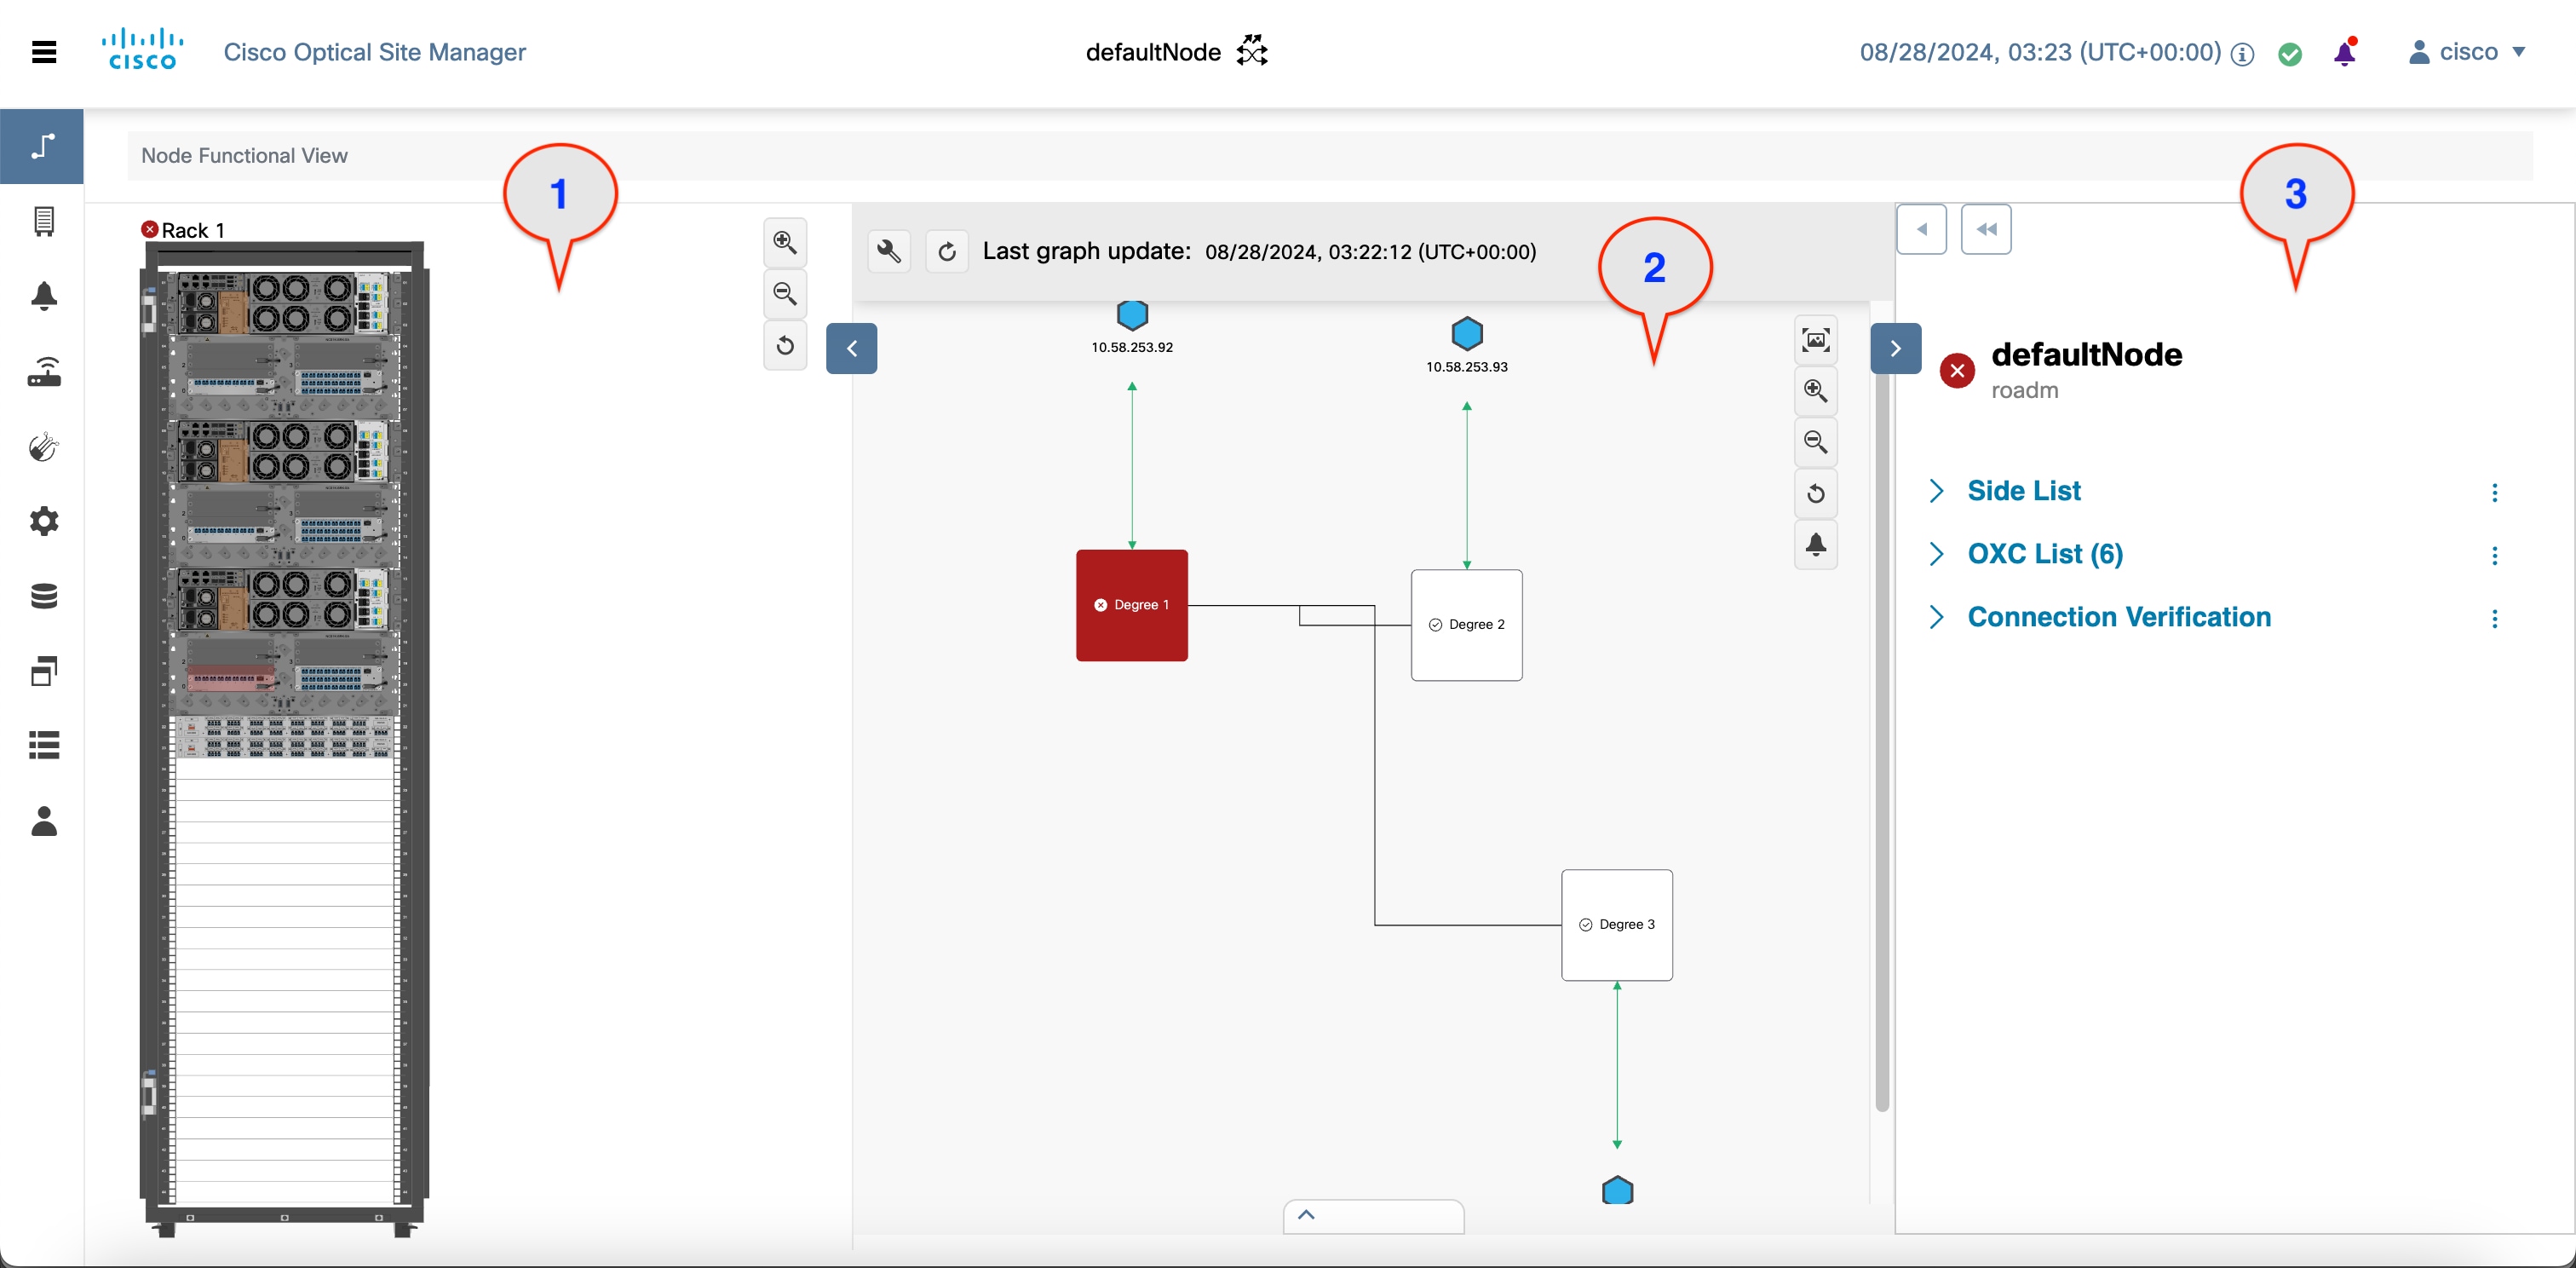
This table describes the three views available in the NFV:
|
Number |
View |
Description |
|---|---|---|
|
1 |
Rack view |
Displays a visual representation of a rack, including the node and its cards. How to Access:Click the Collapse Shoulder button to expand and collapse this view. In this view, you can:
|
|
2 |
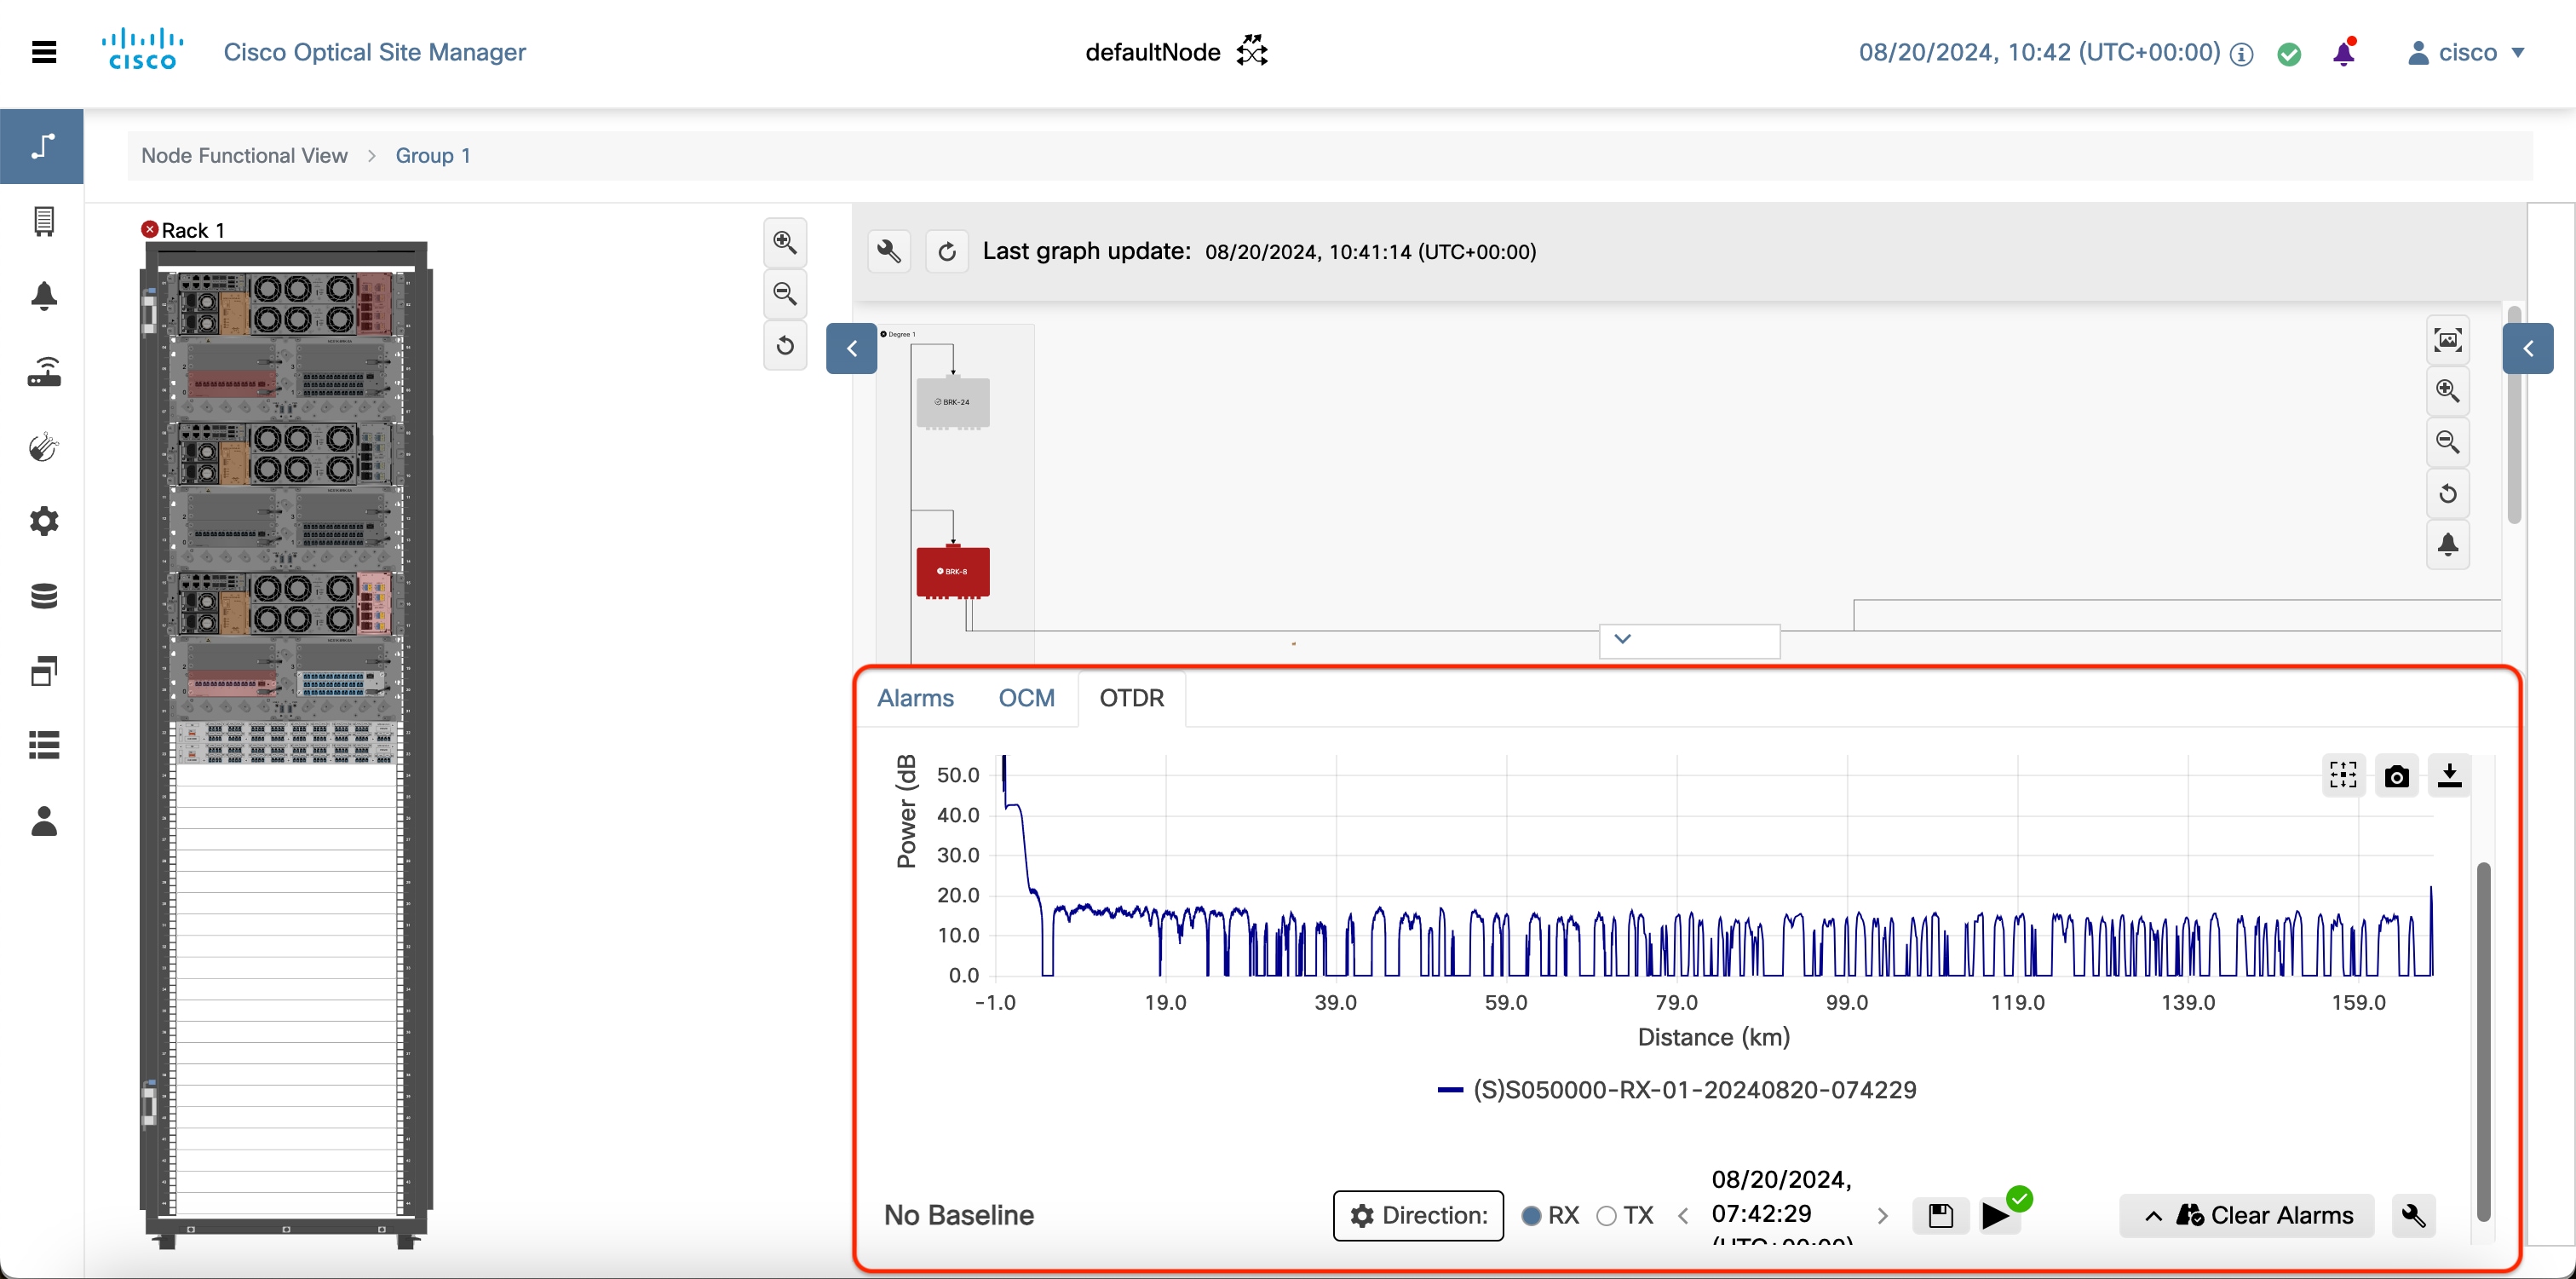
Map view |
Displays a visual map of the components of the node (sides, cards, and so on), connected by patch cords according to physical connections. In this view, you can:
|
|
3 |
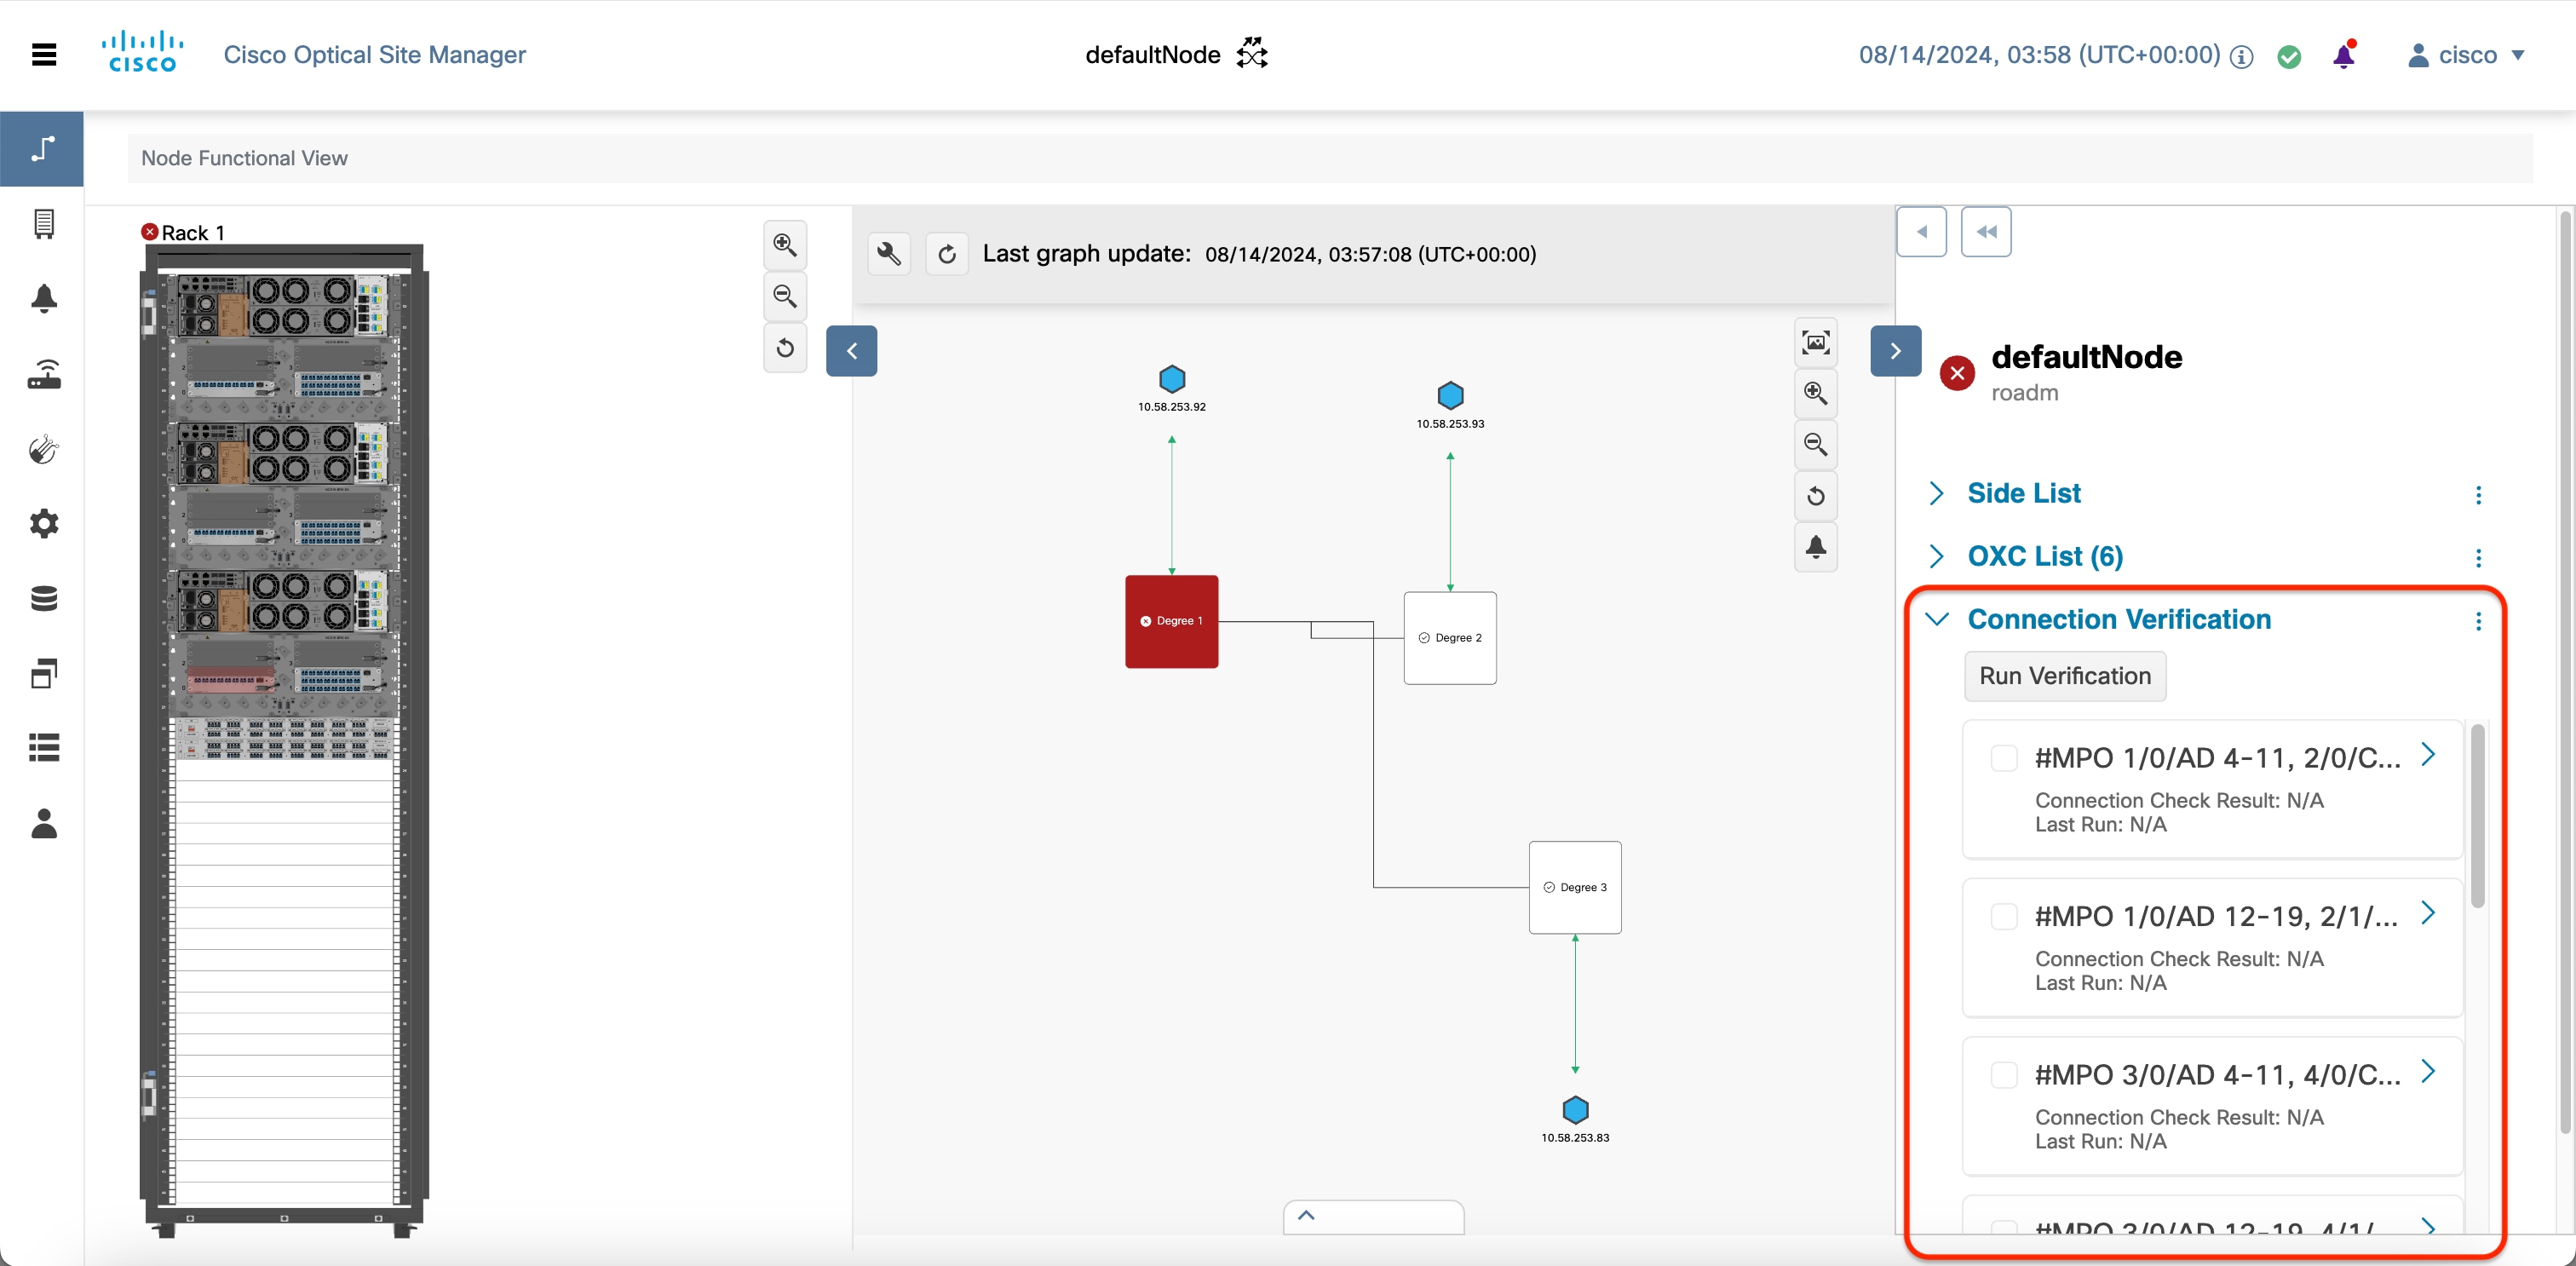
Detail view |
Displays all relevant information about nodes, sides, cards, circuits, ports, or patch cords. In this view, you can view:
How to Access:Click the Collapse Shoulder button to expand and collapse this view. |


 Feedback