Although the data in each type of workflow is different, all
workflows share a common set of features. Workflows can include several types
of pages. The actions you can perform on a workflow page depend on the type of
page.
Drill-down and table view pages in workflows allow you to
quickly narrow your view of the data so you can zero in on events that are
significant to your analysis. Table view pages and drill-down pages both
support many features you can use to constrain the set of events you want to
view or to navigate the workflow. When viewing data on drill-down pages or in
the table view in a workflow, you can sort the data in ascending or descending
order based on any available column. If the database contains more events than
can be displayed on a single workflow page, you can click the links at the
bottom of the page to display more events. When you click one of these links,
the time window automatically pauses so that you do not see the same events
twice; you can unpause the time window when you are ready.
In a multidomain
deployment, you can view data for the current domain and for any descendant
domains. You cannot view data from higher level or sibling domains.
Table
Views
Table views include a column for each of the fields in the
database on which your workflow is based if the page is enabled by default.
For best performance, display only the columns you need. The more columns are displayed, the more resources are required
to display the data.
Note that when you disable a column on a table view, the Firepower System
adds the Count column to the event view if disabling the column could create two or
more identical rows.

Important
|
To avoid a significant performance hit, do not disable any of the following columns: First Packet, Last Packet, Device, Initiator
IP, Responder IP, Source Port/ICMP Type, Destination Port/ICMP Code.
These fields uniquely identify each event, and removing any of them from the view automatically adds the count field to the
table, which is a resource-intensive operation, particularly when there are a large number of fields in the view.
|
When you click on a value in a table view page, you constrain
by that value.
When you create a custom workflow, you add a table view to it
by clicking Add Table View.
Drill-Down
Pages
Generally, drill-down pages are intermediate pages that you use
to narrow your investigation to a few events before moving to a table view
page. Drill-down pages contain a subset of columns that are available in the
database.
For example, a drill-down page for discovery events might
include only the IP Address, MAC Address, and Time columns. A drill-down page
for intrusion events, on the other hand, might include the Priority, Impact
Flag, Inline Result, and Message columns.
Drill-down pages allow you to narrow the scope of events you are
viewing and to move forward in the workflow. If you click on a value in a
drill-down page, for example, you constrain by that value and move to the next
page in the workflow, focusing more closely on events that match your selected
values. Clicking a value in a drill-down page does not disable the column where
the value is, even if the page you advance to is a table view. Note that
drill-down pages for predefined workflows always have a Count column. When you
create a custom workflow, you add a drill-down page to it by clicking
Add Page.
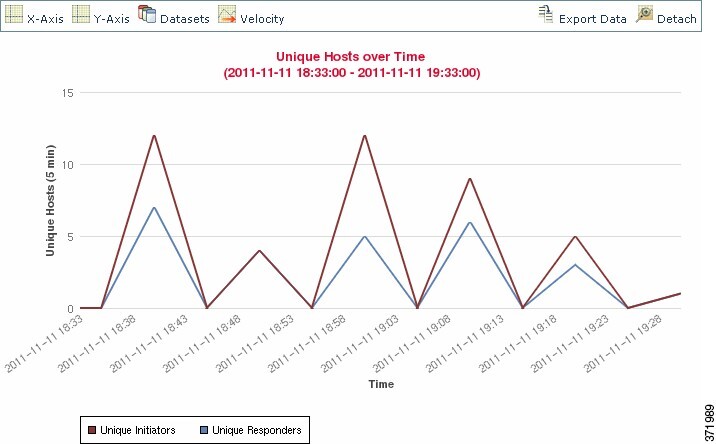
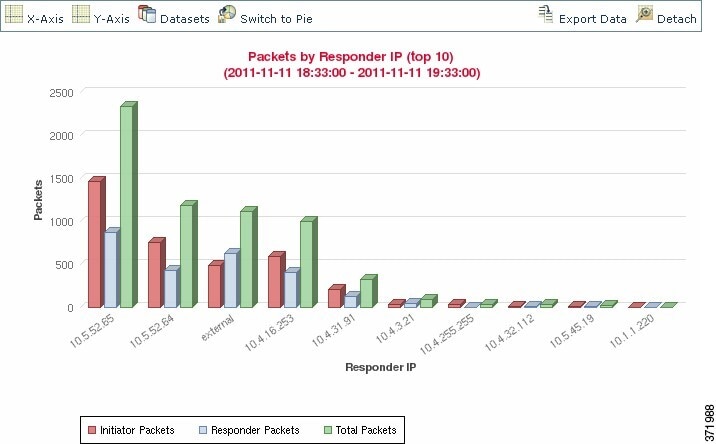
Graphs
Workflows based on connection data can include graph pages, also
called
connection graphs.
For example, a connection graph might display a line graph that
shows the number of connections detected by the system over time. Generally,
connection graphs are, like drill-down pages, intermediate pages that you use
to narrow your investigation.
Final
Pages
The final page of a workflow depends on the type of event on
which the workflow is based:
-
The host view is the final page for workflows based on applications, application details, discovery events, hosts, indications
of compromise (IOC), servers, white list violations, host attributes, or third-party vulnerabilities. Viewing host profiles from this page allows you to easily
view data on all IP addresses associated with hosts that have multiple addresses.
-
The user detail view is the final page for workflows based on users, user activity, and user indications of compromise.
-
The vulnerability detail view is the final page for workflows
based on Cisco vulnerabilities.
-
The packet view is the final page for workflows based on
intrusion events.
Workflows based on other kinds of events (for example, audit log
events or malware events) do not have final pages.
On the final page of a workflow, you can expand detail sections
to view specific information about each object in the set you focused on over
the course of the workflow. Although the web interface does not list the
constraints on the final page of a workflow, previously set constraints are
retained and applied to the set of data.
 )
) )
)


 )
) )
)
 )
) )
) )
) )
) Feedback