Requirements and Prerequisites for Health Monitoring
Model Support
Any
Supported Domains
Any
User Roles
Admin
Maintenance User
The documentation set for this product strives to use bias-free language. For the purposes of this documentation set, bias-free is defined as language that does not imply discrimination based on age, disability, gender, racial identity, ethnic identity, sexual orientation, socioeconomic status, and intersectionality. Exceptions may be present in the documentation due to language that is hardcoded in the user interfaces of the product software, language used based on RFP documentation, or language that is used by a referenced third-party product. Learn more about how Cisco is using Inclusive Language.
The following topics describe how to use health monitoring in the Firepower System:
Any
Any
Admin
Maintenance User
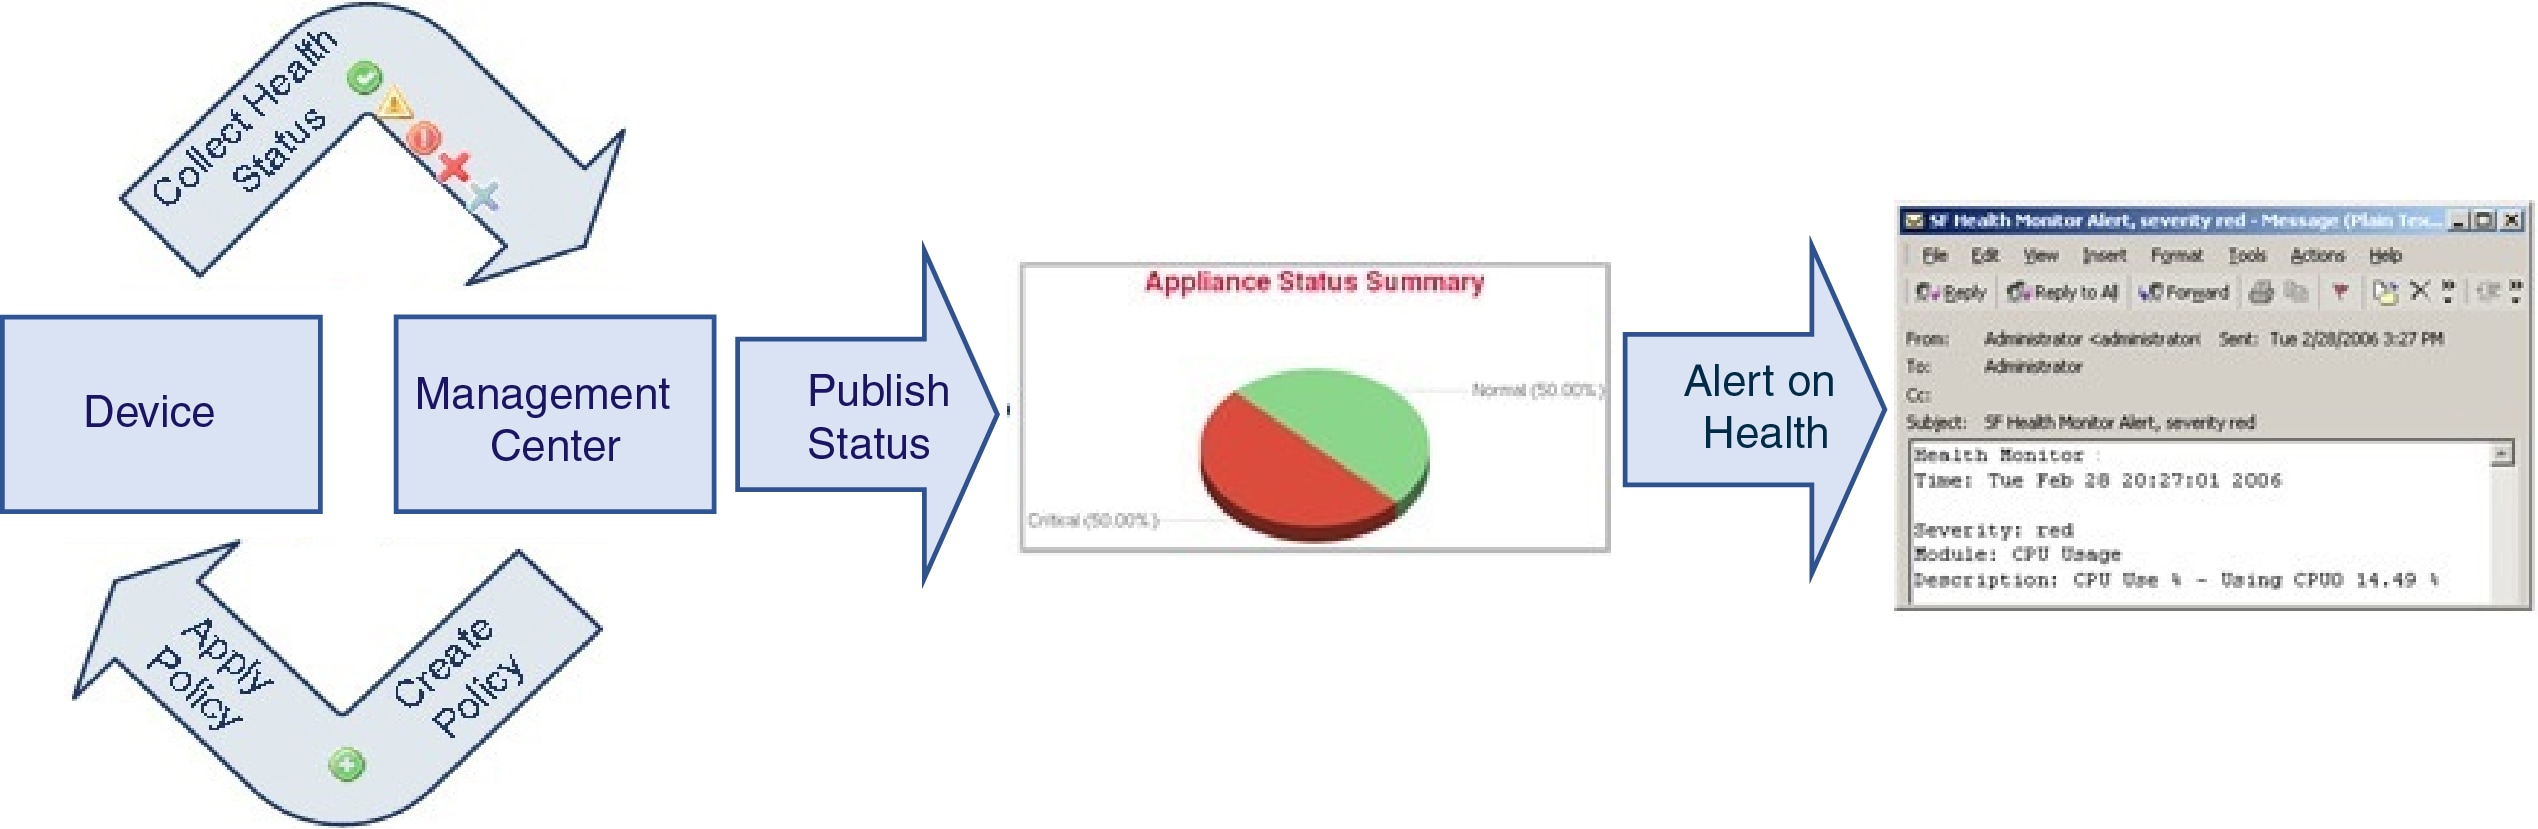
The health monitor on the Firepower Management Center tracks a variety of health indicators to ensure that the hardware and software in the Firepower System are working correctly. You can use the health monitor to check the status of critical functionality across your Firepower System deployment.
You can use the health monitor to create a collection of tests, referred to as a health policy, and apply the health policy to one or more appliances. The tests, referred to as health modules, are scripts that test for criteria you specify. You can modify a health policy by enabling or disabling tests or by changing test settings, and you can delete health policies that you no longer need. You can also suppress messages from selected appliances by blocking them.
The tests in a health policy run automatically at the interval you configure. You can also run all tests, or a specific test, on demand. The health monitor collects health events based on the test conditions configured.
 Note |
All appliances automatically report their hardware status via the Hardware Alarms health module. The Firepower Management Center also automatically reports status using the modules configured in the default health policy. Some health modules, such as the Appliance Heartbeat module, run on the Firepower Management Center and report the status of the Firepower Management Center's managed devices. Some health modules do not provide managed device status unless you apply a health policy configured with those modules to a device. |
You can use the health monitor to access health status information for the entire system, for a particular appliance, or, in a multidomain deployment, a particular domain. Pie charts and status tables on the Health Monitor page provide a visual summary of the status of all appliances on your network, including the Firepower Management Center. Individual appliance health monitors let you drill down into health details for a specific appliance.
Fully customizable event views allow you to quickly and easily analyze the health status events gathered by the health monitor. These event views allow you to search and view event data and to access other information that may be related to the events you are investigating. For example, if you want to see all the occurrences of CPU usage with a certain percentage, you can search for the CPU usage module and enter the percentage value.
You can also configure email, SNMP, or syslog alerting in response to health events. A health alert is an association between a standard alert and a health status level. For example, if you need to make sure an appliance never fails due to hardware overload, you can set up an email alert. You can then create a health alert that triggers that email alert whenever CPU, disk, or memory usage reaches the Warning level you configure in the health policy applied to that appliance. You can set alerting thresholds to minimize the number of repeating alerts you receive.
Note |
The health monitoring can take 5-6 minutes from the occurrence of the health event to generate a health alert. |
You can also generate troubleshooting files for an appliance if you are asked to do so by Support.
Because health monitoring is an administrative activity, only users with administrator user role privileges can access system health data.
In a FMC high-availability deployment running Version 6.7 or higher, the active FMC creates a health monitor page that uses REST APIs to show detailed metric-based information. The standby FMC creates the health monitor page that shows the alert information and provide a visual summary of the status of all appliances on your network using pie charts and status tables. The standby FMC does not display the metric-based information.
Health modules, or health tests, test for the criteria you specify in a health policy.
|
Module |
Platforms |
Description |
||
|---|---|---|---|---|
|
AMP for Endpoints Status |
FMC |
The module alerts if the FMC cannot connect to the AMP cloud or Cisco AMP Private Cloud after an initial successful connection, or if the private cloud cannot contact the public AMP cloud. It also alerts if you deregister an AMP cloud connection using the AMP for Endpoints management console. |
||
|
AMP for Firepower Status (AMP for Networks Status) |
FMC |
This module alerts if:
If your FMC loses connectivity to the Internet, the system may take up to 30 minutes to generate a health alert. |
||
|
Appliance Heartbeat |
Any |
This module determines if an appliance heartbeat is being heard from the appliance and alerts based on the appliance heartbeat status. |
||
|
Automatic Application Bypass Status |
Firepower 7000/8000 series |
This module determines if an appliance has been bypassed because it did not respond within the number of seconds set in the bypass threshold, and alerts when a bypass occurs. | ||
|
Backlog Status |
FMC |
This module alerts if the backlog of event data awaiting transmission from the device to the FMC has grown continuously for more than 30 minutes. To reduce the backlog, evaluate your bandwidth and consider logging fewer events. |
||
|
Card Reset |
Any |
This module checks for network cards which have restarted due to hardware failure and alerts when a reset occurs. |
||
|
Classic License Monitor |
FMC |
This module determines if sufficient Classic licenses remain. It also alerts when devices in a stack have mismatched license sets. It alerts based on a warning level automatically configured for the module. You cannot change the configuration of this module. |
||
|
Cluster/Failover Status |
FTD |
This module monitors the status of device clusters. The module alerts if:
|
||
|
CPU Usage |
Any |
This module checks that the CPU on the appliance is not overloaded and alerts when CPU usage exceeds the percentages configured for the module. |
||
|
Disk Status |
Any |
This module examines performance of the hard disk, and malware storage pack (if installed) on the appliance. This module generates a Warning (yellow) health alert when the hard disk and RAID controller (if installed) are in danger of failing, or if an additional hard drive is installed that is not a malware storage pack. This module generates an Alert (red) health alert when an installed malware storage pack cannot be detected. |
||
|
Disk Usage |
Any |
This module compares disk usage on the appliance’s hard drive and malware storage pack to the limits configured for the module and alerts when usage exceeds the percentages configured for the module. This module also alerts when the system excessively deletes files in monitored disk usage categories, or when disk usage excluding those categories reaches excessive levels, based on module thresholds. See Disk Usage and Drain of Events Health Monitor Alerts for information about troubleshooting scenarios for Disk Usage alerts. Use the Disk Usage health status module to monitor disk usage for the
|
||
|
Hardware Alarms |
Firepower 7000/8000 series FTD hardware |
This module determines if hardware needs to be replaced on a physical managed device and alerts based on the hardware status. The module also reports on the status of hardware-related daemons and on the status of 7000 and 8000 Series devices in high-availability deployments. |
||
|
HA Status |
FMC |
This module monitors and alerts on the high availability status of the FMC. If you have not established FMC high availability, the HA Status is Not in HA. This module does not monitor or alert on the high availability status of managed devices, regardless of whether they are paired. The HA Status for a managed device is always Not in HA. Use the device management page to monitor devices in high availability pairs. |
||
|
Health Monitor Process |
Any |
This module monitors the status of the health monitor itself and alerts if the number of minutes since the last health event received by the FMC exceeds the Warning or Critical limits. |
||
|
Host Limit |
FMC |
This module determines if the number of hosts the FMC can monitor is approaching the limit and alerts based on the warning level configured for the module. For more information, see Firepower System Host Limit. |
||
|
Inline Link Mismatch Alarms |
Any managed device except ASA FirePOWER |
This module monitors the ports associated with inline sets and alerts if the two interfaces of an inline pair negotiate different speeds. |
||
|
Interface Status |
Any |
This module determines if the device currently collects traffic and alerts based on the traffic status of physical interfaces and aggregate interfaces. For physical interfaces, the information includes interface name, link state, and bandwidth. For aggregate interfaces, the information includes interface name, number of active links, and total aggregate bandwidth.
For ASA FirePOWER, interfaces labeled DataPlaneInterfacex, where x is a numerical value, are internal interfaces (not user-defined) and involve packet flow within the system. |
||
|
Intrusion and File Event Rate |
Any managed device |
This module compares the number of intrusion events per second to the limits configured for this module and alerts if the limits are exceeded. If the Intrusion and File Event Rate is zero, the intrusion process may be down or the managed device may not be sending events. Select to check if events are being received from the device. Typically, the event rate for a network segment averages 20 events per second.
For a network segment with this average rate, Events per second (Critical) should
be set to
The maximum number of events you can set for either limit is 999, and the Critical limit must be higher than the Warning limit. |
||
|
Link State Propagation |
Firepower 7000/8000 series ASA 5500-X series and ISA 3000 with FTD |
This module determines when a link in a paired inline set fails and triggers the link state propagation mode. If a link state propagates to the pair, the status classification for that module changes to Critical and the state reads: where |
||
|
Local Malware Analysis |
Any |
This module alerts if a device is configured for local malware analysis and fails to download local malware analysis engine signature updates from the AMP cloud. |
||
|
Memory Usage |
Any |
This module compares memory usage on the appliance to the limits configured for the module and alerts when usage exceeds the levels configured for the module. For appliances with more than 4 GB of memory, the preset alert thresholds are
based on a formula that accounts for proportions of available memory likely to
cause system problems. On >4 GB appliances, because the interval between
Warning and Critical thresholds may be very narrow, Cisco recommends that you
manually set the Warning Threshold % value to
Complex access control policies and rules can command significant resources and negatively affect performance. Some lower-end ASA devices with FirePOWER Services Software may generate intermittent memory usage warnings, as the device’s memory allocation is being used to the fullest extent possible. |
||
|
Platform Faults |
Firepower 2100 series |
On Firepower 2100 devices, a fault is a mutable object that is managed by the FMC. Each fault represents a failure in the device instance or an alarm threshold that has been raised. During the lifecycle of a fault, it can change from one state or severity to another. Each fault includes information about the operational state of the affected object at the time the fault was raised. If the fault is transitional and the failure is resolved, then the object transitions to a functional state. For more information, see the Cisco Firepower 1000/2100 FXOS Faults and Error Messages Guide. |
||
|
Power Supply |
FMC hardware Firepower 7000/8000 series |
This module determines if power supplies on the device require replacement and alerts based on the power supply status.
|
||
|
Process Status |
Any |
This module determines if processes on the appliance exit or terminate outside of the process manager. If a process is deliberately exited outside of the process manager, the module status changes to Warning and the health event message indicates which process exited, until the module runs again and the process has restarted. If a process terminates abnormally or crashes outside of the process manager, the module status changes to Critical and the health event message indicates the terminated process, until the module runs again and the process has restarted. |
||
|
Reconfiguring Detection |
Any managed device |
This module alerts if a device reconfiguration has failed. |
||
|
RRD Server Process |
FMC |
This module determines if the round robin data server that stores time series data is running properly. The module will alert If the RRD server has restarted since the last time it updated; it will enter Critical or Warning status if the number of consecutive updates with an RRD server restart reaches the numbers specified in the module configuration. |
||
|
Security Intelligence |
FMC and devices running Version 6.2.3 or earlier |
This module alerts if Security Intelligence is in use and:
|
||
|
Smart License Monitor |
FMC |
This module alerts if:
|
||
|
Time Series Data Monitor |
FMC |
This module tracks the presence of corrupt files in the directory where time series data (such as correlation event counts) are stored and alerts when files are flagged as corrupt and removed. |
||
|
Time Synchronization Status |
Any |
This module tracks the synchronization of a device clock that obtains time using NTP with the clock on the NTP server and alerts if the difference in the clocks is more than ten seconds. |
||
|
URL Filtering Monitor |
FMC |
This module alerts if the FMC fails to:
|
||
|
User Agent Status |
FMC |
This module alerts when heartbeats are not detected for any User Agents connected to the FMC. |
||
|
VPN Status |
FMC |
This module alerts when one or more VPN tunnels between Firepower devices are down. This module tracks:
|
|
Step 1 |
Determine which health modules you want to monitor as discussed in . You can set up specific policies for each kind of appliance you have in your Firepower System, enabling only the appropriate tests for that appliance.
|
||
|
Step 2 |
Apply a health policy to each appliance where you want to track health status as discussed in Creating Health Policies. |
||
|
Step 3 |
(Optional.) Configure health monitor alerts as discussed in Creating Health Monitor Alerts. You can set up email, syslog, or SNMP alerts that trigger when the health status level reaches a particular severity level for specific health modules. |
A health policy contains configured health test criteria for several modules. You can control which health modules run against each of your appliances and configure the specific limits used in the tests run by each module.
When you configure a health policy, you decide whether to enable each health module for that policy. You also select the criteria that control which health status each enabled module reports each time it assesses the health of a process.
You can create one health policy that can be applied to every appliance in your system, customize each health policy to the specific appliance where you plan to apply it, or use the default health policy provided for you. In a multidomain deployment, administrators in ancestor domains can apply health policies to devices in descendant domains, which descendant domains can use or replace with customized local policies.
The Firepower Management Center setup process creates and applies an initial health policy, in which most—but not all—available health modules are enabled. The system also applies this initial policy to devices added to the Firepower Management Center.
This initial health policy is based on a default health policy, which you can neither view nor edit, but which you can copy when you create a custom health policy.
When you upgrade the FMC, any new health modules are added to all health policies, including the initial health policy, default health policy, and any other custom health policies. Usually, new health modules are added in an enabled state.
Note |
For a new health module to begin monitoring and alerting, reapply health policies after upgrade. |
If you want to customize a health policy to use with your appliances, you can create a new policy. The settings in the policy initially populate with the settings from the health policy you choose as a basis for the new policy. You can enable or disable modules within the policy and change the alerting criteria for each module as needed.
In a multidomain deployment, the system displays policies created in the current domain, which you can edit. It also displays policies created in ancestor domains, which you cannot edit. To view and edit policies created in a lower domain, switch to that domain. Administrators in ancestor domains can apply health policies to devices in descendant domains, which descendant domains can use or replace with customized local policies.
|
Step 1 |
Choose . |
|
Step 2 |
Click New Policy. |
|
Step 3 |
Choose the existing policy that you want to use as the basis for the new policy from the Copy Policy drop-down list. |
|
Step 4 |
Enter a name for the policy. |
|
Step 5 |
Enter a description for the policy. |
|
Step 6 |
Choose Save to save the policy information. |
|
Step 7 |
Choose the module you want to use. |
|
Step 8 |
Choose On for the Enabled option to enable use of the module for health status testing. |
|
Step 9 |
Where appropriate, set the Critical and Warning criteria. |
|
Step 10 |
Configure any additional settings for the module. Repeat steps 7-10 for each module. |
|
Step 11 |
You have three choices:
|
Apply the health policy to each appliance as described in Applying Health Policies. This applies your changes and updates the policy status for all affected policies.
When you apply a health policy to an appliance, the health tests for all the modules you enabled in the policy automatically monitor the health of the processes and hardware on the appliance. Health tests then continue to run at the intervals you configured in the policy, collecting health data for the appliance and forwarding that data to the Firepower Management Center.
If you enable a module in a health policy and then apply the policy to an appliance that does not require that health test, the health monitor reports the status for that health module as disabled.
If you apply a policy with all modules disabled to an appliance, it removes all applied health policies from the appliance so no health policy is applied.
When you apply a different policy to an appliance that already has a policy applied, expect some latency in the display of new data based on the newly applied tests.
In a multidomain deployment, the system displays policies created in the current domain, which you can edit. It also displays policies created in ancestor domains, which you cannot edit. To view and edit policies created in a lower domain, switch to that domain. Administrators in ancestor domains can apply health policies to devices in descendant domains, which descendant domains can use or replace with customized local policies.
|
Step 1 |
Choose . |
||
|
Step 2 |
Click the Apply (
|
||
|
Step 3 |
Choose the appliances where you want to apply the health policy. |
||
|
Step 4 |
Click Apply to apply the policy to the appliances you chose. |
Optionally, monitor the task status; see Viewing Task Messages.
Monitoring of the appliance starts as soon as the policy is successfully applied.
In a multidomain deployment, the system displays policies created in the current domain, which you can edit. It also displays policies created in ancestor domains, which you cannot edit. To view and edit policies created in a lower domain, switch to that domain. Administrators in ancestor domains can apply health policies to devices in descendant domains, which descendant domains can use or replace with customized local policies.
|
Step 1 |
Choose . |
|
Step 2 |
Click Edit ( |
|
Step 3 |
Edit the Policy Name or Policy Description fields as desired. |
|
Step 4 |
Click the health module you want to modify. |
|
Step 5 |
Modify settings as described in Health Modules. |
|
Step 6 |
You have three options:
|
|
Step 7 |
Apply the health policy to your appliance as described in Applying Health Policies. Apply the health policy to each appliance where you want to track health status. When you apply the health policy to an appliance, all the modules you enabled in the policy monitor the health of the processes and hardware on the appliance, and forwards that data to the FMC. |
Reapply the health policy as described in Applying Health Policies. This applies your changes and updates the policy status for all affected policies.
You can delete health policies that you no longer need. If you delete a policy that is still applied to an appliance, the policy settings remain in effect until you apply a different policy. In addition, if you delete a health policy that is applied to a device, any health monitoring alerts in effect for the device remain active until you disable the underlying associated alert response.
In a multidomain deployment, you can only delete health policies created in the current domain.
 Tip |
To stop health monitoring for an appliance, create a health policy with all modules disabled and apply it to the appliance. |
|
Step 1 |
Choose . |
|
Step 2 |
Click Delete ( |
In the course of normal network maintenance, you disable appliances or make them temporarily unavailable. Because those outages are deliberate, you do not want the health status from those appliances to affect the summary health status on your Firepower Management Center.
You can use the health monitor blocklistfeature to disable health monitoring status reporting on an appliance or module. For example, if you know that a segment of your network will be unavailable, you can temporarily disable health monitoring for a managed device on that segment to prevent the health status on the Firepower Management Center from displaying a warning or critical state because of the lapsed connection to the device.
When you disable health monitoring status, health events are still generated, but they have a disabled status and do not affect the health status for the health monitor. If you remove the appliance or module from the blocklist, the events that were generated during the blocklisting continue to show a status of disabled.
To temporarily disable health events from an appliance, go to the blocklist configuration page and add an appliance to the blocklist. After the setting takes effect, the system no longer includes the blocklisted appliance when calculating the overall health status. The Health Monitor Appliance Status Summary lists the appliance as disabled.
You can also disable an individual health module. For example, when you reach the host limit on a Firepower Management Center, you can disable Host Limit status messages.
Note that on the main Health Monitor page you can distinguish between appliances that are blocklisted if you expand to view the list of appliances with a particular status by clicking the arrow in that status row.
A Blocklist
( )
icon and a notation are visible after you expand the view for a blocklisted or partially blocklisted appliance.
)
icon and a notation are visible after you expand the view for a blocklisted or partially blocklisted appliance.
Note |
On a Firepower Management Center, Health Monitor blocklist settings are local configuration settings. Therefore, if you blocklist a device, then delete it and later re-register it with the Firepower Management Center, the blocklist settings remain persistent. The newly re-registered device remains blocklisted. |
In a multidomain deployment, administrators in ancestor domains can blocklist an appliance or health module in descendant domains. However, administrators in the descendant domains can override the ancestor configuration and clear the blocklist for devices in their domain.
You can blocklist appliances individually or by group, model, or associated health policy.
If you need to set the events and health status for an individual appliance to disabled, you can blocklist the appliance. After the blocklist settings take effect, the appliance shows as disabled in the Health Monitor Appliance Module Summary, and health events for the appliance have a status of disabled.
In a multidomain deployment, blocklisting an appliance in an ancestor domain blocklists it for all descendant domains. Descendant domains can override this inherited configuration and clear the blocklist. You can only blocklist the Firepower Management Center at the Global level.
|
Step 1 |
Choose . |
||
|
Step 2 |
Use the drop-down list on the right to sort the list by group, model, or by health policy.
|
||
|
Step 3 |
You have two choices:
|
You can blocklist individual health policy modules on appliances. You may want to do this to prevent events from the module from changing the status for the appliance to warning or critical.
After the blocklist settings take effect, the appliance shows as Partially Blocklisted or All Modules Blocklisted on the Blocklist page and in the Appliance Health Monitor Module Status Summary, but only in expanded views on the main Appliance Status Summary page.
Tip |
Make sure that you keep track of individually blocklisted modules so you can reactivate them when you need them. You may miss necessary warning or critical messages if you accidentally leave a module disabled. |
In a multidomain deployment, administrators in ancestor domains can blocklist health modules in descendant domains. However, administrators in descendant domains can override this ancestor configuration and clear the blocklisting for policies applied in their domains. You can only blocklist Firepower Management Center health modules at the Global level.
|
Step 1 |
Choose . |
|
Step 2 |
Click Edit ( |
|
Step 3 |
Check the check boxes next to the health policy modules you want to blocklist. Certain modules are applicable to specific devices only; for more information, see Health Modules. |
|
Step 4 |
Click OK. |
|
Step 5 |
In the device exclusion main page, click Apply. |
You can set up alerts to notify you through email, through SNMP, or through the system log when the status changes for the modules in a health policy. You can associate an existing alert response with health event levels to trigger and alert when health events of a particular level occur.
For example, if you are concerned that your appliances may run out of hard disk space, you can automatically send an email to a system administrator when the remaining disk space reaches the warning level. If the hard drive continues to fill, you can send a second email when the hard drive reaches the critical level.
In a multidomain deployment, you can view and modify health monitor alerts created in the current domain only.
The alerts generated by the health monitor contain the following information:
Severity, which indicates the severity level of the alert.
Module, which specifies the health module whose test results triggered the alert.
Description, which includes the health test results that triggered the alert.
The table below describes these severity levels.
|
Severity |
Description |
|---|---|
|
Critical |
The health test results met the criteria to trigger a Critical alert status. |
|
Warning |
The health test results met the criteria to trigger a Warning alert status. |
|
Normal |
The health test results met the criteria to trigger a Normal alert status. |
|
Error |
The health test did not run. |
|
Recovered |
The health test results met the criteria to return to a normal alert status, following a Critical or Warning alert status. |
You must be an Admin user to perform this procedure.
When you create a health monitor alert, you create an association between a severity level, a health module, and an alert response. You can use an existing alert or configure a new one specifically to report on system health. When the severity level occurs for the selected module, the alert triggers.
If you create or update a threshold in a way that duplicates an existing threshold, you are notified of the conflict. When duplicate thresholds exist, the health monitor uses the threshold that generates the fewest alerts and ignores the others. The timeout value for the threshold must be between 5 and 4,294,967,295 minutes.
In a multidomain deployment, you can view and modify health monitor alerts created in the current domain only.
Configure an alert response that governs the Firepower Management Center's communication with the SNMP, syslog, or email server where you send the health alert; see Firepower Management Center Alert Responses.
|
Step 1 |
Choose . |
|
Step 2 |
Enter a name for the health alert in the Health Alert Name field. |
|
Step 3 |
From the Severity list, choose the severity level you want to use to trigger the alert. |
|
Step 4 |
From the Module list, choose the health policy modules for which you want the alert to apply. |
|
Step 5 |
From the Alert list, choose the alert response that you want to trigger when the specified severity level is reached. |
|
Step 6 |
Optionally, in the Threshold Timeout field, enter the number of minutes that should elapse before each threshold period ends and the threshold count resets. Even if the policy run time interval value is less than the threshold timeout value, the interval between two reported health events from a given module is always greater. For example, if you change the threshold timeout to 8 minutes and the policy run time interval is 5 minutes, there is a 10-minute interval (5 x 2) between reported events. |
|
Step 7 |
Click Save to save the health alert. |
You must be an Admin user to perform this procedure.
You can edit existing health monitor alerts to change the severity level, health module, or alert response associated with the health monitor alert.
In a multidomain deployment, you can view and modify health monitor alerts created in the current domain only.
|
Step 1 |
Choose . |
|
Step 2 |
Choose the alert you want to modify from the Active Health Alerts list. |
|
Step 3 |
Click Load to load the configured settings for the alert you chose. |
|
Step 4 |
Modify settings as needed. |
|
Step 5 |
Click Save to save the modified health alert. |
In a multidomain deployment, you can view and modify health monitor alerts created in the current domain only.
|
Step 1 |
Choose . |
|
Step 2 |
Choose the active health alerts you want to delete, then click Delete. |
Disable or delete the underlying alert response to ensure that alerting does not continue; see Firepower Management Center Alert Responses.
You must be an Admin, Maintenance, or Security Analyst user to perform this procedure.
The health monitor provides the compiled health status for all devices managed by the Firepower Management Center, plus the Firepower Management Center. The health monitor is composed of: The health summary is shown when hovering on the hexagon that representing the device health.
The status table — Provides a count of the managed appliances for this Firepower Management Center by overall health status.
The pie chart — Indicates the percentage of appliances currently in each health status category.
The appliance list — Provides details on the health of the managed devices.
In a multidomain deployment, the health monitor in an ancestor domain displays data from all descendant domains. In the descendant domains, it displays data from the current domain only.
|
Step 1 |
Choose . |
||
|
Step 2 |
Choose the appropriate status in the Status column of the table or the appropriate portion of the pie chart to the list appliances with that status.
|
||
|
Step 3 |
You have the following choices:
|
Available status categories are listed by severity in the table below.
|
Status Level |
Status Icon |
Status Color in Pie Chart |
Description |
|---|---|---|---|
|
Error |
Error ( ) ) |
Black |
Indicates that at least one health monitoring module has failed on the appliance and has not been successfully re-run since the failure occurred. Contact your technical support representative to obtain an update to the health monitoring module. |
|
Critical |
Critical ( ) ) |
Red |
Indicates that the critical limits have been exceeded for at least one health module on the appliance and the problem has not been corrected. |
|
Warning |
 ) ) |
Yellow |
Indicates that warning limits have been exceeded for at least one health module on the appliance and the problem has not been corrected. This status also indicates a transitionary state, where the required data is temporarily unavailable or could not be processed because of changes in the device configuration. Depending on the monitoring cycle, this transitionary state is auto-corrected. |
|
Normal |
 ) ) |
Green |
Indicates that all health modules on the appliance are running within the limits configured in the health policy applied to the appliance. |
|
Recovered |
Recovered
() |
Green |
Indicates that all health modules on the appliance are running within the limits configured in the health policy applied to the appliance, including modules that were in a Critical or Warning state. |
|
Disabled |
Disabled ( ) ) |
Blue |
Indicates that an appliance is disabled or blocked, that the appliance does not have a health policy applied to it, or that the appliance is currently unreachable. |
You must be an Admin, Maintenance, or Security Analyst user to perform this procedure.
The Appliance Health Monitor provides a detailed view of the health status of an appliance.
In a multidomain deployment, you can view the health status of appliances in descendant domains.
Tip |
Your session normally logs you out after 1 hour of inactivity (or another configured interval). If you plan to passively monitor health status for long periods of time, consider exempting some users from session timeout, or changing the system timeout settings. See Add an Internal User at the Web Interface and Configure Session Timeouts for more information. |
|
Step 1 |
Choose . |
||
|
Step 2 |
Expand the appliance list. To show appliances with a particular status, click the arrow in that status row. Alternatively, in the Appliance Status Summary graph, click the color for the appliance status category you want to view.
|
||
|
Step 3 |
In the Appliance column of the appliance list, click the name of the appliance for which you want to view details.
|
If you want to run all health modules for the appliance, see Running All Modules for an Appliance
If you want to run a specific health module for an appliance, see Running a Specific Health Module
If you want to generate health module alert graphs for the appliance, see Generating Health Module Alert Graphs
If you want to produce troubleshooting files for the appliance, see Downloading Advanced Troubleshooting Files
If you want to download advanced troubleshooting files for the appliance, see Downloading Advanced Troubleshooting Files
If you want to execute Firepower Threat Defense CLI commands from the Firepower Management Center web interface, see Using the Firepower Threat Defense CLI from the Web Interface
You must be an Admin, Maintenance, or Security Analyst user to perform this procedure.
Health module tests run automatically at the policy run time interval you configure when you create a health policy. However, you can also run all health module tests on demand to collect up-to-date health information for the appliance.
In a multidomain deployment, you can run health module tests for appliances in the current domain and in any descendant domains.
|
Step 1 |
View the health monitor for the appliance; see Viewing Appliance Health Monitors. |
||
|
Step 2 |
Click Run All Modules. The status bar indicates the progress of the tests, then the Health Monitor Appliance page refreshes.
|
You must be an Admin, Maintenance, or Security Analyst user to perform this procedure.
Health module tests run automatically at the policy run time interval you configure when you create a health policy. However, you can also run a health module test on demand to collect up-to-date health information for that module.
In a multidomain deployment, you can run health module tests for appliances in the current domain and in any descendant domains.
|
Step 1 |
View the health monitor for the appliance; see Viewing Appliance Health Monitors. |
||
|
Step 2 |
In the Module Status Summary graph, click the color for the health alert status category you want to view. |
||
|
Step 3 |
In the Alert Detail row for the alert for which you want to view a list of events, click Run. The status bar indicates the progress of the test, then the Health Monitor Appliance page refreshes.
|
You must be an Admin, Maintenance, or Security Analyst user to perform this procedure.
You can graph the results over a period of time of a particular health test for a specific appliance.
|
Step 1 |
View the health monitor for the appliance; see Viewing Appliance Health Monitors. |
||
|
Step 2 |
In the Module Status Summary graph of the Health Monitor Appliance page, click the color for the health alert status category you want to view. |
||
|
Step 3 |
In the Alert Detail row for the alert for which you want to view a list of events, click Graph.
|
The Health Event View page allows you to view health events logged by the health monitor on the Firepower Management Center logs health events. The fully customizable event views allow you to quickly and easily analyze the health status events gathered by the health monitor. You can search event data to easily access other information that may be related to the events you are investigating. If you understand what conditions each health module tests for, you can more effectively configure alerting for health events.
You can perform many of the standard event view functions on the health event view pages.
You must be an Admin, Maintenance, or Security Analyst user to perform this procedure.
The Table View of Health Events page provides a list of all health events on the specified appliance.
When you access health events from the Health Monitor page on your Firepower Management Center, you retrieve all health events for all managed appliances.
In a multidomain deployment, you can view data for the current domain and for any descendant domains. You cannot view data from higher level or sibling domains.
Tip |
You can bookmark this view to allow you to return to the page in the health events workflow containing the Health Events table of events. The bookmarked view retrieves events within the time range you are currently viewing, but you can then modify the time range to update the table with more recent information if needed. |
|
Choose .
|
|
Step 1 |
View the health monitor for the appliance; see Viewing Appliance Health Monitors. |
|
Step 2 |
In the Module Status Summary graph, click the color for the event status category you want to view. The Alert Detail list toggles the display to show or hide events. |
|
Step 3 |
In the Alert Detail row for the alert for which you want to view a list of events, click Events. The Health Events page appears, containing results for a query with the name of the appliance and the name of the specified health alert module as constraints. If no events appear, you may need to adjust the time range. |
|
Step 4 |
If you want to view all health events for the specified appliance, expand Search Constraints, and click the Module Name constraint to remove it. |
In a multidomain deployment, you can view data for the current domain and for any descendant domains. You cannot view data from higher level or sibling domains.
|
Step 1 |
Choose . |
|
Step 2 |
You have the following choices:
|
Note |
The 8350 hardware platform has six fans, which display as FAN2 through FAN7. This is expected behavior. If you receive a hardware alert related to FAN1 or fan numbering in general on the 8350 platform, you can disregard the alert. |
|
Condition Monitored |
Causes of Yellow or Red Error Conditions |
|---|---|
|
Device high availability status |
If 7000 or 8000 Series devices in a high-availability pair are no longer communicating with each other (due, for example, to a cabling problem), the Hardware Alarms module changes to red. |
|
|
If the
|
|
NFE cards detected |
Indicates the number of NFE cards detected on the system. If this value does not match the appliance’s expected NFE count, the Hardware Alarms module changes to red. |
|
NFE hardware status |
If one or more NFE cards are not communicating, the Hardware Alarms module changes to red and the applicable card appears in the message details. |
|
NFE heartbeat |
If the system detects no NFE heartbeat, the Hardware Alarms module changes to red and message details include a reference to the relevant card(s). |
|
NFE internal link status |
If the link between the NMSB and NFE card(s) goes down, the Hardware Alarms module changes to red and message details include a reference to the relevant ports. |
|
NFE Message daemon |
If the NFE Message daemon goes down, health status for the Hardware Alarms module changes to red and the message details include a reference to the daemon (and, if applicable, the NFE card number). |
|
NFE temperature |
If NFE temperature exceeds 97 degrees Celsius, health status for the Hardware Alarms module changes to yellow and message details include a reference to the NFE temperature (and, if applicable, the NFE card number). If NFE temperature exceeds 102 degrees Celsius, health status for the Hardware Alarms module changes to red and message details include a reference to the NFE temperature. (and, if applicable, the NFE card number). |
|
NFE temperature status |
Indicates the current temperature status of the given NFE card. The Hardware Alarms module indicates green for OK, yellow for Warning, and red for Critical (and, if applicable, the NFE card number). |
|
NFE
|
If the NFE
|
|
|
If the
|
|
NFE Platform daemon |
If the NFE Platform daemon goes down, health status for the Hardware Alarms module changes to red and message details include a reference to the daemon (and, if applicable, the NFE card number). |
|
NMSB communications |
If the Media assembly is not present or not communicating, health status for the Hardware Alarms module changes to red and message details include a reference to the NFE temperature (and, if applicable, the NFE card number). |
|
|
If the
|
|
|
If the
|
|
|
If the
|
The Health Monitor modules you choose to enable in your health policy run various tests to determine appliance health status. When the health status meets criteria that you specify, a health event is generated.
The table below describes the fields that can be viewed and searched in the health events table.
|
Field |
Description |
|---|---|
|
Module Name |
Specify the name of the module which generated the health events
you want to view. For example, to view events that measure CPU performance,
type
|
|
Test Name (Search only) |
The name of the health module that generated the event. |
|
Time (Search only) |
The timestamp for the health event. |
|
Description |
The description of the health module that generated the event.
For example, health events generated when a process was unable to execute are
labeled
|
|
Value |
The value (number of units) of the result obtained by the health test that generated the event. For example, if the Firepower Management Center generates a health event whenever a device it is monitoring is using 80 percent or more of its CPU resources, the value could be a number from 80 to 100. |
|
Units |
The units descriptor for the result. You can use the asterisk (*) to create wildcard searches. For example, if the Firepower Management Center generates a health event when a device it is monitoring is using 80 percent or more of its CPU resources, the units descriptor is a percentage sign (%). |
|
Status |
The status (Critical, Yellow, Green, or Disabled) reported for the appliance. |
|
Domain |
For health
events reported by managed devices, the domain of the device that reported the
health event. For health events reported by the
Firepower Management Center,
|
|
Device |
The appliance where the health event was reported. |
 )
) )
) )
) )
) Feedback