Inspection for Mobile Networks

The following topics explain application inspection for protocols used in mobile networks such as LTE. These inspections require the Carrier license. For information on why you need to use inspection for certain protocols, and the overall methods for applying inspection, see Getting Started with Application Layer Protocol Inspection.

Mobile Network Inspection Overview

The following topics explain the inspections available for protocols used in mobile networks such as LTE. There are other services available for SCTP traffic in addition to inspection.

GTP Inspection Overview

GPRS Tunneling Protocol is used in GSM, UMTS and LTE networks for general packet radio service (GPRS) traffic. GTP provides a tunnel control and management protocol to provide GPRS network access for a mobile station by creating, modifying, and deleting tunnels. GTP also uses a tunneling mechanism for carrying user data packets.

Service provider networks use GTP to tunnel multi-protocol packets through the GPRS backbone between endpoints. In GTPv0-1, GTP is used for signaling between gateway GPRS support nodes (GGSN) and serving GPRS support nodes (SGSN). In GTPv2, the signaling is between Packet Data Network Gateways (PGW) and the Serving Gateway (SGW) as well as other endpoints. The GGSN/PGW is the interface between the GPRS wireless data network and other networks. The SGSN/SGW performs mobility, data session management, and data compression.

You can use the ASA to provide protection against rogue roaming partners. Place the device between the home GGSN/PGW and visited SGSN/SGW endpoints and use GTP inspection on the traffic. GTP inspection works only on traffic between these endpoints. In GTPv2, this is known as the S5/S8 interface.

GTP and associated standards are defined by 3GPP (3rd Generation Partnership Project). For detailed information, see http://www.3gpp.org.

GTP Inspection Limitations

Following are some limitations on GTP inspection:

  • GTPv2 piggybacking messages are not supported. They are always dropped.

  • GTPv2 emergency UE attach is supported only if it contains IMSI (International Mobile Subscriber Identity).

  • GTP inspection does not inspect early data. That is, data sent from a PGW or SGW right after a Create Session Request but before the Create Session Response.

  • For GTPv2, inspection supports up to 3GPP 29.274 Release 10 version 13. For GTPv1, support is up to release 10.12 of 3GPP 29.060. For GTPv0, support is up to release 8.

  • GTP inspection does not support inter-SGSN handoff to the secondary PDP context. Inspection needs to do the handoff for both primary and secondary PDP contexts.

Stream Control Transmission Protocol (SCTP) Inspection and Access Control

SCTP (Stream Control Transmission Protocol) is described in RFC 4960. The protocol supports the telephony signaling protocol SS7 over IP and is also a transport protocol for several interfaces in the 4G LTE mobile network architecture.

SCTP is a transport-layer protocol operating on top of IP in the protocol stack, similar to TCP and UDP. However, SCTP creates a logical communication channel, called an association, between two end nodes over one or more source or destination IP addresses. This is called multi-homing. An association defines a set of IP addresses on each node (source and destination) and a port on each node. Any IP address in the set can be used as either a source or a destination IP address of data packets associated to this association to form multiple connections. Within each connection, multiple streams may exist to send messages. A stream in SCTP represents a logical application data channel.

The following figure illustrates the relationship between an association and its streams.

Figure 1. Relationship Between SCTP Association and Streams

Relationship amound SCTP applications, associations, and network streams.

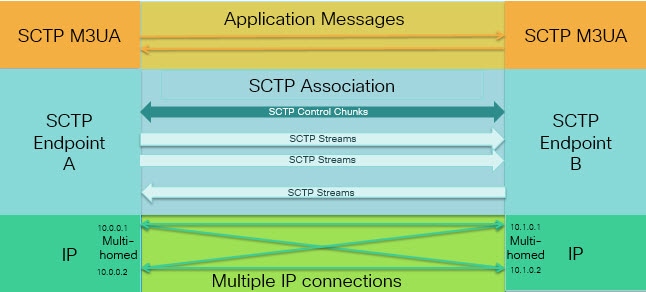
If you have SCTP traffic going through the ASA, you can control access based on SCTP ports, and implement application layer inspection to enable connections and to optionally filter on payload protocol ID to selectively drop, log, or rate limit applications.


Note

Each node can have up to three IP addresses. Any addresses over the limit of three are ignored and not included in the association. Pinholes for secondary IP addresses are opened automatically. You do not need to write access control rules to allow them.


The following sections describe the services available for SCTP traffic in more detail.

SCTP Stateful Inspection

Similar to TCP, SCTP traffic is automatically inspected at layer 4 to ensure well-structured traffic and limited RFC 4960 enforcement. The following protocol elements are inspected and enforced:

  • Chunk types, flags, and length.

  • Verification tags.

  • Source and destination ports, to prevent association redirect attacks.

  • IP addresses.

SCTP stateful inspection accepts or rejects packets based on the association state:

  • Validating the 4-way open and close sequences for initial association establishment.

  • Verifying the forward progression of TSN within an association and a stream.

  • Terminating an association when seeing the ABORT chunk due to heartbeat failure. SCTP endpoints might send the ABORT chunk in response to bombing attacks.

If you decide you do not want these enforcement checks, you can configure SCTP state bypass for specific traffic classes, as explained in Configure Connection Settings for Specific Traffic Classes (All Services).

SCTP NAT

You can apply static network object NAT to the addresses in SCTP association establishment messages. Although you can configure static twice NAT, this is not recommended because the topology of the destination part of the SCTP association is unknown. You cannot use dynamic NAT/PAT.

NAT for SCTP depends upon SCTP stateful inspection rather than SCTP application-layer inspection. Thus, you cannot NAT traffic if you configure SCTP state bypass.

SCTP Application Layer Inspection

You can further refine your access rules by enabling SCTP inspection and filtering on SCTP applications. You can selectively drop, log, or rate limit SCTP traffic classes based on the payload protocol identifier (PPID).

If you decide to filter on PPID, keep the following in mind:

  • PPIDs are in data chunks, and a given packet can have multiple data chunks or even a control chunk. If a packet includes a control chunk or multiple data chunks, the packet will not be dropped even if the assigned action is drop.

  • If you use PPID filtering to drop or rate-limit packets, be aware that the transmitter will resend any dropped packets. Although a packet for a rate-limited PPID might make it through on the next attempt, a packet for a dropped PPID will again be dropped. You might want to evaluate the eventual consequence of these repeated drops on your network.

SCTP Limitations

SCTP support includes the following limitations.

  • Each node can have up to three IP addresses. Any addresses over the limit of three are ignored and not included in the association. Pinholes for secondary IP addresses are opened automatically. You do not need to write access control rules to allow them.

  • Unused pinholes time out in 5 minutes.

  • Dual stack IPv4 and IPv6 addresses on multi-homed endpoints is not supported.

  • Network object static NAT is the only supported type of NAT. Also, NAT46 and NAT64 are not supported.

  • Fragmentation and reassembly of SCTP packets is done only for traffic handled by Diameter, M3UA, and SCTP PPID-based inspection.

  • ASCONF chunks, which are used to dynamically add or delete IP addresses in SCTP, are not supported.

  • The Hostname parameter in INIT and INIT-ACK SCTP messages, which is used to specify a hostname which can then be resolved to an IP address, is not supported.

  • SCTP/M3UA does not support equal-cost multipath routing (ECMP), whether configured on the ASA or elsewhere in the network. With ECMP, packets can be routed to a destination over multiple best paths. However, an SCTP/M3UA packet response to a single destination has to come back on the same interface that it exited. Even though the response can come from any M3UA server, it must always come back on the same interface that it exited. The symptom for this problem is that SCTP INIT-ACK packets are dropped, which you can see in the show asp drop flow sctp-chunk-init-timeout counter:

    
    Flow drop:
    SCTP INIT timed out (not receiving INIT ACK)(sctp-chunk-init-timeout)


    If you encounter this problem, you can resolve it by configuring static routes to the M3UA servers, or by configuring policy-based routing to implement a network design that ensures that INIT-ACK packets go through the same interface as the INIT packets.

Diameter Inspection

Diameter is an Authentication, Authorization, and Accounting (AAA) protocol used in next-generation mobile and fixed telecom networks such as EPS (Evolved Packet System) for LTE (Long Term Evolution) and IMS (IP Multimedia Subsystem). It replaces RADIUS and TACACS in these networks.

Diameter uses TCP and SCTP as the transport layer, and secures communications using TCP/TLS and SCTP/DTLS. It can optionally provide data object encryption as well. For detailed information on Diameter, see RFC 6733.

Diameter applications perform service management tasks such as deciding user access, service authorization, quality of service, and rate of charging. Although Diameter applications can appear on many different control-plane interfaces in the LTE architecture, the ASA inspects Diameter command codes and attribute-value pairs (AVP) for the following interfaces only:

  • S6a: Mobility Management Entity (MME) - Home Subscription Service (HSS).

  • S9: PDN Gateway (PDG) - 3GPP AAA Proxy/Server.

  • Rx: Policy Charging Rules Function (PCRF) - Call Session Control Function (CSCF).

Diameter inspection opens pinholes for Diameter endpoints to allow communication. The inspection supports 3GPP version 12 and is RFC 6733 compliant. You can use it for TCP/TLS (by specifying a TLS proxy when you enable inspection) and SCTP, but not SCTP/DTLS. Use IPsec to provide security to SCTP Diameter sessions.

You can optionally use a Diameter inspection policy map to filter traffic based on application ID, command codes, and AVP, to apply special actions such as dropping packets or connections, or logging them. You can create custom AVP for newly-registered Diameter applications. Filtering lets you fine-tune the traffic you allow on your network.


Note

Diameter messages for applications that run on other interfaces will be allowed and passed through by default. However, you can configure a Diameter inspection policy map to drop these applications by application ID, although you cannot specify actions based on the command codes or AVP for these unsupported applications.


M3UA Inspection

MTP3 User Adaptation (M3UA) is a client/server protocol that provides a gateway to the SS7 network for IP-based applications that interface with the SS7 Message Transfer Part 3 (MTP3) layer. M3UA makes it possible to run the SS7 User Parts (such as ISUP) over an IP network. M3UA is defined in RFC 4666.

M3UA uses SCTP as the transport layer. SCTP port 2905 is the default port.

The MTP3 layer provides networking functions such as routing and node addressing, but uses point codes to identify nodes. The M3UA layer exchanges Originating Point Codes (OPC) and Destination Point Codes (DPC). This is similar to how IP uses IP addresses to identify nodes.

M3UA inspection provides limited protocol conformance. You can optionally implement strict application server process (ASP) state checking and additional message validation for select messages. Strict ASP state checking is required if you want stateful failover or if you want to operate within a cluster. However, strict ASP state checking works in Override mode only, it does not work if you are running in Loadsharing or Broadcast mode (per RFC 4666). The inspection assumes there is one and only one ASP per endpoint.

You can optionally apply access policy based on point codes or Service Indicators (SI). You can also apply rate limiting based on message class and type.

M3UA Protocol Conformance

M3UA inspection provides the following limited protocol enforcement. Inspection drops and logs packets that do not meet requirements.

  • Common message header. Inspection validates all fields in the common header.

    • Version 1 only.

    • Message length must be correct.

    • Message type class with a reserved value is not allowed.

    • Invalid message ID within the message class is not allowed.

  • Payload data message.

    • Only one parameter of a given type is allowed.

    • Data messages on SCTP stream 0 are not allowed.

  • The Affected Point Code field must be present in the following messages or the message is dropped: Destination Available (DAVA), Destination Unavailable (DUNA), Destination State Audit (DAUD), Signaling Congestion (SCON), Destination User Part Unavailable (DUPU), Destination Restricted (DRST).

  • If you enable message tag validation for the following messages, the content of certain fields are checked and validated. Messages that fail validation are dropped.

    • Destination User Part Unavailable (DUPU)—The User/Cause field must be present, and it must contain only valid cause and user codes.

    • Error—All mandatory fields must be present and contain only allowed values. Each error message must contain the required fields for that error code.

    • Notify—The status type and status information fields must contain allowed values only.

  • If you enable strict application server process (ASP) state validation, the system maintains the ASP states of M3UA sessions and allows or drops ASP messages based on the validation result. If you do not enable strict ASP state validation, all ASP messages are forwarded uninspected.

M3UA Inspection Limitations

Following are some limitations on M3UA inspection.

  • NAT is not supported for IP addresses that are embedded in M3UA data.

  • M3UA strict application server process (ASP) state validation depends on SCTP stateful inspection. Do not implement SCTP state bypass and M3UA strict ASP validation on the same traffic.

  • Strict ASP state checking is required if you want stateful failover or if you want to operate within a cluster. However, strict ASP state checking works in Override mode only, it does not work if you are running in Loadsharing or Broadcast mode (per RFC 4666). The inspection assumes there is one and only one ASP per endpoint.

RADIUS Accounting Inspection Overview

The purpose of RADIUS accounting inspection is to prevent over-billing attacks on GPRS networks that use RADIUS servers. Although you do not need the Carrier license to implement RADIUS accounting inspection, it has no purpose unless you are implementing GTP inspection and you have a GPRS setup.

The over-billing attack in GPRS networks results in consumers being billed for services that they have not used. In this case, a malicious attacker sets up a connection to a server and obtains an IP address from the SGSN. When the attacker ends the call, the malicious server will still send packets to it, which gets dropped by the GGSN, but the connection from the server remains active. The IP address assigned to the malicious attacker gets released and reassigned to a legitimate user who will then get billed for services that the attacker will use.

RADIUS accounting inspection prevents this type of attack by ensuring the traffic seen by the GGSN is legitimate. With the RADIUS accounting feature properly configured, the ASA tears down a connection based on matching the Framed IP attribute in the Radius Accounting Request Start message with the Radius Accounting Request Stop message. When the Stop message is seen with the matching IP address in the Framed IP attribute, the ASA looks for all connections with the source matching the IP address.

You have the option to configure a secret pre-shared key with the RADIUS server so the ASA can validate the message. If the shared secret is not configured, the ASA will only check that the source IP address is one of the configured addresses allowed to send the RADIUS messages.


Note

When using RADIUS accounting inspection with GPRS enabled, the ASA checks for the 3GPP-Session-Stop-Indicator in the Accounting Request STOP messages to properly handle secondary PDP contexts. Specifically, the ASA requires that the Accounting Request STOP messages include the 3GPP-SGSN-Address attribute before it will terminate the user sessions and all associated connections. Some third-party GGSNs might not send this attribute by default.


Licensing for Mobile Network Protocol Inspection

Inspection of the following protocols requires the license listed in the table below.

  • GTP

  • SCTP.

  • Diameter

  • M3UA

Model

License Requirement

  • ASA 5525-X

  • ASA 5545-X

  • ASA 5555-X

  • ASA 5585-X

  • ASASM

Carrier license

ASAv (all models)

Carrier license (enabled by default)

ASA on the Firepower 4100

Carrier license

ASA on the Firepower 9300

Carrier license

All other models

The Carrier license is not available on other models. You cannot inspect these protocols.

Defaults for GTP Inspection

GTP inspection is not enabled by default. However, if you enable it without specifying your own inspection map, a default map is used that provides the following processing. You need to configure a map only if you want different values.

  • Errors are not permitted.

  • The maximum number of requests is 200.

  • The maximum number of tunnels is 500. This is equivalent to the number of PDP contexts (endpoints).

  • The GTP endpoint timeout is 30 minutes. Endpoints include GSNs (GTPv0,1) and SGW/PGW (GTPv2).

  • The PDP context timeout is 30 minutes. In GTPv2, this is the bearer context timeout.

  • The request timeout is 1 minute.

  • The signaling timeout is 30 minutes.

  • The tunneling timeout is 1 hour.

  • The T3 response timeout is 20 seconds.

  • Unknown message IDs are allowed. You can configure match message v1/v2 id range commands to drop and log any commands that you do not support or want to allow. Messages are considered unknown if they are either undefined or are defined in GTP releases that the system does not support.

Configure Mobile Network Inspection

Inspections for protocols used in mobile networks are not enabled by default. You must configure them if you want to support mobile networks.

Procedure


Step 1

(Optional.) Configure a GTP Inspection Policy Map.

Step 2

(Optional.) Configure an SCTP Inspection Policy Map.

Step 3

(Optional.) Configure a Diameter Inspection Policy Map.

If you want to filter on attribute-value pairs (AVP) that are not yet supported in the software, you can create custom AVP for use in the Diameter inspection policy map. See Create a Custom Diameter Attribute-Value Pair (AVP).

Step 4

(Optional.) If you want to inspect encrypted Diameter TCP/TLS traffic, create the required TLS proxy as described in Inspecting Encrypted Diameter Sessions

Step 5

(Optional.) Configure an M3UA Inspection Policy Map

Step 6

Configure the Mobile Network Inspection Service Policy.

Step 7

(Optional.) Configure RADIUS Accounting Inspection.

RADIUS accounting inspection protects against over-billing attacks.


Configure a GTP Inspection Policy Map

If you want to enforce additional parameters on GTP traffic, and the default map does not meet your needs, create and configure a GTP map.

Before you begin

Some traffic matching options use regular expressions for matching purposes. If you intend to use one of those techniques, first create the regular expression or regular expression class map.

Procedure


Step 1

Choose Configuration > Firewall > Objects > Inspect Maps > GTP.

Step 2

Do one of the following:

  • Click Add to add a new map.

  • Select a map to view its contents. Click Customize to edit the map. The remainder of the procedure assumes you are customizing or adding a map.

Step 3

For new maps, enter a name (up to 40 characters) and description. When editing a map, you can change the description only.

Step 4

In the Security Level view of the GTP Inspect Map dialog box, view the current configuration of the map.

The view indicates whether the map uses default values or if you have customized it. If you need to customize the settings further, click Details, and continue with the procedure.

Tip 

The IMSI Prefix Filtering button is a shortcut to configure IMSI prefix filtering, which is explained later in this procedure.

Step 5

Click the Permit Parameters tab and configure the desired options.

  • Permit Response—When the ASA performs GTP inspection, by default the ASA drops GTP responses from GSNs or PGWs that were not specified in the GTP request. This situation occurs when you use load-balancing among a pool of GSN/PGW endpoints to provide efficiency and scalability of GPRS.

    To configure GSN/PGW pooling and thus support load balancing, create a network object group that specifies the GSN/PGW endpoints and select this as a “From Object Group.” Likewise, create a network object group for the SGSN/SGW and select it as the “To Object Group.” If the GSN/PGW responding belongs to the same object group as the GSN/PGW that the GTP request was sent to and if the SGSN/SGW is in an object group that the responding GSN/PGW is permitted to send a GTP response to, the ASA permits the response.

    The network object group can identify the endpoints by host address or by the subnet that contains them.

  • Permit Errors—Whether to allow packets that are invalid or that encountered an error during inspection to be sent through the ASA instead of being dropped.

Step 6

Click the General Parameters tab and configure the desired options:

  • Maximum Number of Requests—The maximum number of GTP requests that will be queued waiting for a response.

  • Maximum Number of Tunnels—The maximum number of active GTP tunnels allowed. This is equivalent to the number of PDP contexts or endpoints. The default is 500. New requests will be dropped once the maximum number of tunnels is reached.

  • Enforce Timeout—Whether to enforce idle timeouts for the following behaviors. Timeouts are in hh:mm:ss format.

    • Endpoint—The maximum period of inactivity before a GTP endpoint is removed.

    • PDP-Context—The maximum period of inactivity before removing the PDP Context for a GTP session. In GTPv2, this is the bearer context.

    • Request—The maximum period of inactivity after which a request is removed from the request queue. Any subsequent responses to a dropped request will also be dropped.

    • Signaling—The maximum period of inactivity before GTP signaling is removed.

    • T3-Response timeout—The maximum wait time for a response before removing the connection.

    • Tunnel—The maximum period of inactivity for the GTP tunnel before it is torn down.

Step 7

Click the IMSI Prefix Filtering tab and configure IMSI prefix filtering if desired.

By default, the security appliance does not check for valid Mobile Country Code (MCC)/Mobile Network Code (MNC) combinations. If you configure IMSI prefix filtering, the MCC and MNC in the IMSI of the received packet is compared with the configured MCC/MNC combinations and is dropped if it does not match.

The Mobile Country Code is a non-zero, three-digit value; add zeros as a prefix for one- or two-digit values. The Mobile Network Code is a two- or three-digit value.

Add all permitted MCC and MNC combinations. By default, the ASA does not check the validity of MNC and MCC combinations, so you must verify the validity of the combinations configured. To find more information about MCC and MNC codes, see the ITU E.212 recommendation, Identification Plan for Land Mobile Stations.

Step 8

Click the Inspections tab and define the specific inspections you want to implement based on traffic characteristics.

  1. Do any of the following:

    • Click Add to add a new criterion.

    • Select an existing criterion and click Edit.

  2. Choose the match type for the criteria: Match (traffic must match the criterion) or No Match (traffic must not match the criterion). Then, configure the criterion:

    • Access Point Name—Matches the access point name against the specified regular expression or regular expression class. By default, all messages with valid access point names are inspected and any name is allowed.

    • Message ID—Matches the message ID, from 1 to 255. You can specify one value or a range of values. You must specify whether the message is for GTPv1 (which includes GTPv0) or GTPv2. By default, all valid message IDs are allowed.

    • Message Length—Matches messages where the length of the UDP payload is between the specified minimum and maximum length.

    • Version—Matches the GTP version, from 0 to 255. You can specify one value or a range of values. By default all GTP versions are allowed.

    • MSISDN—Matches the Mobile Station International Subscriber Directory Number (MSISDN) information element in the Create PDP Context request, Create session request, and Modify Bearer Response messages against the specified regular expression or regular expression class. The regular expression can identify a specific MSISDN, or a range of MSISDNs based on the first x number of digits. MSISDN filtering is supported for GTPv1 and GTPv2 only.

    • Selection Mode—Matches the Selection Mode information element in the Create PDP Context request. The selection mode specifies the origin of the Access Point Name (APN) in the message, and can be one of the following. Selection Mode filtering is supported for GTPv1 and GTPv2 only.

      • 0—Verified. The APN was provided by the mobile station or network, and the subscription is verified.

      • 1—Mobile Station. The APN was provided by the mobile station, and the subscription is not verified.

      • 2—Network. The APN was provided by the network, and the subscription is not verified.

      • 3—Reserved, not used.

  3. For Message ID matching, choose whether to drop the packet or to apply a rate limit in packets per second. The action for all other matches is to drop the packet. For all matches, you can choose whether to enable logging.

  4. Click OK to add the inspection. Repeat the process as needed.

Step 9

Click the Anti-Replay Protection tab and configure the anti-replay options.

  • Enable Data Packet Replay Window—Whether to enable anti-replay by specifying a sliding window for GTP-U messages. The size of the sliding window is in number of messages and can be 128, 256, 512, or 1024. As valid messages appear, the window moves to the new sequence numbers. Sequence numbers are in the range 0-65535, wrapping when they reach the maximum, and they are unique per PDP context. Messages are considered valid if their sequence numbers are within the window. Anti-replay helps prevent session hijacking or DoS attacks, which can occur when a hacker captures GTP data packets and replays them.

Step 10

Click the User-Spoofing tab and configure the anti-spoofing options.

  • GTP Header Check—Whether to check that the inner payload of a GTP data packet is a valid IP packet, and drop the packet if it has a non-IP header. You must select this option to implement anti-spoofing.

  • Anti-Spoofing—Whether to check that the mobile user IP address in the IP header of the inner payload matches the IP address assigned in GTP control messages such as Create Session Response, and drop the message if the IP addresses do not match. It is possible for hackers to pretend (spoof) that they are another customer by using another IP address than the one assigned through GTP-C. Anti-spoofing checks whether the GTP-U address used is actually the one which was assigned using GTP-C. This check supports IPv4, IPv6, and IPv4v6 PDN Types.

    If the mobile station gets its address using DHCP, the end-user IP address in GTPv2 is 0.0.0.0 (IPv4) or prefix::0 (IPv6), so in this case, the system updates the end-user IP address with the first IP address found in the inner packets. You can change the default behavior for DHCP-obtained addresses using the following keywords:

    • GTPV2-DHCP-ByPass—Do not update the 0.0.0.0 or prefix::0 address. Instead, allow packets where the end-user IP address is 0.0.0.0 or prefix::0. This option bypasses the anti-spoofing check when DHCP is used to obtain the IP address.

    • GTPV2-DHCP-DROP—Do not update the 0.0.0.0 or prefix::0 address. Instead, drop all packets where the end-user IP address is 0.0.0.0 or prefix::0. This option prevents access for users that use DHCP to obtain the IP address.

Step 11

Click OK in the GTP Inspect Map dialog box.

You can now use the inspection map in a GTP inspection service policy.


What to do next

You can now configure an inspection policy to use the map. See Configure the Mobile Network Inspection Service Policy.

Configure an SCTP Inspection Policy Map

To apply alternative actions to SCTP traffic based on the application-specific payload protocol identifier (PPID), such as rate limiting, create an SCTP inspection policy map to be used by the service policy.


Note

PPIDs are in data chunks, and a given packet can have multiple data chunks or even a control chunk. If a packet includes a control chunk or multiple data chunks, the packet will not be dropped even if the assigned action is drop. For example, if you configure an SCTP inspection policy map to drop PPID 26, and a PPID 26 data chunk is combined in a packet with a Diameter PPID data chunk, that packet will not be dropped.


Procedure


Step 1

Choose Configuration > Firewall > Objects > Inspect Maps > SCTP.

Step 2

Do one of the following:

  • Click Add to add a new map.

  • Select a map and click Edit.

Step 3

For new maps, enter a name (up to 40 characters) and description. When editing a map, you can change the description only.

Step 4

Drop, rate limit, or log traffic based on the PPID in SCTP data chunks.

  1. Do any of the following:

    • Click Add to add a new criterion.

    • Select an existing criterion and click Edit.

  2. Choose the match type for the criteria: Match (traffic must match the PPID) or No Match (traffic must not match the PPID).

    For example, if you select No Match is on the Diameter PPID, then all PPIDs except Diameter are excluded from the class map.

  3. Choose the Minimum Payload PID and optionally, the Maximum Payload PID to match.

    You can enter PPIDs by name or number (0-4294967295). Click the ... button in each field to select from a list of PPIDs. If you select a maximum PPID, then the match applies to the range of PPIDs

    You can find the current list of SCTP PPIDs at http://www.iana.org/assignments/sctp-parameters/sctp-parameters.xhtml#sctp-parameters-25.

  4. Choose whether to drop (and log), log, or rate limit (in kilobits per second, kbps) the matching packets.

  5. Click OK to add the inspection. Repeat the process as needed.

Step 5

Click OK in the SCTP Inspect Map dialog box.

You can now use the inspection map in an SCTP inspection service policy.


What to do next

You can now configure an inspection policy to use the map. See Configure the Mobile Network Inspection Service Policy.

Configure a Diameter Inspection Policy Map

You can create a Diameter inspection policy map to filter on various Diameter protocol elements. You can then selectively drop or log connections.

To configure Diameter message filtering, you must have a good knowledge of these protocol elements as they are defined in RFCs and technical specifications. For example, the IETF has a list of registered applications, command codes, and attribute-value pairs at http://www.iana.org/assignments/aaa-parameters/aaa-parameters.xhtml, although Diameter inspection does not support all listed items. See the 3GPP web site for their technical specifications.

You can optionally create a Diameter inspection class map to define the message filtering criteria for Diameter inspection. The other option is to define the filtering criteria directly in the Diameter inspection policy map. The difference between creating a class map and defining the filtering criteria directly in the inspection map is that you can create more complex match criteria and you can reuse class maps. Although this procedure explains inspection maps, the matching criteria used in class maps are the same as those explained in the step relating to the Inspection tab. You can configure Diameter class maps by selecting Configuration > Firewall > Objects > Class Maps > Diameter, or by creating them while configuring the inspection map.


Tip

You can configure inspection maps while creating service policies, in addition to the procedure explained below. The contents of the map are the same regardless of how you create it.


Before you begin

Some traffic matching options use regular expressions for matching purposes. If you intend to use one of those techniques, first create the regular expression or regular expression class map.

Procedure


Step 1

Choose Configuration > Firewall > Objects > Inspect Maps > Diameter.

Step 2

Do one of the following:

  • Click Add to add a new map.

  • Select a map and click Edit. to view its contents.

Step 3

For new maps, enter a name (up to 40 characters) and description. When editing a map, you can change the description only.

Step 4

Click the Parameters tab and choose the desired options. whether you want to log messages that include unsupported Diameter elements.

  • Unsupported Parameters—Whether you want to log messages that include unsupported Diameter elements. You can log unsupported Application ID, Command Code, or Attribute Value Pair elements.
  • Strict Diameter Validation Parameters—Enables strict Diameter protocol conformance to RFC 6733. By default, inspection ensures that Diameter frames comply with the RFC. You can add session-related message validation and state machine validation.
Step 5

Click the Inspections tab and define the specific inspections you want to implement based on traffic characteristics.

You can define traffic matching criteria based on Diameter class maps, by configuring matches directly in the inspection map, or both.

  1. Do any of the following:

    • Click Add to add a new criterion.

    • Select an existing criterion and click Edit.

  2. Choose Single Match to define the criterion directly, or Multiple Match, in which case you select the Diameter class map that defines the criteria.

  3. If you are defining the criterion here, choose the match type for the criteria: Match (traffic must match the criterion) or No Match (traffic must not match the criterion). Then, configure the criterion as follows:

    • Application ID—Enter the Diameter application name or number (0-4294967295). If there is a range of consecutively-numbered applications that you want to match, you can include a second ID. You can define the range by application name or number, and it applies to all the numbers between the first and second IDs.

      These applications are registered with the IANA. Following are the core supported applications, but you can filter on other applications.

      • 3gpp-rx-ts29214 (16777236)

      • 3gpp-s6a (16777251)

      • 3gpp-s9 (16777267)

      • common-message (0). This is the base Diameter protocol.

    • Command Code—Enter the Diameter command code name or number (0-4294967295). If there is a range of consecutively-numbered command codes that you want to match, you can include a second code. You can define the range by command code name or number, and it applies to all the numbers between the first and second codes.

      For example, to match the Capability Exchange Request/Answer command code, CER/CEA, enter cer-cea.

    • Attribute Value Pair—You can match the AVP by attribute only, a range of AVPs, or an AVP based on the value of the attribute. For the AVP Begin Value, you can specify the name of a custom AVP or one that is registered in RFCs or 3GPP technical specifications and is directly supported in the software. Click the ... button in the field to pick from a list.

      If you want to match a range of AVP, specify the AVP End Value by number only. If you want to match an AVP by its value, you cannot specify a second code.

      You can further refine the match by specifying the optional Vendor ID, from 0-4294967295. For example, the 3GPP vendor ID is 10415, the IETF is 0.

      You can configure value-matching only if the data type of the AVP is supported. For example, you can specify an IP address for AVP that have the address data type. The list of AVP shows the data type for each. How you specify the value differs based on the AVP data type:

      • Diameter Identity, Diameter URI, Octet String—Select the regular expression or regular expression class objects to match these data types.

      • Address—Specify the IPv4 or IPv6 address to match. For example, 10.100.10.10 or 2001:DB8::0DB8:800:200C:417A.

      • Time—Specify the start and end dates and time. Both are required. Time is in 24-hour format.

      • Numeric—Specify a range of numbers. The valid number range depends on the data type:

        • Integer32: -2147483647 to 2147483647

        • Integer64: -9223372036854775807 to 9223372036854775807

        • Unsigned32: 0 to 4294967295

        • Unsigned64: 0 to 18446744073709551615

        • Float32: decimal point representation with 8 digit precision

        • Float64: decimal point representation with 16 digit precision

  4. Choose the action to take for matching traffic: drop packet, drop connection, or log.

  5. Click OK to add the inspection. Repeat the process as needed.

Step 6

Click OK in the Diameter Inspect Map dialog box.

You can now use the inspection map in a Diameter inspection service policy.


What to do next

You can now configure an inspection policy to use the map. See Configure the Mobile Network Inspection Service Policy.

Create a Custom Diameter Attribute-Value Pair (AVP)

As new attribute-value pairs (AVP) are defined and registered, you can create custom Diameter AVP to define them and use them in your Diameter inspection policy map. You would get the information you need to create the AVP from the RFC or other source that defines the AVP.

Create custom AVP only if you want to use them in a Diameter inspection policy map or class map for AVP matching.

Procedure


Step 1

Select Configuration > Firewall > Objects > Inspect Maps > Diameter AVP.

Step 2

Click Add to create a new AVP.

When you edit an AVP, you can change the description only.

Step 3

Configure the following options:

  • Name—The name of the custom AVP you are creating, up to 32 characters. You would refer to this name in a Diameter inspection policy map or class map when defining an attribute-value pair match.

  • Custom Code—The custom AVP code value, from 256-4294967295. You cannot enter a code and vendor ID combination that is already defined in the system.

  • Data Type—The data type of the AVP. You can define AVP of the following types. If the new AVP is of a different type, you cannot create a custom AVP for it.

    • Address (for IP addresses)

    • Diameter identity

    • Diameter uniform resource identifier (URI)

    • 32-bit floating point number

    • 64-bit floating point number

    • 32-bit integer

    • 64-bit integer

    • Octet string

    • Time

    • 32-bit unsigned integer

    • 64-bit unsigned integer

  • Vendor ID—(Optional.) The ID number of the vendor who defined the AVP, from 0-4294967295. For example, the 3GPP vendor ID is 10415, the IETF is 0.

  • Description—(Optional.) A description of the AVP, up to 80 characters.

Step 4

Click OK.


Inspecting Encrypted Diameter Sessions

If a Diameter application uses encrypted data over TCP, inspection cannot see inside the packets to implement your message filtering rules. Thus, if you create filtering rules, and you want them to also apply to encrypted TCP traffic, you must configure a TLS proxy. You also need a proxy if you want strict protocol enforcement on encrypted traffic. This configuration does not apply to SCTP/DTLS traffic.

The TLS proxy acts as a man-in-the-middle. It decrypts traffic, inspects it, then encrypts it again and sends it to the intended destination. Thus, both sides of the connection, the Diameter server and Diameter client, must trust the ASA, and all parties must have the required certificates. You must have a good understanding of digital certificates to implement TLS proxy. Please read the chapter on digital certificates in the ASA general configuration guide.

The following illustration shows the relationship among the Diameter client and server, and the ASA, and the certification requirements to establish trust. In this model, a Diameter client is an MME (Mobility Management Entity), not an end user. The CA certificate on each side of a link is the one used to sign the certificate on the other side of the link. For example, the ASA proxy TLS server CA certificate is the one used to sign the Diameter/TLS client certificate.

Figure 2. Diameter TLS Inspection

Relationship between ASA and Diameter client/server.

1

Diameter TLS client (MME)

  • Client identity certificate

  • CA certificate used to sign the ASA TLS proxy server's identity certificate

2

ASA proxy TLS server

  • Server identity certificate

  • CA certificate used to sign the Diameter TLS client's identity certificate

3

ASA proxy TLS client

  • Client identity (static or LDC) certificate

  • CA certificate used to sign the Diameter TLS server identity certificate

4

Diameter TLS server (full proxy)

  • Server identity certificate

  • CA certificate used to sign the ASA proxy TLS client's identity certificate

5

Diameter TCP server (TLS offload).

You have the following options for configuring TLS proxy for Diameter inspection:

  • Full TLS proxy—Encrypt traffic between the ASA and Diameter clients and the ASA and Diameter server. You have the following options for establishing the trust relationship with the TLS server:

    • Use a static proxy client trustpoint. The ASA presents the same certificate for every Diameter client when communicating with the Diameter server. Because all clients look the same, the Diameter server cannot provide differential services per client. On the other hand, this option is faster than the LDC method.

    • Use local dynamic certificates (LDC). With this option, the ASA presents unique certificates per Diameter client when communicating with the Diameter server. The LDC retains all fields from the received client identity certificate except its public key and a new signature from the ASA. This method gives the Diameter server better visibility into client traffic, which makes it possible to provide differential services based on client certificate characteristics.

  • TLS offload—Encrypt traffic between the ASA and Diameter client, but use a clear-text connection between the ASA and Diameter server. This option is viable if the Diameter server is in the same data center as the ASA, where you are certain that the traffic between the devices will not leave the protected area. Using TLS offload can improve performance, because it reduces the amount of encryption processing required. It should be the fastest of the options. The Diameter server can apply differential services based on client IP address only.

All three options use the same configuration for the trust relationship between the ASA and Diameter clients.


Note

TLS proxy uses TLSv1.0 - 1.2. You can configure the TLS version and the cipher suite.


The following topics explain how to configure TLS proxy for Diameter inspection.

Configure Server Trust Relationship with Diameter Clients

The ASA acts as a TLS proxy server in relation to the Diameter clients. To establish the mutual trust relationship:

  • You need to import the Certificate Authority (CA) certificate used to sign the ASA’s server certificate into the Diameter client. This might be in the client’s CA certificate store or some other location that the client uses. Consult the client documentation for exact details on certificate usage.

  • You need to import the CA certificate used to sign the Diameter TLS client’s certificate so the ASA can trust the client.

The following procedure explains how to import the CA certificate used to sign the Diameter client’s certificate, and import an identity certificate to use for the ASA TLS proxy server. Instead of importing an identity certificate, you could create a self-signed certificate on the ASA. Alternatively, you can import these certificates when you create the TLS proxy.

Procedure

Step 1

Import the CA certificate that is used to sign the Diameter client’s certificate into an ASA trustpoint.

This step allows the ASA to trust the Diameter clients.

  1. Select Configuration > Firewall > Advanced > Certificate Management > CA Certificates.

  2. Click Add and enter a name for the trustpoint. For example, diameter-clients.

  3. Add the certificate.

    You can import the certificate from a file, paste it in PEM format, or use SCEP to import it.

  4. Click Install Certificate.

Step 2

Import the certificate and create a trustpoint for the ASA proxy server’s identity certificate and keypair.

This step allows the Diameter clients to trust the ASA.

  1. Select Configuration > Firewall > Advanced > Certificate Management > Identity Certificates.

  2. Click Add and enter a name for the trustpoint. For example, tls-proxy-server-tp.

  3. Select Import the identity certificate from a file, enter the decryption passphrase, and select the file (in pkcs12 format).

    Alternatively, you can create a new certificate.

  4. Click Add Certificate.


Configure Full TLS Proxy with Static Client Certificate for Diameter Inspection

If the Diameter server can accept the same certificate for all clients, you can set up a static client certificate for the ASA to use when communicating with the Diameter server.

With this configuration, you need to establish the mutual trust relationship between the ASA and clients (as explained in Configure Server Trust Relationship with Diameter Clients), and the ASA and Diameter server. Following are the ASA and Diameter server trust requirements.

  • You need to import the CA certificate used to sign the Diameter Server's identity certificate so the ASA can validate the server's identity certificate during the TLS handshake.

  • You need to import the client certificate, one that the Diameter server also trusts. If the Diameter server does not already trust the certificate, import the CA certificate used to sign it into the server. Consult the Diameter server’s documentation for details.

Procedure

Step 1

Select Configuration > Firewall > Unified Communications > TLS Proxy.

Step 2

Click Add.

Step 3

Give the TLS proxy a name, for example, diameter-tls-static-proxy. Click Next.

Step 4

Select the TLS server proxy identity certificate that you added in Configure Server Trust Relationship with Diameter Clients. Click Next.

If you have not already created the identity certificate, you can click Manage to add it. You can also install the Diameter client’s CA certificate by clicking Install TLS Server’s Certificate.

Optionally, you can define the security algorithms (ciphers) that the server can use by moving them from the available algorithms to the active algorithms list. If you do not specify ciphers, the default system ciphers are used.

Note 

For testing purposes, or if you are certain that you can trust the Diameter clients, you can skip this step and deselect Enable client authentication during TLS Proxy handshake in the TLS proxy configuration.

Step 5

Select Specify the proxy certificate for TLS client and do the following:

  1. Select the certificate for the ASA TLS proxy client.

    If you have not already added the certificate, click Manage and add it now.

  2. If you have not already added the CA certificate that was used to sign the Diameter server’s certificate, click Install TLS Client’s Certificate and add it.

  3. (Optional.) Define the security algorithms (ciphers) that the client can use by moving them from the available algorithms to the active algorithms list.

    If you do not define the ciphers the TLS proxy can use, the proxy uses the global cipher suite defined by the Configuration > Device Management > Advanced > SSL Settings encryption settings. By default, the global cipher level is medium, which means all ciphers are available except for NULL-SHA, DES-CBC-SHA, and RC4-MD5. Specify the TLS proxy-specific ciphers only if you want to use a different suite than the one generally available on the ASA.

  4. Click Next.

Step 6

Click Finish, then click Apply.


What to do next

You can now use the TLS proxy in Diameter inspection. See Configure the Mobile Network Inspection Service Policy.

Configure Full TLS Proxy with Local Dynamic Certificates for Diameter Inspection

If the Diameter server needs unique certificates for each client, you can configure the ASA to generate local dynamic certificates (LDC). These certificates exist for the duration of the client’s connection and are then destroyed.

With this configuration, you need to establish the mutual trust relationship between the ASA and clients (as explained in Configure Server Trust Relationship with Diameter Clients), and the ASA and Diameter server. The configuration is similar to the one described in Configure Full TLS Proxy with Static Client Certificate for Diameter Inspection, except instead of importing a Diameter client certificate, you set up the LDC on the ASA. Following are the ASA and Diameter server trust requirements.

  • You need to import the CA certificate used to sign the Diameter Server's identity certificate so the ASA can validate the server's identity certificate during the TLS handshake.

  • You need to create the LDC trustpoint. You need to export the LDC server’s CA certificate and import it into the Diameter server. The export step is explained below. Consult the Diameter server’s documentation for information on importing certificates.

Procedure

Step 1

Select Configuration > Firewall > Unified Communications > TLS Proxy.

Step 2

Click Add.

Step 3

Give the TLS proxy a name, for example, diameter-tls-ldc-proxy.

Step 4

Select the TLS server proxy identity certificate that you added in Configure Server Trust Relationship with Diameter Clients. Click Next.

If you have not already created the identity certificate, you can click Manage to add it. You can also install the Diameter client’s CA certificate by clicking Install TLS Server’s Certificate.

Optionally, you can define the security algorithms (ciphers) that the server can use by moving them from the available algorithms to the active algorithms list. If you do not specify ciphers, the default system ciphers are used.

Note 

For testing purposes, or if you are certain that you can trust the Diameter clients, you can skip this step and deselect Enable client authentication during TLS Proxy handshake in the TLS proxy configuration.

Step 5

Select Specify the internal Certificate Authority to sign for local dynamic certificates and do the following (ignore any text related to IP phones).

This procedure assumes you are creating a new certificate and key. If you have already created the needed certificate and key, select them and move to the security algorithms step.

  1. For Local Dynamic Certificate Key Pair, click New. (You might need to resize the dialog box to see the button.)

  2. Create a general purpose RSA certificate with a new key pair name, such as ldc-signer-key. Click Generate Now to create the key.

    You are returned to the Manage Identity Certificates dialog box.

  3. Select Certificate and click Manage to create the certificate and key for the ASA TLS proxy client.

  4. Click Add in the Manage Identity Certificates dialog box.

  5. Give the trustpoint a name, such as ldc-server.

  6. Select Add a new identity certificate.

  7. For Key Pair, select the same key you created for the local dynamic certificate key.

  8. For Certificate Subnet DN, select the Distinguished Name attributes that you need.

    The device’s common name is the default. Check whether the Diameter application has specific requirements for the subject name.

  9. Select Generate self-signed certificate. This is required.

  10. Select Act as a local certificate authority and issue dynamic certificates to TLS Proxy. This option make this certificate an LDC issuer.

  11. Click Add Certificate.

    You are returned to the Manage Identity Certificates dialog box.

  12. Select the certificate you just created and click Export.

    You need to export the certificate so that you can import it into the Diameter server. Specify a file name and PEM format, and click Export Certificate.

    You are returned to the Manage Identity Certificates dialog box.

  13. With the certificate still selected, click OK.

    You are returned to the TLS Proxy wizard. If the certificate is not selected in the Certificate field, select it now.

  14. (Optional.) Define the security algorithms (ciphers) that the client can use by moving them from the available algorithms to the active algorithms list.

    If you do not define the ciphers the TLS proxy can use, the proxy uses the global cipher suite defined by the Configuration > Device Management > Advanced > SSL Settings encryption settings. By default, the global cipher level is medium, which means all ciphers are available except for NULL-SHA, DES-CBC-SHA, and RC4-MD5. Specify the TLS proxy-specific ciphers only if you want to use a different suite than the one generally available on the ASA.

  15. Click Next.

Step 6

Click Finish, then click Apply.

Step 7

You can now import the LDC CA certificate into the Diameter server. Consult the Diameter server’s documentation for the procedure. Note that the data is in Base64 format. If your server requires binary or DER format, you will need to use OpenSSL tools to convert formats.


What to do next

You can now use the TLS proxy in Diameter inspection. See Configure the Mobile Network Inspection Service Policy.

Configure TLS Proxy with TLS Offload for Diameter Inspection

If you are certain the network path between the ASA and Diameter server is secure, you can avoid the performance cost of encrypting data between the ASA and server. With TLS offload, the TLS proxy encrypts/decrypts sessions between the Diameter client and the ASA, but uses clear text with the Diameter server.

With this configuration, you need to establish the mutual trust relationship between the ASA and clients only, which simplifies the configuration. Before doing the following procedure, complete the steps in Configure Server Trust Relationship with Diameter Clients.

Procedure

Step 1

Select Configuration > Firewall > Unified Communications > TLS Proxy.

Step 2

Click Add.

Step 3

Give the TLS proxy a name, for example, diameter-tls-offload-proxy.

Step 4

Select the TLS server proxy identity certificate that you added in Configure Server Trust Relationship with Diameter Clients. Click Next.

If you have not already created the identity certificate, you can click Manage to add it. You can also install the Diameter client’s CA certificate by clicking Install TLS Server’s Certificate.

Optionally, you can define the security algorithms (ciphers) that the server can use by moving them from the available algorithms to the active algorithms list. If you do not specify ciphers, the default system ciphers are used.

Note 

For testing purposes, or if you are certain that you can trust the Diameter clients, you can skip this step and deselect Enable client authentication during TLS Proxy handshake in the TLS proxy configuration.

Step 5

Select Configure the proxy client to use clear text to communicate with the remote TCP client, and click Next.

Step 6

Click Finish, then click Apply.

Step 7

Because the Diameter ports differ for TCP and TLS, configure a NAT rule to translate the TCP port to the TLS port for traffic going from the Diameter server to the client.

Create an object NAT rule for each Diameter server.

  1. Select Configuration > Firewall > NAT.

  2. Click Add > Object NAT Rule.

  3. Configure the basic properties:

    • Name—The object name, for example, DiameterServerA.

    • Type (for the object)—Select Host.

    • IP Version—IPv4 or IPv6 as appropriate.

    • IP Address—The IP address of the Diameter server, for example, 10.100.10.10.

    • Add Automatic Address Translation—Ensure you select this option.

    • Type (for the NAT rule)—Select Static.

    • Translated Addr—The IP address of the Diameter server. This would be the same as the IP Address for the object, for example, 10.100.10.10.

  4. Click Advanced and configure the following Interface and Service options:

    • Source Interface—Select the interface that connects to the Diameter server.

    • Destination Interface—Select the interface that connects to the Diameter client.

    • Protocol—Select TCP.

    • Real Port—Enter 3868, which is the default Diameter TCP port number.

    • Mapped Port—Enter 5868, which is the default Diameter TLS port number.

  5. Click OK, then click OK again in the Add Network Object dialog box.


What to do next

You can now use the TLS proxy in Diameter inspection. See Configure the Mobile Network Inspection Service Policy.

Configure an M3UA Inspection Policy Map

Use an M3UA inspection policy map to configure access control based on point codes. You can also drop and rate limit messages by class and type.

The default point code format is ITU. If you use a different format, specify the required format in the policy map.

If you do not want to apply policy based on point code or message class, you do not need to configure an M3UA policy map. You can enable inspection without a map.

Procedure


Step 1

Choose Configuration > Firewall > Objects > Inspect Maps > M3UA.

Step 2

Do one of the following:

  • Click Add to add a new map.

  • Select a map and click Edit to edit the map.

Step 3

For new maps, enter a name (up to 40 characters) and description. When editing a map, you can change the description only.

Step 4

Click the Parameters tab and configure the desired options:

  • SS7—The variant of SS7 used in your network: ITU, ANSI, Japan, China. This option determines the valid format for point codes. After you configure the option and deploy an M3UA policy, you cannot change it unless you first remove the policy. The default variant is ITU.

  • Enable M3UA Application Server Process (ASP) state validation—Whether to perform strict application server process (ASP) state validation. The system maintains the ASP states of M3UA sessions and allows or drops ASP messages based on the validation result. If you do not enable strict ASP state validation, all ASP messages are forwarded uninspected. Strict ASP state checking is required if you want stateful failover or if you want to operate within a cluster. However, strict ASP state checking works in Override mode only, it does not work if you are running in Loadsharing or Broadcast mode (per RFC 4666). The inspection assumes there is one and only one ASP per endpoint.

  • Enforce Timeout > Endpoint—The idle timeout to remove statistics for an M3UA endpoint, in hh:mm:ss format. To have no timeout, specify 0. The default is 30 minutes (00:30:00).

  • Enforce Timeout > Session—The idle timeout to remove an M3UA session if you enable strict ASP state validation, in hh:mm:ss format. To have no timeout, specify 0. The default is 30 minutes (00:30:00). Disabling this timeout can prevent the system from removing stale sessions.

  • Message Tag Validation—Whether to check and validate the content of certain fields for the specified message type. Messages that fail validation are dropped. Validation differs by message type. Select the messages you want to validate.

    • Destination User Part Unavailable (DUPU)—The User/Cause field must be present, and it must contain only valid cause and user codes.

    • Error—All mandatory fields must be present and contain only allowed values. Each error message must contain the required fields for that error code.

    • Notify—The status type and status information fields must contain allowed values only.

Step 5

Click the Inspections tab and define the specific inspections you want to implement based on traffic characteristics.

  1. Do any of the following:

    • Click Add to add a new criterion.

    • Select an existing criterion and click Edit.

  2. Choose the match type for the criteria: Match (traffic must match the criterion) or No Match (traffic must not match the criterion). Then, configure the criterion:

    • Class ID—Matches the M3UA message class and type. The following table lists the possible values. Consult M3UA RFCs and documentation for detailed information about these messages.

      M3UA Message Class

      Message ID Type

      0 (Management Messages)

      0-1

      1 (Transfer Messages)

      1

      2 (SS7 Signaling Network Management Messages)

      1-6

      3 (ASP State Maintenance Messages)

      1-6

      4 (ASP Traffic Maintenance Messages)

      1-4

      9 (Routing Key Management Messages)

      1-4

    • OPC—Matches the originating point code, that is, the traffic source. Point code is in zone-region-sp format, where the possible values for each element depend on the SS7 variant:

      • ITU —Point codes are 14 bit in 3-8-3 format. The value ranges are [0-7]-[0-255]-[0-7].

      • ANSI —Point codes are 24 bit in 8-8-8 format. The value ranges are [0-255]-[0-255]-[0-255].

      • Japan —Point codes are 16 bit in 5-4-7 format. The value ranges are [0-31]-[0-15]-[0-127].

      • China —Point codes are 24 bit in 8-8-8 format. The value ranges are [0-255]-[0-255]-[0-255].

    • DPC—Matches the destination point code. Point code is in zone-region-sp format, as explained for OPC.

    • Service Indicator—Matches the service indicator number, 0-15. Following are the available service indicators. Consult M3UA RFCs and documentation for detailed information about these service indicators.

      • 0—Signaling Network Management Messages

      • 1—Signaling Network Testing and Maintenance Messages

      • 2—Signaling Network Testing and Maintenance Special Messages

      • 3—SCCP

      • 4—Telephone User Part

      • 5—ISDN User Part

      • 6—Data User Part (call and circuit-related messages)

      • 7—Data User Part (facility registration and cancellation messages)

      • 8—Reserved for MTP Testing User Part

      • 9—Broadband ISDN User Part

      • 10—Satellite ISDN User Part

      • 11—Reserved

      • 12—AAL type 2 Signaling

      • 13—Bearer Independent Call Control

      • 14—Gateway Control Protocol

      • 15—Reserved

  3. For Class ID matching, choose whether to drop the packet or to apply a rate limit in packets per second. The action for all other matches is to drop the packet. For all matches, you can choose whether to enable logging.

  4. Click OK to add the inspection. Repeat the process as needed.

Step 6

Click OK in the M3UA Inspect Map dialog box.

You can now use the inspection map in an M3UA inspection service policy.


What to do next

You can now configure an inspection policy to use the map. See Configure the Mobile Network Inspection Service Policy.

Configure the Mobile Network Inspection Service Policy

Inspections for the protocols used in mobile networks are not enabled in the default inspection policy, so you must enable them if you need these inspections. You can simply edit the default global inspection policy to add these inspections. You can alternatively create a new service policy as desired, for example, an interface-specific policy.

Procedure


Step 1

Choose Configuration > Firewall > Service Policy, and open a rule.

  • To edit the default global policy, select the “inspection_default” rule in the Global folder and click Edit.

  • To create a new rule, click Add > Add Service Policy Rule. Proceed through the wizard to the Rules page.

  • If you have a mobile network inspection rule, or a rule to which you are adding these inspections, select it and click Edit.

Step 2

On the Rule Actions wizard page or tab, select the Protocol Inspection tab.

Step 3

(To change an in-use policy.) If you are editing any in-use policy to use a different inspection policy map, you must disable the inspections, and then re-enable them with the new inspection policy map name:

  1. Uncheck the relevant already-selected check boxes: GTP, SCTP, Diameter, M3UA.

  2. Click OK.

  3. Click Apply.

  4. Repeat these steps to return to the Protocol Inspections tab.

Step 4

Select the desired mobile network protocols: GTP, SCTP, Diameter, M3UA.

Step 5

If you want non-default inspection for one or more of these protocols, click Configure next to the options, and do the following:

  1. Choose whether to use the default map or to use an inspection policy map that you configured. You can create the map at this time.

  2. (Diameter only.) To enable Diameter inspection of encrypted messages, select Enable Encrypted Traffic Inspection, and select a TLS proxy to use for decryption.

    Note 

    If you specify a TLS proxy for Diameter inspection, and you apply NAT port redirection to Diameter server traffic (for example, redirect server traffic from port 5868 to 3868), configure inspection globally or on the ingress interface only. If you apply the inspection to the egress interface, NATed Diameter traffic bypasses inspection.

  3. Click OK in the Select Inspect Map dialog box.

Step 6

Click OK or Finish to save the service policy rule.


Configure RADIUS Accounting Inspection

RADIUS accounting inspection is not enabled by default. You must configure it if you want RADIUS accounting inspection.

Procedure


Step 1

Configure a RADIUS Accounting Inspection Policy Map.

Step 2

Configure the RADIUS Accounting Inspection Service Policy.


Configure a RADIUS Accounting Inspection Policy Map

You must create a RADIUS accounting inspection policy map to configure the attributes needed for the inspection.

Procedure

Step 1

Choose Configuration > Firewall > Objects > Inspect Maps > RADIUS Accounting.

Step 2

Do one of the following:

  • Click Add to add a new map.

  • Select a map and click Edit.

Step 3

For new maps, enter a name (up to 40 characters) and description. When editing a map, you can change the description only.

Step 4

Click the Host Parameters tab and add the IP addresses of each RADIUS server or GGSN.

You can optionally include a secret key so that the ASA can validate the message. Without the key, only the IP address is checked. The ASA receives a copy of the RADIUS accounting messages from these hosts.

Step 5

Click the Other Parameters tab and configure the desired options.

  • Send responses to the originator of the RADIUS accounting message—xxWhether to mask the banner from the ESMTP server.

  • Enforce user timeout—Whether to implement an idle timeout for users, and the timeout value. The default is one hour.

  • Enable detection of GPRS accounting—Whether to implement GPRS over-billing protection. The ASA checks for the 3GPP VSA 26-10415 attribute in the Accounting-Request Stop and Disconnect messages in order to properly handle secondary PDP contexts. If this attribute is present, then the ASA tears down all connections that have a source IP matching the User IP address on the configured interface.

  • Validate Attribute—Additional criteria to use when building a table of user accounts when receiving Accounting-Request Start messages. These attributes help when the ASA decides whether to tear down connections.

    If you do not specify additional attributes to validate, the decision is based solely on the IP address in the Framed IP Address attribute. If you configure additional attributes, and the ASA receives a start accounting message that includes an address that is currently being tracked, but the other attributes to validate are different, then all connections started using the old attributes are torn down, on the assumption that the IP address has been reassigned to a new user.

    Values range from 1-191, and you can enter the command multiple times. For a list of attribute numbers and their descriptions, see http://www.iana.org/assignments/radius-types.

Step 6

Click OK.

You can now use the inspection map in a RADIUS accounting inspection service policy.


Configure the RADIUS Accounting Inspection Service Policy

RADIUS accounting inspection is not enabled in the default inspection policy, so you must enable it if you need this inspection. Because RADIUS accounting inspection is for traffic directed to the ASA, you must configure it as a management inspection rule rather than a standard rule.

Procedure

Step 1

Choose Configuration > Firewall > Service Policy, and open a rule.

  • To create a new rule, click Add > Add Management Service Policy Rule. Proceed through the wizard to the Rules page.

  • If you have a RADIUS accounting inspection rule, or a management rule to which you are adding RADIUS accounting inspection, select it, click Edit, and click the Rule Actions tab.

Step 2

(To change an in-use policy) If you are editing any in-use policy to use a different inspection policy map, you must disable the RADIUS accounting inspection, and then re-enable it with the new inspection policy map name:

  1. Select None for the RADIUS Accounting map.

  2. Click OK.

  3. Click Apply.

  4. Repeat these steps to return to the Protocol Inspections tab.

Step 3

Choose the desired RADIUS Accounting Map. You can create the map at this time. For detailed information, see Configure a RADIUS Accounting Inspection Policy Map.

Step 4

Click OK or Finish to save the management service policy rule.


Monitoring Mobile Network Inspection

The following topics explain how to monitor mobile network inspection.

Monitoring GTP Inspection

To display the GTP configuration, enter the show service-policy inspect gtp command in privileged EXEC mode. Select Tools > Command Line Interface to enter commands.

Use the show service-policy inspect gtp statistics command to show the statistics for GTP inspection. The following is sample output:


firewall(config)# show service-policy inspect gtp statistics
GPRS GTP Statistics:
  version_not_support               0     msg_too_short             0
  unknown_msg                       0     unexpected_sig_msg        0
  unexpected_data_msg               0     ie_duplicated             0
  mandatory_ie_missing              0     mandatory_ie_incorrect    0
  optional_ie_incorrect             0     ie_unknown                0
  ie_out_of_order                   0     ie_unexpected             0
  total_forwarded                  67     total_dropped             1
  signalling_msg_dropped            1     data_msg_dropped          0
  signalling_msg_forwarded         67     data_msg_forwarded        0
  total created_pdp                33     total deleted_pdp         32
  total created_pdpmcb             31     total deleted_pdpmcb      30
  total dup_sig_mcbinfo             0     total dup_data_mcbinfo    0
  no_new_sgw_sig_mcbinfo            0     no_new_sgw_data_mcbinfo   0
  pdp_non_existent                  1

You can get statistics for a specific GTP endpoint by entering the IP address on the show service-policy inspect gtp statistics ip_address command.


firewall(config)# show service-policy inspect gtp statistics 10.9.9.9
1 in use, 1 most used, timeout 0:30:00
 GTP GSN Statistics for 10.9.9.9, Idle 0:00:34, restart counter 0
  Tunnels Active                     0
  Tunnels Created                    1
  Tunnels Destroyed                  0
  Total Messages Received            1
                          Signalling Messages        Data Messages
  total received                    1                            0
  dropped                           0                            0
  forwarded                         1                            0

Use the show service-policy inspect gtp pdp-context command to display PDP context-related information. For GTPv2, this is the bearer context. For example:


ciscoasa(config)# show service-policy inspect gtp pdp-context
4 in use, 5 most used

Version v1,   TID 050542012151705f,  MS Addr 2005:a00::250:56ff:fe96:eec, 
SGSN Addr 10.0.203.22,      Idle 0:52:01,   Timeout 3:00:00,   APN ssenoauth146

Version v2,   TID 0505420121517056,  MS Addr 100.100.100.102,  
SGW Addr 10.0.203.24,      Idle 0:00:05,   Timeout 3:00:00,   APN ssenoauth146

Version v2,   TID 0505420121517057,  MS Addr 100.100.100.103,  
SGW Addr 10.0.203.25,      Idle 0:00:04,   Timeout 3:00:00,   APN ssenoauth146

Version v2,   TID 0505420121517055,  MS Addr 100.100.100.101,  
SGW Addr 10.0.203.23,      Idle 0:00:06,   Timeout 3:00:00,   APN ssenoauth146

ciscoasa(config)# show service-policy inspect gtp pdp-context detail
1 in use, 1 most used

Version v1,   TID 050542012151705f,  MS Addr 2005:a00::250:56ff:fe96:eec, 
SGSN Addr 10.0.203.22,      Idle 0:06:14,   Timeout 3:00:00,   APN ssenoauth146

    user_name (IMSI):  50502410121507    MS address: 2005:a00::250:56ff:fe96:eec
    nsapi: 5                 linked nsapi: 5
    primary pdp: Y         sgsn is Remote
    sgsn_addr_signal: 10.0.203.22    sgsn_addr_data: 10.0.203.22
    ggsn_addr_signal: 10.0.202.22    ggsn_addr_data: 10.0.202.22
    sgsn control teid:     0x00000001    sgsn data teid:        0x000003e8
    ggsn control teid:     0x000f4240    ggsn data teid:        0x001e8480
    signal_sequence:               18     state:    Ready
...

The PDP or bearer context is identified by the tunnel ID (TID), which is a combination of the values for IMSI and NSAPI (GTPv0-1) or IMSI and EBI (GTPv2). A GTP tunnel is defined by two associated contexts in different GSN or SGW/PGW nodes and is identified with a Tunnel ID. A GTP tunnel is necessary to forward packets between an external packet data network and a mobile subscriber (MS) user.

Monitoring SCTP

You can use the following commands to monitor SCTP. Select Tools > Command Line Interface to enter these commands.

  • show service-policy inspect sctp

    Displays SCTP inspection statistics. The sctp-drop-override counter increments each time a PPID is matched to a drop action, but the packet was not dropped because it contained data chunks with different PPIDs. For example:

    
    ciscoasa# show service-policy inspect sctp 
    Global policy:
      Service-policy: global_policy
        Class-map: inspection_default
          Inspect: sctp sctp, packet 153302, lock fail 0, drop 20665, reset-drop 0, 
    5-min-pkt-rate 0 pkts/sec, v6-fail-close 0, sctp-drop-override 4910
            Match ppid 30 35
               rate-limit 1000 kbps, chunk 2354, dropped 10, bytes 21408, dropped-bytes 958
            Match: ppid 40
               drop, chunk 5849
            Match: ppid 55
               log, chunk 9546
    
    
  • show sctp [detail]

    Displays current SCTP cookies and associations. Add the detail keyword to see detailed information about SCTP associations. The detailed view also shows information about multi-homing, multiple streams, and fragment reassembly.

    
    ciscoasa# show sctp 
    
    AssocID: 71adeb15
    Local:  192.168.107.12/50001 (ESTABLISHED)
    Remote: 192.168.108.122/2905 (ESTABLISHED) 
    Secondary Conn List:
        192.168.108.12(192.168.108.12):2905 to 192.168.107.122(192.168.107.122):50001
        192.168.107.122(192.168.107.122):50001 to 192.168.108.12(192.168.108.12):2905
        192.168.108.122(192.168.108.122):2905 to 192.168.107.122(192.168.107.122):50001
        192.168.107.122(192.168.107.122):50001 to 192.168.108.122(192.168.108.122):2905
        192.168.108.12(192.168.108.12):2905 to 192.168.107.12(192.168.107.12):50001
        192.168.107.12(192.168.107.12):50001 to 192.168.108.12(192.168.108.12):2905
    
    
  • show conn protocol sctp

    Displays information about current SCTP connections.

  • show local-host [connection sctp start[-end]]

    Displays information on hosts making SCTP connections through the ASA, per interface. Add the connection sctp keyword to see only those hosts with the specified number or range of SCTP connections.

  • show traffic

    Displays SCTP connection and inspection statistics per interface if you enable the sysopt traffic detailed-statistics command.

Monitoring Diameter

You can use the following commands to monitor Diameter. Select Tools > Command Line Interface to enter these commands.

  • show service-policy inspect diameter

    Displays Diameter inspection statistics. For example:

    
    ciscoasa# show service-policy inspect diameter 
    Global policy: 
      Service-policy: global_policy
        Class-map: inspection_default
          Inspect: Diameter Diameter_map, packet 0, lock fail 0, drop 0, -drop 0,
    5-min-pkt-rate 0 pkts/sec, v6-fail-close 0
            Class-map: log_app
                Log: 5849
             Class-map: block_ip
                 drop-connection: 2
    
    
  • show diameter

    Displays state information for each Diameter connection. For example:

    
    ciscoasa# show diameter
    Total active diameter sessions: 5
    Session 3638
    	      ==========
    	      ref_count: 1 val = .; 1096298391; 2461;
    	          Protocol : diameter Context id : 0
    	          From inside:211.1.1.10/45169 to outside:212.1.1.10/3868
    ...
    
    
  • show conn detail

    Displays connection information. Diameter connections are marked with the Q flag.

  • show tls-proxy

    Displays information about the TLS proxy if you use one in Diameter inspection.

Monitoring M3UA

You can use the following commands to monitor M3UA. Select Tools > Command Line Interface to enter these commands.

  • show service-policy inspect m3ua drops

    Displays drop statistics for M3UA inspection.

  • show service-policy inspect m3ua endpoint [IP_address]

    Displays statistics for M3UA endpoints. You can specify an endpoint IP address to see information for a specific endpoint. For high availability or clustered systems, the statistics are per unit, they are not synchronized across units. For example:

    
    ciscoasa# sh service-policy inspect m3ua endpoint
    	M3UA Endpoint Statistics for 10.0.0.100, Idle : 0:00:06 :
    	                		Forwarded       	Dropped         	Total Received
    	All Messages     	21              		5               		26
    	DATA Messages     9               		5               		14
    	M3UA Endpoint Statistics for 10.0.0.110, Idle : 0:00:06 :
    	                		Forwarded       	Dropped         	Total Received
    	All Messages    	 21              		8               		29
    	DATA Messages     9               		8               		17
    
    
  • show service-policy inspect m3ua session

    Displays information about M3UA sessions if you enable strict application server process (ASP) state validation. Information includes source association ID, whether the session is single or double exchange, and in clustering, whether it is a cluster owner session or a backup session. In a cluster with 3 or more units, you might see stale backup sessions if a unit leaves and then returns to the cluster. These stale sessions are removed when they time out, unless you disabled session timeout.

    
    Ciscoasa# show service-policy inspect m3ua session
    0 in use, 0 most used
    Flags: o - cluster owner session, b - cluster backup session
           d - double exchange      , s - single exchange
    AssocID: cfc59fbe in Down state, idle:0:00:05, timeout:0:01:00, bd
    AssocID: dac2e123 in Active state, idle:0:00:18, timeout:0:01:00, os
    
    
  • show service-policy inspect m3ua table

    Displays the run-time M3UA inspection table, including classification rules.

  • show conn detail

    Displays connection information. M3UA connections are marked with the v flag.

History for Mobile Network Inspection

Feature Name

Releases

Feature Information

GTPv2 inspection and improvements to GTPv0/1 inspection.

9.5(1)

GTP inspection can now handle GTPv2. In addition, GTP inspection for all versions now supports IPv6 addresses.

We changed the GTP Inspect Map > Inspections dialog box to let you configure separate message ID matching for GTPv1 and GTPv2. On the General parameters tab, the GSN timeout is now the Endpoint timeout.

SCTP inspection

9.5(2)

You can now apply application-layer inspection to Stream Control Transmission Protocol (SCTP) traffic to apply actions based on payload protocol identifier (PPID).

We added or changed the following screens: Configuration > Firewall > Objects > Inspect Maps > SCTP; Configuration > Firewall > Service Policy add/edit wizard's Rule Actions > Protocol Inspection tab.

Diameter inspection

9.5(2)

You can now apply application-layer inspection to Diameter traffic and also apply actions based on application ID, command code, and attribute-value pair (AVP) filtering.

We added or changed the following screens: Configuration > Firewall > Objects > Inspect Maps > Diameter and Diameter AVP; Configuration > Firewall > Service Policy add/edit wizard's Rule Actions > Protocol Inspection tab.

Diameter inspection improvements

9.6(1)

You can now inspect Diameter over TCP/TLS traffic, apply strict protocol conformance checking, and inspect Diameter over SCTP in cluster mode.

We added or changed the following screens: Configuration > Firewall > Objects > Inspect Maps > Diameter; Configuration > Firewall > Service Policy add/edit wizard's Rule Actions > Protocol Inspection tab.

SCTP stateful inspection in cluster mode

9.6(1)

SCTP stateful inspection now works in cluster mode. You can also configure SCTP stateful inspection bypass in cluster mode.

We did not add or modify any screens.

MTP3 User Adaptation (M3UA) inspection.

9.6(2)

You can now inspect M3UA traffic and also apply actions based on point code, service indicator, and message class and type.

We added or modified the following pages: Configuration > Firewall > Objects > Inspection Maps > M3UA; the Rule Action > Protocol Inspection tab for service policy rules.

Support for SCTP multi-streaming reordering and reassembly and fragmentation. Support for SCTP multi-homing, where the SCTP endpoints have more than one IP address.

9.7(1)

The system now fully supports SCTP multi-streaming reordering, reassembly, and fragmentation, which improves Diameter and M3UA inspection effectiveness for SCTP traffic. The system also supports SCTP multi-homing, where the endpoints have more than one IP address each. For multi-homing, the system opens pinholes for the secondary addresses so that you do not need to write access rules to allow them. SCTP endpoints must be limited to 3 IP addresses each.

We did not modify any ASDM screens.

M3UA inspection improvements.

9.7(1)

M3UA inspection now supports stateful failover, semi-distributed clustering, and multihoming. You can also configure strict application server process (ASP) state validation and validation for various messages. Strict ASP state validation is required for stateful failover and clustering.

We modified the following screens: Configuration > Firewall > Objects > Inspection Maps > M3UA Add/Edit dialog boxes.

Support for setting the TLS proxy server SSL cipher suite.

9.8(1)

You can now set the SSL cipher suite when the ASA acts as a TLS proxy server. Formerly, you could only set global settings for the ASA on the Configuration > Device Management > Advanced > SSL Settings > Encryption page.

We modified the following screen: Configuration > Firewall > Unified Communications > TLS Proxy, Add/Edit dialog boxes, Server Configuration page.

GTP inspection enhancements for MSISDN and Selection Mode filtering, anti-replay, and user spoofing protection.

9.10(1)

You can now configure GTP inspection to drop Create PDP Context messages based on Mobile Station International Subscriber Directory Number (MSISDN) or Selection Mode. You can also implement anti-replay and user spoofing protection.

We modified the Configuration > Firewall > Objects > Inspection Maps > GTP > Add/Edit dialog box.

GTPv1 release 10.12 support.

9.12(1)

The system now supports GTPv1 release 10.12. Previously, the system supported release 6.1. The new support includes recognition of 25 additional GTPv1 messages and 66 information elements.

In addition, there is a behavior change. Now, any unknown message IDs are allowed. Previously, unknown messages were dropped and logged.

We did not add or change any screens.