Deployment Overview and Requirements

Deployment Overview

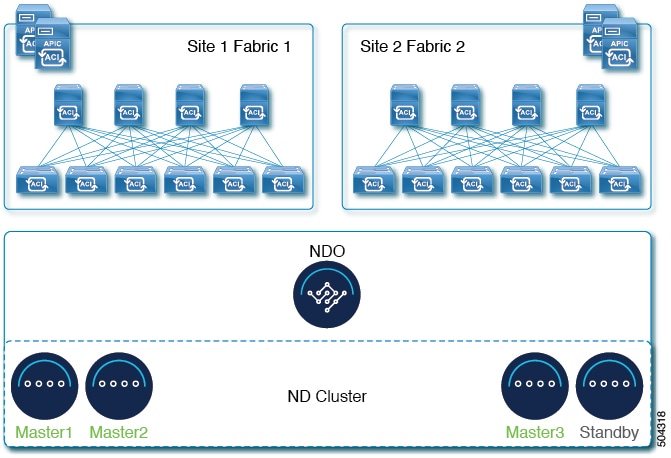
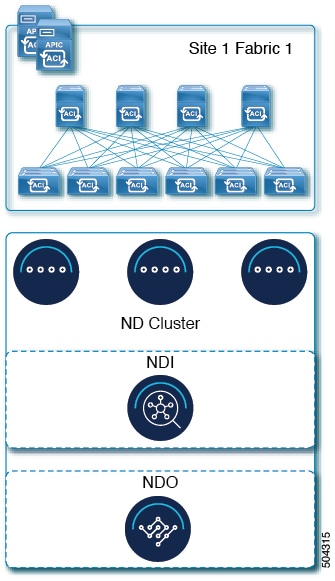
Cisco Nexus Dashboard is a central management console for multiple data center sites and a common platform for hosting Cisco data center operation services, such as Nexus Dashboard Insights and Nexus Dashboard Orchestrator. These services are available for all the data center sites and provide real time analytics, visibility, assurance for network policies and operations, as well as policy orchestration for the data center fabrics, such as Cisco ACI or Cisco NDFC.

Nexus Dashboard provides a common platform and modern technology stack for the above-mentioned micro-services-based applications, simplifying the life cycle management of the different modern applications and reducing the operational overhead to run and maintain these applications. It also provides a central integration point for external 3rd party applications with the locally hosted applications.

Nexus Dashboard cluster typically consists of 1 or 3 master nodes. For 3-node clusters, you can also provision a number of worker nodes to enable horizontal scaling and standby nodes for easy cluster recovery in case of a master node failure. For maximum number of worker and standby nodes supported in this release, see the "Verified Scalability Limits" sections of the Cisco Nexus Dashboard Release Notes.


Note


This document describes initial configuration of the base cluster. After your cluster is up and running, you can configure and deploy additional nodes as described in the Cisco Nexus Dashboard User Guide, which is also available directly from the Nexus Dashboard GUI.


Hardware vs Software Stack

Nexus Dashboard is offered as a cluster of specialized Cisco UCS servers (Nexus Dashboard platform) with the software framework (Nexus Dashboard) pre-installed on it. The Cisco Nexus Dashboard software stack can be decoupled from the hardware and deployed in a number of virtual form factors. For the purposes of this document, we will use "Nexus Dashboard platform" specifically to refer to the hardware and "Nexus Dashboard" to refer to the software stack and the GUI console.


Note


Root access to the Nexus Dashboard software is restricted to Cisco TAC only. A special user rescue-user is created for all Nexus Dashboard deployments to enable a set of operations and troubleshooting commands. For additional information about the available rescue-user commands, see the "Troubleshooting" chapter of the Nexus Dashboard User Guide.


This guide describes the initial deployment of the Nexus Dashboard software; hardware setup is described in the Nexus Dashboard Hardware Setup Guide, while other Nexus Dashboard operations procedures are described in the Cisco Nexus Dashboard User Guide.

Services

Nexus Dashboard is a standard appliance platform to build and deploy services that would allow you to consume all Nexus Dashboard products in a consistent and uniform manner. You can subscribe and consume services like Insights, Orchestrator, Fabric Controller, and Data Broker with the Nexus Dashboard platform providing the necessary capacity and life cycle management operations for these services.

Typically, the Nexus Dashboard platform is shipped with only the software required for managing the lifecycle of these services, but no actual services are packaged with the appliance. If you allow public network connectivity from your data centers, you can download and install the services with a few clicks. However, without public network connectivity, you will need to manually download these services, upload them to the platform, and perform installation operations before you can use them.

If you are ordering the physical Nexus Dashboard servers, you have the option to choose some services to be pre-installed on the hardware before it is shipped to you. For more information, see the Nexus Dashboard Ordering Guide. Note that if you are deploying the virtual or cloud form factors of the Nexus Dashboard, you will need to deploy the services separately after the cluster is ready.

Available Form Factors

This release of Cisco Nexus Dashboard can be deployed using a number of different form factors. Keep in mind however, you must use the same form factor for all nodes, mixing different form factors within the same cluster is not supported.


Note


Not all services are supported on all form factors. When planning your deployment, ensure to check Cisco Nexus Dashboard Cluster Sizing for form factor and cluster size requirements.


  • Cisco Nexus Dashboard physical appliance (.iso)

    This form factor refers to the original physical appliance hardware that you purchased with the Cisco Nexus Dashboard software stack pre-installed on it.

    The later sections in this document describe how to configure the software stack on the existing physical appliance hardware to deploy the cluster. Setting up the original Cisco Nexus Dashboard platform hardware is described in Cisco Nexus Dashboard Hardware Setup Guide.

  • VMware ESX (.ova)

    Virtual form factor that allows you to deploy a Nexus Dashboard cluster using three VMware ESX virtual machines.

  • Linux KVM (.qcow2)

    Virtual form factor that allows you to deploy a Nexus Dashboard cluster using three Linux KVM virtual machines.

  • Amazon Web Services (.ami)

    Cloud form factor that allows you to deploy a Nexus Dashboard cluster using three AWS instances.

  • Microsoft Azure (.arm)

    Cloud form factor that allows you to deploy a Nexus Dashboard cluster using three Azure instances.

  • In an existing Red Hat Enterprise Linux (RHEL) system

    Beginning with Release 2.2(1), you can run Nexus Dashboard node in an existing Red Hat Enterprise Linux server.

Cluster Sizing and Availability Guidelines

As mentioned previously, Nexus Dashboard cluster is first deployed using 1 or 3 master nodes. Depending on the type and number of services you choose to run, you may be required to deploy additional worker nodes in your cluster after the initial deployment. For cluster sizing information and recommended number of nodes based on specific use cases, see the Cisco Nexus Dashboard Cluster Sizing tool.


Note


  • Single-node clusters are supported for a limited number of services and cannot be extended to a 3-node cluster after the initial deployment.

  • Only 3-node clusters support additional worker nodes.

  • If you deploy a single-node cluster and want to extended it to a 3-node cluster or add worker nodes, you will need to redeploy it as a base 3-node cluster.

  • For 3-node clusters, at least 2 master nodes are required for the cluster to remain operational. If 2 master nodes fail, the cluster will go offline and cannot be used until you recover it as described in the Cisco Nexus Dashboard User Guide.


After your initial cluster is up and running, you can configure and deploy additional nodes as described in the Cisco Nexus Dashboard User Guide, which is also available directly from the Nexus Dashboard GUI.

Supported Services

For the full list of supported applications and the associated compatibility and interoperability information, see the Nexus Dashboard and Services Compatibility Matrix.

Prerequisites and Guidelines

Network Time Protocol (NTP) and Domain Name System (DNS)

The Nexus Dashboard nodes require valid DNS and NTP servers for all deployments and upgrades.

Lack of valid DNS connectivity (such as if using an unreachable or a placeholder IP address) can prevent the system from deploying or upgrading successfully.


Note


Nexus Dashboard acts as both a DNS client and resolver. It uses an internal Core DNS server which acts as DNS resolver for internal services. It also acts as a DNS client to reach external hosts within the intranet or the Internet, hence it requires an external DNS server to be configured.

Additionally, Nexus Dashboard does not support DNS servers with wildcard records.


Nexus Dashboard External Networks

Cisco Nexus Dashboard is deployed as a cluster, connecting each service node to two networks. When first configuring Nexus Dashboard, you will need to provide two IP addresses for the two Nexus Dashboard interfaces—one connected to the Data Network and the other to the Management Network.

Individual services installed in the Nexus Dashboard may utilize the two networks for additional purposes, so we recommend consulting the specific service’s documentation in addition to this document for your deployment planning.

Table 1. External Network Purpose
Data Network Management Network
  • Nexus Dashboard node clustering

  • Service to service communication

  • Nexus Dashboard nodes to Cisco APIC, Cloud Network Controller, and NDFC communication

    For example, the network traffic for services such as Nexus Dashboard Insights.

  • Accessing Nexus Dashboard GUI

  • Accessing Nexus Dashboard CLI via SSH

  • DNS and NTP communication

  • Nexus Dashboard firmware upload

  • Accessing Cisco DC App Center (AppStore)

    If you want to use the Nexus Dashboard App Store to install services, https://dcappcenter.cisco.com must be reachable via the Management Network

  • Intersight device connector

The two networks have the following requirements:

  • For all new Nexus Dashboard deployments, the management network and data network must be in different subnets.

  • For physical clusters, the management network must provide IP reachability to each node's CIMC via TCP ports 22/443.

    Nexus Dashboard cluster configuration uses each node's CIMC IP address to configure the node.

  • For Nexus Dashboard Insights service, the data network must provide IP reachability to the in-band network of each fabric and of the APIC.

  • For Nexus Dashboard Insights and AppDynamics integration, the data network must provide IP reachability to the AppDynamics controller.

  • For Nexus Dashboard Orchestrator service, the data network can have in-band and/or out-of-band IP reachability for Cisco APIC sites but must have in-band reachability for Cisco NDFC sites.

  • The data network interface requires a minimum MTU of 1500 to be available for the Nexus Dashboard traffic.

    Higher MTU can be configured if desired.


    Note


    If external VLAN tag is configured for switch ports that are used for data network traffic, you must enable jumbo frames or configure custom MTU equal to or greater than 1504 bytes.


  • The table bellow summarize service-specific requirements for the management and data networks.


    Note


    Changing the data subnet requires redeploying the cluster, so we recommend using a larger subnet than the bare minimum required by the nodes and services to account for any additional services in the future. In addition to the requirements listed in this section, ensure that you consult the Release Notes for the specific service you plan to deploy.

    Allocating persistent IP addresses is done after the cluster is deployed using the External Service Pools configuration in the UI, as described in the Cisco Nexus Dashboard User Guide.

    We recommend consulting the specific service's documentation for any additional requirements and caveats related to persistent IP configuration.

    Table 2. Service-Specific Network Requirements

    Nexus Dashboard Service

    Management Interface

    Data Interface

    Total Number of Persistent IPs

    Nexus Dashboard Orchestrator

    Layer 3 adjacent

    Layer 3 adjacent

    N/A

    Nexus Dashboard Insights without SFLOW/NetFlow (ACI fabrics)

    Layer 3 adjacent

    Layer 3 adjacent

    N/A

    Nexus Dashboard Insights without SFLOW/NetFlow (NDFC fabrics)

    Layer 3 adjacent

    Layer 2 adjacent

    6 IPs in data interface network if using IPv4

    7 IPs in data interface network if using IPv6

    Nexus Dashboard Insights with SFLOW/NetFlow (ACI or NDFC fabrics)

    Layer 3 adjacent

    Layer 2 adjacent

    6 IPs in data interface network

    Nexus Dashboard Fabric Controller, Release 12.0(x)

    Layer 2 adjacent

    Layer 2 adjacent

    If LAN Device Management Connectivity is set to Management (default):

    • 2 IPs in the management network for SNMP/Syslog and SCP services

    • If EPL is enabled, 1 additional IP in the data network for each fabric

    • If IP Fabric for Media is enabled, 1 additional IP in the management network for telemetry

    If LAN Device Management Connectivity is set to Data:

    • 2 IPs in the data network for SNMP/Syslog and SCP services

    • If EPL is enabled, 1 additional IP in the data network for each fabric

    • If IP Fabric for Media is enabled, 1 additional IP in the data network for telemetry

    Nexus Dashboard Fabric Controller, Release 12.1.1 and later

    Layer 2 or Layer 3 adjacent

    Layer 2 or Layer 3 adjacent

    When operating in Layer 2 mode with LAN deployment type and LAN Device Management Connectivity set to Management (default)

    • 2 IPs in the management network for SNMP/Syslog and SCP services

    • If EPL is enabled, 1 additional IP in the data network for each fabric

    • If IP Fabric for Media is enabled, 1 additional IP in the management network for telemetry

    When operating in Layer 2 mode with LAN deployment type and LAN Device Management Connectivity set to Data:

    • 2 IPs in the data network for SNMP/Syslog and SCP services

    • If EPL is enabled, 1 additional IP in the data network for each fabric

    • If IP Fabric for Media is enabled, 1 additional IP in the data network for telemetry

    When operating in Layer 3 mode with LAN deployment type:

    • LAN Device Management Connectivity must be set to Data

    • 2 IPs for SNMP/Syslog and SCP services

    • If EPL is enabled, 1 additional IP in the data network for each fabric

    • All persistent IPs must be part of a separate pool that must not overlap with the management or data subnets

      For more information about Layer 3 mode for persistent IPs, see the Persistent IPs section in the User's Guide

    When operating in Layer 2 mode with SAN Controller deployment type:

    • 1 IP for SSH

    • 1 IP for SNMP/Syslog

    • 1 IP for SAN Insights functionality

    Note


    SAN Controller and IP Fabric for Media are not supported in Layer 3 mode

    Nexus Dashboard Data Broker

    Layer 3 adjacent

    N/A

    N/A

  • Connectivity between the nodes is required on both networks with the following additional round trip time (RTT) requirements.


    Note


    You must always use the lowest RTT requirement when deploying the Nexus Dashboard cluster and services. For example, if you plan to co-host the Insights and Orchestrator services, site connectivity RTT must not exceed 50ms.


    Table 3. RTT Requirements

    Service

    Connectivity

    Maximum RTT

    Nexus Dashboard Orchestrator

    Between nodes

    50 ms

    To sites

    For APIC sites: 500 ms

    For NDFC sites: 150 ms

    Nexus Dashboard Insights

    Between nodes

    50 ms

    To switches

    150 ms

    Nexus Dashboard Fabric Controller

    Between nodes

    50 ms

    To switches

    200 ms*

    * POAP (PowerOn Auto Provisioning) is supported with a max RTT of 50 ms between Nexus Dashboard Fabric Controller and the switches.

Nexus Dashboard Internal Networks

Two additional internal networks are required for communication between the containers used by the Nexus Dashboard:

  • Application overlay is used for applications internally within Nexus Dashboard

    Application overlay must be a /16 network and a default value is pre-populated during deployment.

  • Service overlay is used internally by the Nexus Dashboard.

    Service overlay must be a /16 network and a default value is pre-populated during deployment.

If you are planning to deploy multiple Nexus Dashboard clusters, they can use the same Application and Service subnets.


Note


Communications between containers deployed in different Nexus Dashboard nodes is VXLAN-encapsulated and uses the data interfaces IP addresses as source and destination. This means that the Application Overlay and Service Overlay addresses are never exposed outside the data network and any traffic on these subnets is routed internally and does not leave the cluster nodes.

For example, if you had another service (such as DNS) on the same subnet as one of the overlay networks, you would not be able to access it from your Nexus Dashboard as the traffic on that subnet would never be routed outside the cluster. As such, when configuring these networks, ensure that they are unique and do not overlap with any existing networks or services external to the cluster, which you may need to access from the Nexus Dashboard cluster nodes.

For the same reason, we recommend not using 169.254.0.0/16 (the Kubernetes br1 subnet) for the App or Service subnets.


BGP Configuration and Persistent IPs

Previous releases of Nexus Dashboard allowed you to configure one or more persistent IP addresses for services (such as Nexus Dashboard Insights) that require retaining the same IP addresses even in case they are relocated to a different Nexus Dashboard node. However, in those releases, the persistent IPs had to be part of the management and data subnets and the feature could be enabled only if all nodes in the cluster were part of the same Layer 3 network. Here the services used Layer 2 mechanisms like Gratuitous ARP or Neighbor Discovery to advertise the persistent IPs within it's Layer 3 network

Beginning with Release 2.2(1), the Persistent IPs feature is supported even if you deploy the cluster nodes in different Layer 3 networks. In this case, the persistent IPs are advertised out of each node's data links via BGP, which we refer to as "Layer 3 mode". The IPs must also be part of a subnet that is not overlapping with any of the nodes' management or data subnets. If the persistent IPs are outside the data and management networks, this feature will operate in Layer 3 mode by default; if the IPs are part of those networks, the feature will operate in Layer 2 mode.

BGP can be enabled during cluster deployment or from the Nexus Dashboard GUI after the cluster is up and running.

If you plan to enable BGP and use the persistent IP functionality, you must:

  • Ensure that the peer routers exchange the advertised persistent IPs between the nodes' Layer 3 networks.

  • Choose to enable BGP at the time of the cluster deployment as described in the subsequent sections or enable it afterwards in the Nexus Dashboard GUI as described in the "Persistent IP Addresses" sections of the User's Guide.

  • Ensure that the persistent IP addresses you allocate do not be overlap with any of the nodes' management or data subnets.

Communication Ports

The following sections provide a reference for ports required by the Nexus Dashboard cluster and services.


Note


All services use TLS or mTLS with encryption to protect data privacy and integrity over the wire.


Nexus Dashboard Ports

The following ports are required by the Nexus Dashboard cluster.

Table 4. Nexus Dashboard Ports (Management Network)

Service

Port

Protocol

Direction

In—towards the cluster

Out—from the cluster towards the fabric or outside world

Connection

ICMP

ICMP

ICMP

In/Out

Other cluster nodes, CIMC, default gateway

SSH

22

TCP

In/Out

CLI and CIMC of the cluster nodes

TACACS

49

TCP

Out

TACACS server

DNS

53

TCP/UDP

Out

DNS server

HTTP

80

TCP

Out

Internet/proxy

NTP

123

UDP

Out

NTP server

HTTPS

443

TCP

In/Out

UI, other clusters (for multi-cluster connectivity), fabrics, Internet/proxy

LDAP

389

636

TCP

Out

LDAP server

Radius

1812

TCP

Out

Radius server

KMS

9880

TCP

In/Out

Other cluster nodes and ACI fabrics

Infra-Service

30012

30021

30500-30600

TCP/UDP

In/Out

Other cluster nodes

Table 5. Nexus Dashboard Ports (Data Network)

Service

Port

Protocol

Direction

In—towards the cluster

Out—from the cluster towards the fabric or outside world

Connection

ICMP

ICMP

ICMP

In/Out

Other cluster nodes, CIMC, default gateway

SSH

22

TCP

Out

In-band of switches and APIC

DNS

53

TCP/UDP

In/Out

Other cluster nodes and DNS server

HTTPS

443

TCP

Out

In-band of switches and APIC/NDFC

SSH

1022

TCP/UDP

In/Out

Other cluster nodes

VXLAN

4789

UDP

In/Out

Other cluster nodes

KMS

9880

TCP

In/Out

Other cluster nodes and ACI fabrics

Infra-Service

3379

3380

8989

9090

9969

9979

9989

15223

30002-30006

30009-30010

30012

30014-30015

30018-30019

30025

30027

TCP

In/Out

Other cluster nodes

Infra-Service

30016

30017

TCP/UDP

In/Out

Other cluster nodes

Infra-Service

30019

UDP

In/Out

Other cluster nodes

Infra-Service

30500-30600

TCP/UDP

In/Out

Other cluster nodes

Nexus Dashboard Insights Ports

In addition to the ports required by the Nexus Dashboard cluster nodes, which are listed above, the following ports are required by the Nexus Dashboard Insights service.

Table 6. Nexus Dashboard Insights Ports (Data Network)

Service

Port

Protocol

Direction

In—towards the cluster

Out—from the cluster towards the fabric or outside world

Connection

Show Techcollection

2022

TCP

In/Out

In-band of switches and APIC/NDFC

Flow Telemetry

5640-5671​

UDP

In

In-band of switches

TAC Assist

8884

TCP

In/Out

Other cluster nodes

KMS

9989

TCP

In/Out

Other cluster nodes and ACI fabrics

Kafka

30001

TCP

In/Out

In-band IP of switches and APIC/NDFC

SW Telemetry

5695​

30000

57500

30570

TCP

In/Out

Other cluster nodes

Nexus Dashboard Fabric Controller Ports

In addition to the ports required by the Nexus Dashboard (ND) cluster nodes, the following ports are required by the Nexus Dashboard Fabric Controller (NDFC) service.


Note


The following ports apply to the Nexus Dashboard management network and/or data network interfaces depending on which interface provides IP reachability from the NDFC service to the switches.


Table 7. Nexus Dashboard Fabric Controller Ports

Service

Port

Protocol

Direction

In—towards the cluster

Out—from the cluster towards the fabric or outside world

Connection

(Applies to both LAN and SAN deployments, unless stated otherwise)

SSH

22

TCP

Out

SSH is a basic mechanism for accessing devices.

SCP

22

TCP

Out

SCP clients archiving NDFC backup files to remote server.

SMTP

25

TCP

Out

SMTP port is configurable through NDFC's Server Settings menu.

This is an optional feature.

DHCP

67

UDP

In

If NDFC local DHCP server is configured for Bootstrap/POAP purposes.

This applies to LAN deployments only.

Note


When using NDFC as a local DHCP server for POAP purposes, all ND master node IPs must be configured as DHCP relays. Whether the ND nodes' management or data IPs are bound to the DHCP server is determined by the LAN Device Management Connectivity in the NDFC Server Settings.

DHCP

68

UDP

Out

SNMP

161

TCP/UDP

Out

SNMP traffic from NDFC to devices.

HTTPS/HTTP (NX-API)

443/80

TCP

Out

NX-API HTTPS/HTTP client connects to device NX-API server on port 443/80, which is also configurable. NX-API is an optional feature, used by limited set of NDFC functions.

This applies to LAN deployments only.

HTTPS (vCenter, Kubernetes, OpenStack, Discovery)

443

TCP

Out

NDFC provides an integrated host and physical network topology view by correlating the information obtained from registered VMM domains, such as VMware vCenter or OpenStack, as well as container orchestrators, such as Kubernetes.

This is an optional feature


Note


The following ports apply to the External Service IPs, also known as persistent IPs, used by some of the NDFC services. These External Service IPs may come from the Nexus Dashboard management subnet pool or the data subnet pool depending on the configured settings.


Table 8. Nexus Dashboard Fabric Controller Persistent IP Ports

Service

Port

Protocol

Direction

In—towards the cluster

Out—from the cluster towards the fabric or outside world

Connection

(Applies to both LAN and SAN deployments, unless stated otherwise)

SCP

22

TCP

In

SCP is used by various features to transfer files between devices and the NDFC service. The NDFC SCP service serves as the SCP server for both downloads and uploads. SCP is also used by the POAP client on the devices to download POAP-related files.

The SCP-POAP service in NDFC has a persistent IP that is associated with either the management or data subnet. This is controlled by the LAN Device Management Connectivity setting in the NDFC Server Settings.

TFTP (POAP)

69

TCP

In

Only used for device zero-touch provisioning via POAP, where devices can send (limited jailed write-only access to NDFC) basic inventory information to NDFC to start secure POAP communication. NDFC Bootstrap or POAP can be configured for TFTP or HTTP/HTTPS.

The SCP-POAP service in NDFC has a persistent IP that is associated with either the management or data subnet. This is controlled by the LAN Device Management Connectivity setting in the NDFC Server Settings.

This applies to LAN deployments only.

HTTP (POAP)

80

TCP

In

Only used for device zero-touch provisioning via POAP, where devices can send (limited jailed write-only access to NDFC) basic inventory information to NDFC to start secure POAP communication. NDFC Bootstrap or POAP can be configured for TFTP or HTTP/HTTPS.

The SCP-POAP service in NDFC has a persistent IP that is associated with either the management or data subnet. This is controlled by the LAN Device Management Connectivity setting in the NDFC Server Settings.

This applies to LAN deployments only.

BGP

179

TCP

In/Out

For Endpoint Locator, per fabric where it is enabled, an EPL service is spawned with its own persistent IP. This service is always associated with the Nexus Dashboard data interface. NDFC EPL service peers with the appropriate BGP entity (typically BGP Route-Reflectors) on the fabric to get BGP updates needed to track endpoint information.

This feature is only applicable for VXLAN BGP EVPN fabric deployments.

This applies to LAN deployments only.

HTTPS (POAP)

443

TCP

In

Secure POAP is accomplished via the NDFC HTTPS Server on port 443. The HTTPS server is bound to the SCP-POAP service and uses the same persistent IP assigned to that pod.

The SCP-POAP service in NDFC has a persistent IP that is associated with either the management or data subnet. This is controlled by the LAN Device Management Connectivity setting in the NDFC Server Settings.

This applies to LAN deployments only.

Syslog

514

UDP

In

When NDFC is configured as a Syslog server, Syslogs from the devices are sent out toward the persistent IP associated with the SNMP-Trap/Syslog service pod

The SNMP-Trap-Syslog service in NDFC has a persistent IP that is associated with either the management or data subnet. This is controlled by the LAN Device Management Connectivity setting in the NDFC Server Settings

SCP

2022

TCP

Out

Transport tech-support file from persistent IP of NDFC POAP-SCP pod to a separate ND cluster running Nexus Dashboard Insights.

The SCP-POAP service in NDFC has a persistent IP that is associated with either the management or data subnet. This is controlled by the LAN Device Management Connectivity setting in the NDFC Server Settings

SNMP Trap

2162

UDP

In

SNMP traps from devices to NDFC are sent out toward the persistent IP associated with the SNMP-Trap/Syslog service pod.

The SNMP-Trap-Syslog service in NDFC has a persistent IP that is associated with either the management or data subnet. This is controlled by the LAN Device Management Connectivity setting in the NDFC Server Settings

GRPC (Telemetry)

33000

TCP

In

SAN Insights Telemetry Server which receives SAN data (such as storage, hosts, flows, and so on) over GRPC transport tied to NDFC Persistent IP.

This is enabled on SAN deployments only.

GRPC (Telemetry)

50051

TCP

In

Information related to multicast flows for IP Fabric for Media deployments as well as PTP for general LAN deployments is streamed out via software telemetry to a persistent IP associated with a NDFC GRPC receiver service pod.

This is enabled on LAN and Media deployments only.

Nexus Dashboard Fabric Controller Ports for SAN Deployments

Nexus Dashboard Fabric Controller can be deployed on a single-node or 3-node Nexus Dashboard cluster. The following ports are required for NDFC SAN deployments on single-node clusters.

Table 9. Nexus Dashboard Fabric Controller Ports for SAN Deployments on Single-Node Clusters

Service

Port

Protocol

Direction

In—towards the cluster

Out—from the cluster towards the fabric or outside world

Connection

(Applies to both LAN and SAN deployments, unless stated otherwise)

SSH

22

TCP

Out

SSH is a basic mechanism for accessing devices.

SCP

22

TCP

Out

SCP clients archiving NDFC backup files to remote server.

SMTP

25

TCP

Out

SMTP port is configurable through NDFC's Server Settings menu.

This is an optional feature.

SNMP

161

TCP/UDP

Out

SNMP traffic from NDFC to devices.

HTTPS (vCenter, Kubernetes, OpenStack, Discovery)

443

TCP

Out

NDFC provides an integrated host and physical network topology view by correlating the information obtained from registered VMM domains, such as VMware vCenter or OpenStack, as well as container orchestrators, such as Kubernetes.

This is an optional feature.


Note


The following ports apply to the External Service IPs, also known as Persistent IPs, used by some of the NDFC services. These External Service IPs may come from the Nexus Dashboard management subnet pool or the data subnet pool depending on the configured settings.


Table 10. Nexus Dashboard Fabric Controller Persistent IP Ports for SAN Deployments on Single-Node Clusters

Service

Port

Protocol

Direction

In—towards the cluster

Out—from the cluster towards the fabric or outside world

Connection

SCP

22

TCP

In

SCP is used by various features to transfer files between devices and the NDFC service. The NDFC SCP service functions for both downloads and uploads.

Syslog

514

UDP

In

When NDFC is configured as a Syslog server, syslogs from the devices are sent out towards the persistent IP associated with the SNMP-Trap/Syslog service pod.

The SNMP-Trap-Syslog service in NDFC has a persistent IP that is associated with either the management or data subnet. This is controlled by the LAN Device Management Connectivity setting in the NDFC Server Settings.

SNMP Trap

2162

UDP

In

SNMP traps from devices to NDFC are sent out toward the persistent IP associated with the SNMP-Trap/Syslog service pod.

The SNMP-Trap-Syslog service in NDFC has a persistent IP that is associated with either the management or data subnet.

GRPC (Telemetry)

33000

TCP

In

SAN Insights Telemetry Server which receives SAN data (such as storage, hosts, flows, and so on) over GRPC transport tied to NDFC Persistent IP.

This is enabled on SAN deployments only.

Fabric Connectivity

The following sections describe how to connect your Nexus Dashboard cluster nodes to the management and data networks and how to connect the cluster to your fabrics.

For on-premises APIC or NDFC fabrics, you can connect the Nexus Dashboard cluster in one of two ways:

  • The Nexus Dashboard cluster connected to the fabric via a Layer 3 network.

  • The Nexus Dashboard nodes connected to the leaf switches as typical hosts.

For Cisco Cloud Network Controller fabrics, you must connect via a Layer 3 network.

Physical Node Cabling


Note


If you plan to deploy a virtual or cloud form factor cluster, you can skip this section.


Physical nodes can be deployed in UCS-C220-M5 (SE-NODE-G2) and UCS-C225-M6 (ND-NODE-L4) physical servers with the following guidelines:

Figure 1. mLOM and PCIe Riser 01 Card Used for Node Connectivity
  • Both servers come with a Modular LAN on Motherboard (mLOM) card, which you use to connect to the Nexus Dashboard management network.

  • The UCS-C220-M5 server includes a 4-port VIC1455 card in the "PCIe-Riser-01" slot (shown in the above diagram), which you use for Nexus Dashboard data network connectivity

  • The UCS-C225-M6 server includes either a 2x10GbE NIC (APIC-P-ID10GC) or 2x25/10GbE SFP28 NIC (APIC-P-I8D25GF) in the "PCIe-Riser-01" slot (shown in the above diagram), which you use for Nexus Dashboard data network connectivity.

When connecting the node to your management and data networks:

  • For management network:

    • You must use the mgmt0 and mgmt1 on the mLOM card.

    • All ports must have the same speed, either 1G or 10G.

  • For data network on the UCS-C220-M5 server, you must use the VIC1455 card:

    • All ports must have the same speed, either 10G or 25G.

    • Port-1 corresponds to fabric0 in Nexus Dashboard and Port-2 corresponding to fabric1.

      You can use both fabric0 and fabric1 for data network connectivity.

  • For data network on the UCS-C225-M6 server, you can use the 2x10GbE NIC (APIC-P-ID10GC), or 2x25/10GbE SFP28 NIC (APIC-P-I8D25GF), or the VIC1455 card:

    • All ports must have the same speed, either 10G or 25G.

    • If you use 25G connectivity between the Nexus Dashboard node and the fabric, you must use a copper cable.

      For a list of compatible transceiver options, see the Cisco 25GBASE SFP28 Modules Data Sheet.

    • Port-1 corresponds to fabric0 in Nexus Dashboard and Port-2 corresponding to fabric1.

      You can use both fabric0 and fabric1 for data network connectivity.

The interfaces are configured as Linux bonds (one for the data interfaces and one for the management interfaces) running in active-standby mode. All interfaces must be connected to individual host ports, PortChannel or vPC are not supported.

When Nexus Dashboard nodes are connected to Cisco Catalyst switches, packets are tagged with vlan0 if no VLAN is specified. In this case, you must add switchport voice vlan dot1p command to the switch interfaces where the nodes are connected to ensure reachability over the data network.

Connecting via External Layer 3 Network

We recommend connecting the Nexus Dashboard cluster to the fabrics via an external Layer 3 network as it does not tie the cluster to any one fabric and the same communication paths can be establish to all sites. Specific connectivity depends on the type of applications deployed in the Nexus Dashboard:

  • If you are deploying Nexus Dashboard Orchestrator to manage Cisco ACI fabrics only, you can establish connectivity from the data interface to either the in-band or out-of-band (OOB) interface of each site's APIC or both.

  • If you are deploying Nexus Dashboard Orchestrator to manage Cisco NDFC fabrics, you must establish connectivity from the data interface to the in-band interface of each site's NDFC.

  • If you are deploying Day-2 Operations applications, such as Nexus Dashboard Insights, you must establish connectivity from the data interface to the in-band network of each fabric and of the APIC.

If you plan to connect the cluster across a Layer 3 network, keep the following in mind:

  • For ACI fabrics, you must configure an L3Out and the external EPG for Cisco Nexus Dashboard data network connectivity in the management tenant.

    Configuring external connectivity in an ACI fabric is described in Cisco APIC Layer 3 Networking Configuration Guide.

  • For NDFC fabrics, if the data interface and NDFC’s inband interface are in different subnets, you must add a route on NDFC to reach the Nexus Dashboard's data network address.

    You can add the route from the NDFC UI by navigating to Administration > Customization > Network Preference > In-Band (eth2) , then adding the route and saving.

  • If you specify a VLAN ID for your data interface during setup of the cluster, the host port must be configured as trunk allowing that VLAN.

    However, in most common deployments, you can leave the VLAN ID empty and configure the host port in access mode.

The following two figures show two distinct network connectivity scenarios when connecting the Nexus Dashboard cluster to the fabrics via a Layer 3 network. The primary purpose of each depends on the type of application you may be running in your Nexus Dashboard.

Figure 2. Connecting via Layer 3 Network, Day-2 Operations Applications
Figure 3. Connecting via Layer 3 Network, Nexus Dashboard Orchestrator

Connecting Nodes Directly to Leaf Switches

You can also connect the Nexus Dashboard cluster directly to one of the fabrics. This provides easy connectivity between the cluster and in-band management of the fabric, but ties the cluster to the specific fabric and requires reachability to other fabrics to be established through external connectivity. This also makes the cluster dependent on the specific fabric so issues within the fabric may impact Nexus Dashboard connectivity. Like in the previous example, connectivity depends on the type of applications deployed in the Nexus Dashboard:

  • If you are deploying Nexus Dashboard Orchestrator to manage Cisco ACI fabrics only, you can establish connectivity from the data interface to either the in-band or out-of-band (OOB) interface of each site’s APIC.

  • If you are deploying Nexus Dashboard Insights, you must establish connectivity from the data interface to the in-band interface of each fabric.

    For ACI fabrics, the data interface IP subnet connects to an EPG/BD in the fabric and must have a contract established to the local in-band EPG in the management tenant. We recommend deploying the Nexus Dashboard in the management tenant and in-band VRF. Connectivity to other fabrics is established via an L3Out.

  • If you are deploying Nexus Dashboard Insights with ACI fabrics, the data interface IP address and the ACI fabric's in-band IP address must be in different subnets.

If you plan to connect the cluster directly to the leaf switches, keep the following in mind:

  • If deploying in VMware ESX or Linux KVM, the host must be connected to the fabric via trunk port.

  • If you specify a VLAN ID for your data network during setup of the cluster, the Nexus Dashboard interface and the port on the connected network device must be configured as trunk

    However, in most cases we recommend not assigning a VLAN to the data network, in which case you must configure the ports in access mode.

  • For ACI fabrics:

    • We recommend configuring the bridge domain (BD), subnet, and endpoint group (EPG) for Cisco Nexus Dashboard connectivity in management tenant.

      Because the Nexus Dashboard requires connectivity to the in-band EPG in the in-band VRF, creating the EPG in the management tenant means no route leaking is required.

    • You must create a contract between the fabric's in-band management EPG and Cisco Nexus Dashboard EPG.

    • If several fabrics are monitored with apps on the Nexus Dashboard cluster, L3Out with default route or specific route to other ACI fabric in-band EPG must be provisioned and a contract must be established between the cluster EPG and the L3Out's external EPG.

The following two figures show two distinct network connectivity scenarios when connecting the Nexus Dashboard cluster directly to the fabrics' leaf switches. The primary purpose of each depends on the type of application you may be running in your Nexus Dashboard.

Figure 4. Connecting Directly to Leaf Switches, Day-2 Operations Applications
Figure 5. Connecting Directly to Leaf Switches, Nexus Dashboard Orchestrator

Node Distribution Across Sites

Nexus Dashboard supports distribution of cluster nodes across multiple sites. The following node distribution recommendations apply to both physical and virtual clusters.


Note


The diagrams in the following sections provide some examples of possible deployment scenarios for physical or virtual Nexus Dashboard cluster nodes. For details on the exact number of nodes required for your specific use case, see the Nexus Dashboard Capacity Planning tool.


Node Distribution for Nexus Dashboard Insights

For Nexus Dashboard Insights, we recommend a centralized, single-site deployment. This service does not gain redundancy benefits from distributed cluster, which could instead expose the cluster to interconnection failures when nodes are in different sites.

Node Distribution for Nexus Dashboard Orchestrator

For Nexus Dashboard Orchestrator, we recommend a distributed cluster. Keep in mind that at least two Nexus Dashboard master nodes are required for the cluster to remain operational, so when deploying a Nexus Dashboard cluster across two sites, we recommend deploying a standby node in the site with the single master node as shown in the following figure:

Figure 6. Node Distribution Across Two Sites for Nexus Dashboard Orchestrator

Node Distribution for Fabric Controller

For Nexus Dashboard Fabric Controller, we recommend a centralized, single-site deployment. This service does not support recovery in case if 2 master node are not available and thus gains no redundancy benefits from distributed cluster, which could instead expose the cluster to interconnection failures when nodes are in different sites.

Services Co-location Use Cases

This section describes a number of recommended deployment scenarios for specific single-service or multiple services co-hosting use cases.


Note


This release does not support co-hosting services in Nexus Dashboard clusters that are deployed in Linux KVM, AWS, Azure, or RHEL. All services co-hosting scenarios below apply for physical or VMware ESX cluster form factors only.


Single Site, Nexus Dashboard Insights and Orchestrator

In a single site scenario with Nexus Dashboard Insights and Orchestrator services, a single Nexus Dashboard cluster can be deployed with both services co-hosted on it.

Figure 7. Single Site, Nexus Dashboard Insights and Orchestrator

Multiple Sites, Single Cluster for Nexus Dashboard Insights and Orchestrator

In a multiple sites scenario with Nexus Dashboard Insights and Orchestrator services, a single Nexus Dashboard cluster can be deployed with both services co-hosted on it. In this case, the nodes can be distributed between the sites, however since the Insights service does not gain redundancy benefits from a distributed cluster and could instead be exposed to interconnection failures when nodes are in different sites, we recommend the deployment option on the left:

Figure 8. Multiple Sites, Single Cluster for Nexus Dashboard Insights and Orchestrator

Multiple Sites, Multiple Clusters for Nexus Dashboard Insights and Orchestrator

In this case, we recommend deploying two Nexus Dashboard cluster, with one of them dedicated to the Nexus Dashboard Orchestrator service using the virtual or cloud form factor and the nodes distributed across the sites.

Figure 9. Multiple Sites, Multiple Clusters for Nexus Dashboard Insights and Orchestrator

Pre-Installation Checklist

Before you proceed with deploying your Nexus Dashboard cluster, prepare the following information for easy reference during the process:

Table 11. Cluster Details

Parameters

Example

Your Entry

Cluster Name

nd-cluster

NTP Server

171.68.38.65

DNS Provider

64.102.6.247 171.70.168.183

DNS Search Domain

cisco.com

App Network

172.17.0.0/16

Service Network

100.80.0.0/16
Table 12. Node Details

Parameters

Example

Your Entry

For physical nodes, CIMC address and login information of the first node

10.195.219.84/24

Username: admin

Password: Cisco1234

For physical nodes, CIMC address and login information of the second node

10.195.219.85/24

Username: admin

Password: Cisco1234

For physical nodes, CIMC address and login information of the third node

10.195.219.86/24

Username: admin

Password: Cisco1234

Password used for each node's rescue-user and the initial GUI password.

We recommend configuring the same password for all nodes in the cluster.

Welcome2Cisco!

Management IP of the first node

192.168.9.172/24

Management Gateway of the first node.

192.168.9.1

Data Network IP of the first node

192.168.6.172/24

Data Network Gateway of the first node

192.168.6.1

(Optional) Data Network VLAN of the first node

101

(Optional) ASN of the first node

63331

(Optional) IP addresses of the first node's BGP Peer(s)

200.11.11.2

or

200:11:11::2

(Optional) ASNs of the first node's BGP Peer(s)

55555

Management IP of the second node

192.168.9.173/24

Management Gateway of the second node.

192.168.9.1

Data Network IP of the second node

192.168.6.173/24

Data Network Gateway of the second node

192.168.6.1

(Optional) Data Network VLAN of the second node

101

(Optional) ASN of the second node

63331

(Optional) IP addresses of the second node's BGP Peer(s)

200.12.12.2

or

200:12:12::2

(Optional) ASNs of the second node's BGP Peer(s)

55555

Management IP of the third node

192.168.9.174/24

Management Gateway of the third node.

192.168.9.1

Data Network IP of the third node

192.168.6.174/24

Data Network Gateway of the third node

192.168.6.1

(Optional) Data Network VLAN of the third node

101

(Optional) ASN of the third node

63331

(Optional) IP addresses of the third node's BGP Peer(s)

200.13.13.2

or

200:13:13::2

(Optional) ASNs of the third node's BGP Peer(s)

55555