Detecting Specific Threats

The following topics explain how to use preprocessors in a network analysis policy to detect specific threats:

Introduction to Specific Threat Detection

You can use several preprocessors in a network analysis policy to detect specific threats to your monitored network, such as Back Orifice attacks, several portscan types, and rate-based attacks that attempt to overwhelm your network with excessive traffic. When the GID Signatures specific to pre-processor is enabled, the Network Analysis Policy on Web will show disabled. However, the pre-processors will be turned on device using the available default settings.

You can also use sensitive data detection, which you configure in an intrusion policy, to detect unsecured transmission of sensitive numerical data.

License Requirements for Specific Threat Detection

FTD License

Threat

Classic License

Protection

Requirements and Prerequisites for Specific Threat Detection

Model Support

Any.

Supported Domains

Any

User Roles

  • Admin

  • Intrusion Admin

Back Orifice Detection

The Firepower System provides a preprocessor that detects the existence of the Back Orifice program. This program can be used to gain admin access to your Windows hosts.

Back Orifice Detection Preprocessor

The Back Orifice preprocessor analyzes UDP traffic for the Back Orifice magic cookie, "*!*QWTY?", which is located in the first eight bytes of the packet and is XOR-encrypted.

The Back Orifice preprocessor has a configuration page, but no configuration options. When it is enabled, you must also enable preprocessor rules for the preprocessor to generate events and, in an inline deployment, drop offending packets.

Table 1. Back Orifice GID:SIDs

Preprocessor rule GID:SID

Description

105:1

Back Orifice traffic detected

105:2

Back Orifice client traffic detected

105:3

Back Orifice server traffic detected

105:4

Back Orifice Snort buffer attack detected

Detecting Back Orifice

Procedure


Step 1

Choose Policies > Access Control, then click Network Analysis Policies or Policies > Access Control > Intrusion, then click Network Analysis Policies.

Note

 
If your custom user role limits access to the first path listed here, use the second path to access the policy.

Step 2

Click Edit (edit icon) next to the policy you want to edit.

If View (View button) appears instead, the configuration belongs to an ancestor domain, or you do not have permission to modify the configuration.

Step 3

Click Settings in the navigation panel.

Step 4

If Back Orifice Detection under Specific Threat Detection is disabled, click Enabled.

Note


There are no user-configurable options for Back Orifice.

Step 5

To save changes you made in this policy since the last policy commit, click Policy Information, then click Commit Changes.

If you leave the policy without committing changes, changes since the last commit are discarded if you edit a different policy.


What to do next

Portscan Detection

A portscan is a form of network reconnaissance that is often used by attackers as a prelude to an attack. In a portscan, an attacker sends specially crafted packets to a targeted host. By examining the packets that the host responds with, the attacker can often determine which ports are open on the host and, either directly or by inference, which application protocols are running on these ports.

By itself, a portscan is not evidence of an attack. In fact, some of the portscanning techniques used by attackers can also be employed by legitimate users on your network. Cisco’s portscan detector is designed to help you determine which portscans might be malicious by detecting patterns of activity.

Portscan Types, Protocols, and Filtered Sensitivity Levels

Attackers are likely to use several methods to probe your network. Often they use different protocols to draw out different responses from a target host, hoping that if one type of protocol is blocked, another may be available.

Table 2. Protocol Types

Protocol

Description

TCP

Detects TCP probes such as SYN scans, ACK scans, TCP connect() scans, and scans with unusual flag combinations such as Xmas tree, FIN, and NULL

UDP

Detects UDP probes such as zero-byte UDP packets

ICMP

Detects ICMP echo requests (pings)

IP

Detects IP protocol scans. These scans differ from TCP and UDP scans because the attacker, instead of looking for open ports, is trying to discover which IP protocols are supported on a target host.

Portscans are generally divided into four types based on the number of targeted hosts, the number of scanning hosts, and the number of ports that are scanned.

Table 3. Portscan Types

Type

Description

Portscan Detection

A one-to-one portscan in which an attacker uses one or a few hosts to scan multiple ports on a single target host.

One-to-one portscans are characterized by:

  • a low number of scanning hosts

  • a single host that is scanned

  • a high number of ports scanned

This option detects TCP, UDP, and IP portscans.

Port Sweep

A one-to-many portsweep in which an attacker uses one or a few hosts to scan a single port on multiple target hosts.

Portsweeps are characterized by:

  • a low number of scanning hosts

  • a high number of scanned hosts

  • a low number of unique ports scanned

This option detects TCP, UDP, ICMP, and IP portsweeps.

Decoy Portscan

A one-to-one portscan in which the attacker mixes spoofed source IP addresses with the actual scanning IP address.

Decoy portscans are characterized by:

  • a high number of scanning hosts

  • a low number of ports that are scanned only once

  • a single (or a low number of) scanned hosts

The decoy portscan option detects TCP, UDP, and IP protocol portscans.

Distributed Portscan

A many-to-one portscan in which multiple hosts query a single host for open ports.

Distributed portscans are characterized by:

  • a high number of scanning hosts

  • a high number of ports that are scanned only once

  • a single (or a low number of) scanned hosts

The distributed portscan option detects TCP, UDP, and IP protocol portscans.

The information that the portscan detector learns about a probe is largely based on seeing negative responses from the probed hosts. For example, when a web client tries to connect to a web server, the client uses port 80/tcp and the server can be counted on to have that port open. However, when an attacker probes a server, the attacker does not know in advance if it offers web services. When the portscan detector sees a negative response (that is, an ICMP unreachable or TCP RST packet), it records the response as a potential portscan. The process is more difficult when the targeted host is on the other side of a device such as a firewall or router that filters negative responses. In this case, the portscan detector can generate filtered portscan events based on the sensitivity level that you select.

Table 4. Sensitivity Levels

Level

Description

Low

Detects only negative responses from targeted hosts. Select this sensitivity level to suppress false positives, but keep in mind that some types of portscans (slow scans, filtered scans) might be missed.

This level uses the shortest time window for portscan detection.

Medium

Detects portscans based on the number of connections to a host, which means that you can detect filtered portscans. However, very active hosts such as network address translators and proxies may generate false positives.

Note that you can add the IP addresses of these active hosts to the Ignore Scanned field to mitigate this type of false positive.

This level uses a longer time window for portscan detection.

High

Detects portscans based on a time window, which means that you can detect time-based portscans. However, if you use this option, you should be careful to tune the detector over time by specifying IP addresses in the Ignore Scanned and Ignore Scanner fields.

This level uses a much longer time window for portscan detection.

Portscan Event Generation

When portscan detection is enabled, you must enable rules with Generator ID (GID) 122 and a Snort ID (SID) from among SIDs 1 through 27 to detect the various portscans and portsweeps.


Note


For events generated by the portscan connection detector, the protocol number is set to 255. Because portscan does not have a specific protocol associated with it by default, the Internet Assigned Numbers Authority (IANA) does not have a protocol number assigned to it. IANA designates 255 as a reserved number, so that number is used in portscan events to indicate that there is not an associated protocol for the event.


Table 5. Portscan Detection SIDs (GID 122)

Portscan Type

Protocol

Sensitivity Level

Preprocessor Rule SID

Portscan Detection

TCP

UDP

ICMP

IP

Low

Medium or High

Low

Medium or High

Low

Medium or High

Low

Medium or High

1


5

17

21

Does not generate events.


Does not generate events.

9

13

Port Sweep

TCP

UDP

ICMP

IP

Low

Medium or High

Low

Medium or High

Low

Medium or High

Low

Medium or High

3, 27


7

19

23

25

26


11

15

Decoy Portscan

TCP

UDP

ICMP

IP

Low

Medium or High

Low

Medium or High

Low

Medium or High

Low

Medium or High

2


6

18

22


Does not generate events.

Does not generate events.


10

14

Distributed Portscan

TCP

UDP

ICMP

IP

Low

Medium or High

Low

Medium or High

Low

Medium or High

Low

Medium or High

4

8


20

24

Does not generate events.

Does not generate events.

12

16

Portscan Event Packet View

When you enable the accompanying preprocessor rules, the portscan detector generates intrusion events that you can view just as you would any other intrusion event. However, the information presented on the packet view is different from the other types of intrusion events.

Begin by using the intrusion event views to drill down to the packet view for a portscan event. Note that you cannot download a portscan packet because single portscan events are based on multiple packets; however, the portscan packet view provides all usable packet information.

For any IP address, you can click the address to view the context menu and select whois to perform a lookup on the IP address or View Host Profile to view the host profile for that host.

Table 6. Portscan Packet View

Information

Description

Device

The device that detected the event.

Time

The time when the event occurred.

Message

The event message generated by the preprocessor.

Source IP

The IP address of the scanning host.

Destination IP

The IP address of the scanned host.

Priority Count

The number of negative responses (for example, TCP RSTs and ICMP unreachables) from the scanned host. The higher the number of negative responses, the higher the priority count.

Connection Count

The number of active connections on the hosts. This value is more accurate for connection-based scans such as TCP and IP.

IP Count

The number of times that the IP addresses that contact the scanned host changes. For example, if the first IP address is 10.1.1.1, the second IP is 10.1.1.2, and the third IP is 10.1.1.1, then the IP count is 3.

This number is less accurate for active hosts such as proxies and DNS servers.

Scanner/Scanned IP Range

The range of IP addresses for the scanned hosts or the scanning hosts, depending on the type of scan. For portsweeps, this field shows the IP range of scanned hosts. For portscans, this shows the IP range of the scanning hosts.

Port/Proto Count

For TCP and UDP portscans, the number of times that the port being scanned changes. For example, if the first port scanned is 80, the second port scanned is 8080, and the third port scanned is again 80, then the port count is 3.

For IP protocol portscans, the number of times that the protocol being used to connect to the scanned host changes.

Port/Proto Range

For TCP and UDP portscans, the range of the ports that were scanned.

For IP protocol portscans, the range of IP protocol numbers that were used to attempt to connect to the scanned host.

Open Ports

The TCP ports that were open on the scanned host. This field appears only when the portscan detects one or more open ports.

Configuring Portscan Detection

The portscan detection configuration options allow you to finely tune how the portscan detector reports scan activity.

The system builds a separate network map for each leaf domain. In a multidomain deployment, using literal IP addresses to constrain this configuration can have unexpected results. Using override-enabled objects allows descendant domain administrators to tailor Global configurations to their local environments.

Procedure


Step 1

Choose Policies > Access Control, then click Network Analysis Policies or Policies > Access Control > Intrusion, then click Network Analysis Policies.

Note

 
If your custom user role limits access to the first path listed here, use the second path to access the policy.

Step 2

Click Edit (edit icon) next to the policy you want to edit.

If View (View button) appears instead, the configuration belongs to an ancestor domain, or you do not have permission to modify the configuration.

Step 3

Click Settings.

Step 4

If Portscan Detection under Specific Threat Detection is disabled, click Enabled.

Step 5

Click Edit (edit icon) next to Portscan Detection.

Step 6

In the Protocol field, specify protocols to enable.

Note


You must ensure TCP stream processing is enabled to detect scans over TCP, and that UDP stream processing is enabled to detect scans over UDP.

Step 7

In the Scan Type field, specify portscan types you want to detect.

Step 8

Choose a level from the Sensitivity Level list; see Portscan Types, Protocols, and Filtered Sensitivity Levels.

Step 9

If you want to monitor specific hosts for signs of portscan activity, enter the host IP address in the Watch IP field.

You can specify a single IP address or address block, or a comma-separated lists of either or both. Leave the field blank to watch all network traffic.

Step 10

If you want to ignore hosts as scanners, enter the host IP address in the Ignore Scanners field.

You can specify a single IP address or address block, or a comma-separated lists of either or both.

Step 11

If you want to ignore hosts as targets of a scan, enter the host IP address in the Ignore Scanned field.

You can specify a single IP address or address block, or a comma-separated lists of either or both.

Tip


Use the Ignore Scanners and Ignore Scanned fields to indicate hosts on your network that are especially active. You may need to modify this list of hosts over time.

Step 12

If you want to discontinue monitoring of sessions picked up in mid-stream, clear the Detect Ack Scans check box.

Note


Detection of mid-stream sessions helps to identify ACK scans, but may cause false events, particularly on networks with heavy traffic and dropped packets.

Step 13

To save changes you made in this policy since the last policy commit, click Policy Information, then click Commit Changes.

If you leave the policy without committing changes, changes since the last commit are discarded if you edit a different policy.


What to do next

Rate-Based Attack Prevention

Rate-based attacks are attacks that depend on frequency of connection or repeated attempts to perpetrate the attack. You can use rate-based detection criteria to detect a rate-based attack as it occurs and respond to it when it happens, then return to normal detection settings after it stops.

You can configure your network analysis policy to include rate-based filters that detect excessive activity directed at hosts on your network. You can use this feature on managed devices deployed in inline mode to block rate-based attacks for a specified time, then revert to only generating events and not drop traffic.

The SYN attack prevention option helps you protect your network hosts against SYN floods. You can protect individual hosts or whole networks based on the number of packets seen over a period of time. If your device is deployed passively, you can generate events. If your device is placed inline, you can also drop the malicious packets. After the timeout period elapses, if the rate condition has stopped, the event generation and packet dropping stops.

For example, you could configure a setting to allow a maximum number of SYN packets from any one IP address, and block further connections from that IP address for 60 seconds.

You can also limit TCP/IP connections to or from hosts on your network to prevent denial of service (DoS) attacks or excessive activity by users. When the system detects the configured number of successful connections to or from a specified IP address or range of addresses, it generates events on additional connections. The rate-based event generation continues until the timeout period elapses without the rate condition occurring. In an inline deployment you can choose to drop packets until the rate condition times out.

For example, you could configure a setting to allow a maximum of 10 successful simultaneous connections from any one IP address, and block further connections from that IP address for 60 seconds.


Note


Devices load-balance inspection across internal resources. When you configure rate-based attack prevention, you configure the triggering rate per resource, not per device. If rate-based attack prevention is not working as expected, you may need to lower the triggering rate. It triggers alert, if users send too many connection attempts within prescribed time intervals. Hence it is recommended to rate limit the rule. For help determining the correct rate, contact Support.

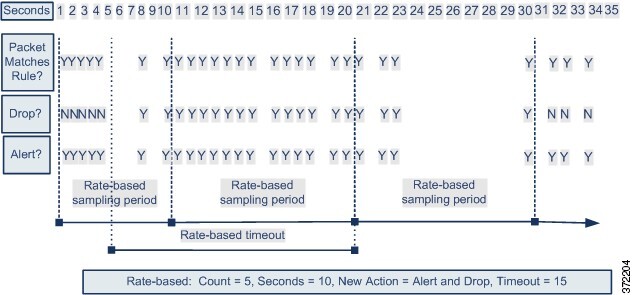
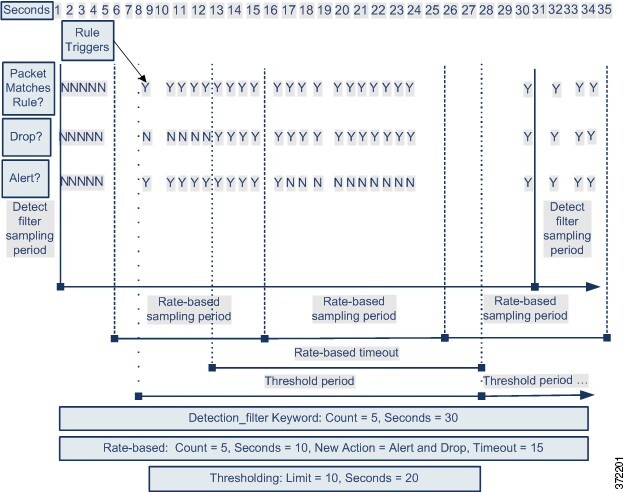
The following diagram shows an example where an attacker is attempting to access a host. Repeated attempts to find a password trigger a rule which has rate-based attack prevention configured. The rate-based settings change the rule attribute to Drop and Generate Events after rule matches occur five times in a 10-second span. The new rule attribute times out after 15 seconds.

After the timeout, note that packets are still dropped in the rate-based sampling period that follows. If the sampled rate is above the threshold in the current or previous sampling period, the new action continues. The new action reverts to generating events only after a sampling period completes where the sampled rate is below the threshold rate.


Diagram illustrating how rate-based filtering works. Once enough packets match the rule, the rule attribute is changed, and times out after the defined timeout period.

Rate-Based Attack Prevention Examples

The detection_filter keyword and the thresholding and suppression features provide other ways to filter either the traffic itself or the events that the system generates. You can use rate-based attack prevention alone or in any combination with thresholding, suppression, or the detection_filter keyword.

The detection_filter keyword, thresholding or suppression, and rate-based criteria may all apply to the same traffic. When you enable suppression for a rule, events are suppressed for the specified IP addresses even if a rate-based change occurs.

detection_filter Keyword Example

The following example shows an attacker attempting a brute-force login. Repeated attempts to find a password trigger a rule that also includes the detection_filter keyword, with a count set to 5. This rule has rate-based attack prevention configured. The rate-based settings change the rule attribute to Drop and Generate Events for 20 seconds when there are five hits on the rule in a 10-second span.

As shown in the diagram, the first five packets matching the rule do not generate events because the rule does not trigger until the rate exceeds the rate indicated by the detection_filter keyword. After the rule triggers, event notification begins, but the rate-based criteria do not trigger the new action of Drop and Generate Events until five more packets pass.

After the rate-based criteria are met, events are generated and the packets are dropped until the rate-based timeout period expires and the rate falls below the threshold. After twenty seconds elapse, the rate-based action times out. After the timeout, note that packets are still dropped in the rate-based sampling period that follows. Because the sampled rate is above the threshold rate in the previous sampling period when the timeout happens, the rate-based action continues.


Diagram illustrating the detection_filter keyword. A rule will not trigger until the defined detection_filter count is met, at which point, rate-based filtering begins.

Note that although the example does not depict this, you can use the Drop and Generate Events rule state in combination with the detection_filter keyword to start dropping traffic when hits for the rule reach the specified rate. When deciding whether to configure rate-based settings for a rule, consider whether setting the rule to Drop and Generate Events and including the detection_filter keyword would achieve the same result, or whether you want to manage the rate and timeout settings in the intrusion policy.

Dynamic Rule State Thresholding or Suppression Example

The following example shows an attacker attempting a brute-force login. Repeated attempts to find a password trigger a rule that has rate-based attack prevention configured. The rate-based settings change the rule attribute to Drop and Generate Events for 15 seconds when there are five hits on the rule in 10 seconds. In addition, a limit threshold limits the number of events the rule can generate to 10 events in 23 seconds.

As shown in the diagram, the rule generates events for the first five matching packets. After five packets, the rate-based criteria trigger the new action of Drop and Generate Events, and for the next five packets the rule generates events and the system drops the packet. After the tenth packet, the limit threshold has been reached, so for the remaining packets the system does not generate events but does drop the packets.

After the timeout, note that packets are still dropped in the rate-based sampling period that follows. If the sampled rate is above the threshold rate in the current or previous sampling period, the new action continues. The new action reverts to Generate Events only after a sampling period completes where the sampled rate is below the threshold rate.


Note that although it is not shown in this example, if a new action triggers because of rate-based criteria after a threshold has been reached, the system generates a single event to indicate the change in action. So, for example, when the limit threshold of 10 is reached and the system stops generating events and the action changes from Generate Events to Drop and Generate Events on the 14th packet, the system generates an eleventh event to indicate the change in action.

Policy-Wide Rate-Based Detection and Thresholding or Suppression Example

The following example shows an attacker attempting denial of service (DoS) attacks on hosts in your network. Many simultaneous connections to hosts from the same sources trigger a policy-wide Control Simultaneous Connections setting. The setting generates events and drops malicious traffic when there are five connections from one source in 10 seconds. In addition, a global limit threshold limits the number of events any rule or setting can generate to 10 events in 20 seconds.

As shown in the diagram, the policy-wide setting generates events for the first ten matching packets and drops the traffic. After the tenth packet, the limit threshold is reached, so for the remaining packets no events are generated but the packets are dropped.

After the timeout, note that packets are still dropped in the rate-based sampling period that follows. If the sampled rate is above the threshold rate in the current or previous sampling period, the rate-based action of generating events and dropping traffic continues. The rate-based action stops only after a sampling period completes where the sampled rate is below the threshold rate.


Diagram illustrating rate-based filtering and thresholding. Once the number of packets matching the rule is met, the new action is applied. Once the threshold limit is reached, the action is still applied, but no new events are generated.

Note that although it is not shown in this example, if a new action triggers because of rate-based criteria after a threshold has been reached, the system generates a single event to indicate the change in action. So, for example, if the limit threshold of 10 has been reached and the system stops generating events and the action changes to Drop and Generate events on the 14th packet, the system generates an eleventh event to indicate the change in action.

Rate-Based Detection with Multiple Filtering Methods Example

The following example shows an attacker attempting a brute force login, and describes a case where a detection_filter keyword, rate-based filtering, and thresholding interact. Repeated attempts to find a password trigger a rule which includes the detection_filter keyword, with a count set to 5. This rule also has rate-based attack prevention settings that change the rule attribute to Drop and Generate Events for 30 seconds when there are five rule hits in 15 seconds. In addition, a limit threshold limits the rule to 10 events in 30 seconds.

As shown in the diagram, the first five packets matching the rule do not cause event notification because the rule does not trigger until the rate indicated in the detection_filter keyword is exceeded. After the rule triggers, event notification begins, but the rate-based criteria do not trigger the new action of Drop and Generate Events until five more packets pass. After the rate-based criteria are met, the system generates events for packets 11-15 and drops the packets. After the fifteenth packet, the limit threshold has been reached, so for the remaining packets the system does not generate events but does drop the packets.

After the rate-based timeout, note that packets are still dropped in the rate-based sampling period that follows. Because the sampled rate is above the threshold rate in the previous sampling period, the new action continues.


Diagram illustrating rate-based filtering, the detection_filter keyword and thresholding. The rule is not applied until the detection_filter value is matched. Once the number of packets match the rule, the action changes. Once the threshold limit is met, the action is applied to the packets, but no more events are generated.

Rate-Based Attack Prevention Options and Configuration

Rate-based attack prevention identifies abnormal traffic patterns and attempts to minimize the impact of that traffic on legitimate requests. Rate-based attacks usually have one of the following characteristics:

  • Any traffic containing excessive incomplete connections to hosts on the network, indicating a SYN flood attack

  • Any traffic containing excessive complete connections to hosts on the network, indicating a TCP/IP connection flood attack

  • Excessive rule matches in traffic going to a particular destination IP address or addresses or coming from a particular source IP address or addresses

  • Excessive matches for a particular rule across all traffic

In a network analysis policy, you can either configure SYN flood or TCP/IP connection flood detection for the entire policy; in an intrusion policy, you can set rate-based filters for individual intrusion or preprocessor rules. Note that you cannot manually add a rate-based filter to GID 135 rules or modify their rule state. Rules with GID 135 use the client as the source value and the server as the destination value.

When SYN Attack Prevention is enabled, rule 135:1 triggers if a defined rate condition is exceeded.

When Control Simultaneous Connections is enabled, rule 135:2 tiggers if a defined rate condition is exceeded, and rule 135:3 triggeres if a session closes or times out.


Important


The precedence of rate based preprocessors is as follows:

TCP SYN Rate based filtering > SI (IP reputation) > TCP Connection Rate based filtering

TCP SYN based rate filtering has the highest priority, but rate-based filtering depends on configuration like sample time and timeout. If there is a drop action, there is no further inspection.


Note


Devices load-balance inspection across internal resources. When you configure rate-based attack prevention, you configure the triggering rate per resource, not per device. If rate-based attack prevention is not working as expected, you may need to lower the triggering rate. It triggers alert, if users send too many connection attempts within prescribed time intervals. Hence it is recommended to rate limit the rule. For help determining the correct rate, contact Support.

Each rate-based filter contains several components:

  • For policy-wide or rule-based source or destination settings, the network address designation

  • The rule matching rate, which you configure as a count of rule matches within a specific number of seconds

  • A new action to be taken when the rate is exceeded

    When you set a rate-based setting for the entire policy, the system generates events when it detects a rate-based attack, and can drop the traffic in an inline deployment. When setting rate-based actions for individual rules, you have three available actions: Generate Events, Drop and Generate Events, and Disable.

  • The duration of the action, which you configure as a timeout value

Note that when started, the new action occurs until the timeout is reached, even if the rate falls below the configured rate during that time period. When the timeout period expires, if the rate has fallen below the threshold, the action for the rule reverts to the action initially configured for the rule. For policy-wide settings, the action reverts to the action of each rule the traffic matches or stops if it does not match any rules.

You can configure rate-based attack prevention in an inline deployment to block attacks, either temporarily or permanently. Without rate-based configuration, rules set to Generate Events create events, but the system does not drop packets for those rules. However, if the attack traffic matches rules that have rate-based criteria configured, the rate action may cause packet dropping to occur for the period of time that the rate action is active, even if those rules are not initially set to Drop and Generate Events.


Note


Rate-based actions cannot enable disabled rules or drop traffic that matches disabled rules. However, if you set a rate-based filter at the policy level, you can generate events on or generate events on and drop traffic that contains an excessive number of SYN packets or SYN/ACK interactions within a designated time period.

You can define multiple rate-based filters on the same rule. The first filter listed in the intrusion policy has the highest priority. Note that when two rate-based filter actions conflict, the system implements the action of the first rate-based filter. Similarly, policy-wide rate-based filters override rate-based filters set on individual rules if the filters conflict.

Rate-Based Attack Prevention, Detection Filtering, and Thresholding or Suppression

The detection_filter keyword prevents a rule from triggering until a threshold number of rule matches occur within a specified time. When a rule includes the detection_filter keyword, the system tracks the number of incoming packets matching the pattern in the rule per timeout period. The system can count hits for that rule from particular source or destination IP addresses. After the rate exceeds the rate in the rule, event notification for that rule begins.

You can use thresholding and suppression to reduce excessive events by limiting the number of event notifications for a rule, a source, or destination, or by suppressing notifications altogether for that rule. You can also configure a global rule threshold that applies to each rule that does not have an overriding specific threshold.

If you apply suppression to a rule, the system suppresses event notifications for that rule for all applicable IP addresses even if a rate-based action change occurs because of a policy-wide or rule-specific rate-based setting.

Configuring Rate-Based Attack Prevention

You can configure rate-based attack prevention at the policy level to stop SYN flood attacks. You can also stop excessive connections from a specific source or to a specific destination.

Procedure


Step 1

Choose Policies > Access Control, then click Network Analysis Policies or Policies > Access Control > Intrusion, then click Network Analysis Policies.

Note

 
If your custom user role limits access to the first path listed here, use the second path to access the policy.

Step 2

Click Edit (edit icon) next to the policy you want to edit.

If View (View button) appears instead, the configuration belongs to an ancestor domain, or you do not have permission to modify the configuration.

Step 3

Click Settings.

Step 4

If Rate-Based Attack Prevention under Specific Threat Detection is disabled, click Enabled.

Step 5

Click Edit (edit icon) next to Rate-Based Attack Prevention.

Step 6

You have two choices:

  • To prevent incomplete connections intended to flood a host, click Add under SYN Attack Prevention.
  • To prevent excessive numbers of connections, click Add under Control Simultaneous Connections.

Step 7

Specify how you want to track traffic:

  • To track all traffic from a specific source or range of sources, choose Source from the Track By drop-down list, and enter a single IP address or address block in the Network field.
  • To track all traffic to a specific destination or range of destinations, choose Destination from the Track By drop-down list, and enter an IP address or address block in the Network field.

    Note

     
    • Do not enter the IP address 0.0.0.0/0 in the Network field to monitor all subnets or IPs. The system does not support this IP address (which is usually used to identify all subnets or IPs) for Rate Based Attack Prevention.

    • The system tracks traffic separately for each IP address included in the Network field. Traffic from an IP address that exceeds the configured rate results in generated events only for that IP address. As an example, you might set a source CIDR block of 10.1.0.0/16 for the network setting and configure the system to generate events when there are ten simultaneous connections open. If eight connections are open from 10.1.4.21 and six from 10.1.5.10, the system does not generate events, because neither source has the triggering number of connections open. However, if eleven simultaneous connections are open from 10.1.4.21, the system generates events only for the connections from 10.1.4.21.

      The system builds a separate network map for each leaf domain. In a multidomain deployment, using literal IP addresses to constrain this configuration can have unexpected results. Using override-enabled objects allows descendant domain administrators to tailor Global configurations to their local environments.

Step 8

Specify the triggering rate for the rate tracking setting:

  • For SYN attack configuration, enter the number of SYN packets per number of seconds in the Rate fields.

  • For simultaneous connection configuration, enter the number of connections in the Count field.

Devices load-balance inspection across internal resources. When you configure rate-based attack prevention, you configure the triggering rate per resource, not per device. If rate-based attack prevention is not working as expected, you may need to lower the triggering rate. It triggers alert, if users send too many connection attempts within prescribed time intervals. Hence it is recommended to rate limit the rule. For help determining the correct rate, contact Support.

Step 9

To drop packets matching the rate-based attack prevention settings, check the Drop check box.

Step 10

In the Timeout field, enter the time period after which to stop generating events (and if applicable, dropping) for traffic with the matching pattern of SYNs or simultaneous connections.

Caution

 
Setting a high timeout value may entirely block connection to a host in an inline deployment.

Step 11

Click OK.

Step 12

To save changes you made in this policy since the last policy commit, click Policy Information, then click Commit Changes.

If you leave the policy without committing changes, changes since the last commit are discarded if you edit a different policy.


What to do next