ASDM Graphical User Interface

This chapter describes how to use the ASDM user interface.

About the ASDM User Interface

The ASDM user interface is designed to provide easy access to the many features that the ASA supports. The ASDM user interface includes the following elements:

  • A menu bar that provides quick access to files, tools, wizards, and help. Many menu items also have keyboard shortcuts.

  • A toolbar that enables you to navigate ASDM. From the toolbar you can access the Home, Configuration, and Monitoring panes. You can also get help and navigate between panes.

  • A dockable left Navigation pane to move through the Configuration and Monitoring panes. You can click one of the three buttons in the header to maximize or restore this pane, make it a floating pane that you can move, hide it, or close it. To access the Configuration and Monitoring panes, you can do one of the following:

    • Click links on the left side of the application window in the left Navigation pane. The Content pane then displays the path (for example, Configuration > Device Setup > Startup Wizard) in the title bar of the selected pane.

    • If you know the exact path, you can type it directly into the title bar of the Content pane on the right side of the application window, without clicking any links in the left Navigation pane.

  • A maximize and restore button in the right corner of the Content pane that lets you hide and show the left Navigation pane.

  • A dockable Device List pane with a list of devices that you can access through ASDM. You can click one of the three buttons in the header to maximize or restore this pane, make it a floating pane that you can move, hide it, or close it.

  • A status bar that shows the time, connection status, user, memory status, running configuration status, privilege level, and SSL status at the bottom of the application window.

  • A left Navigation pane that shows various objects that you can use in the rules tables when you create access rules, NAT rules, AAA rules, filter rules, and service rules. The tab titles within the pane change according to the feature that you are viewing. In addition, the ASDM Assistant appears in this pane.

The following figure shows the elements of the ASDM user interface.
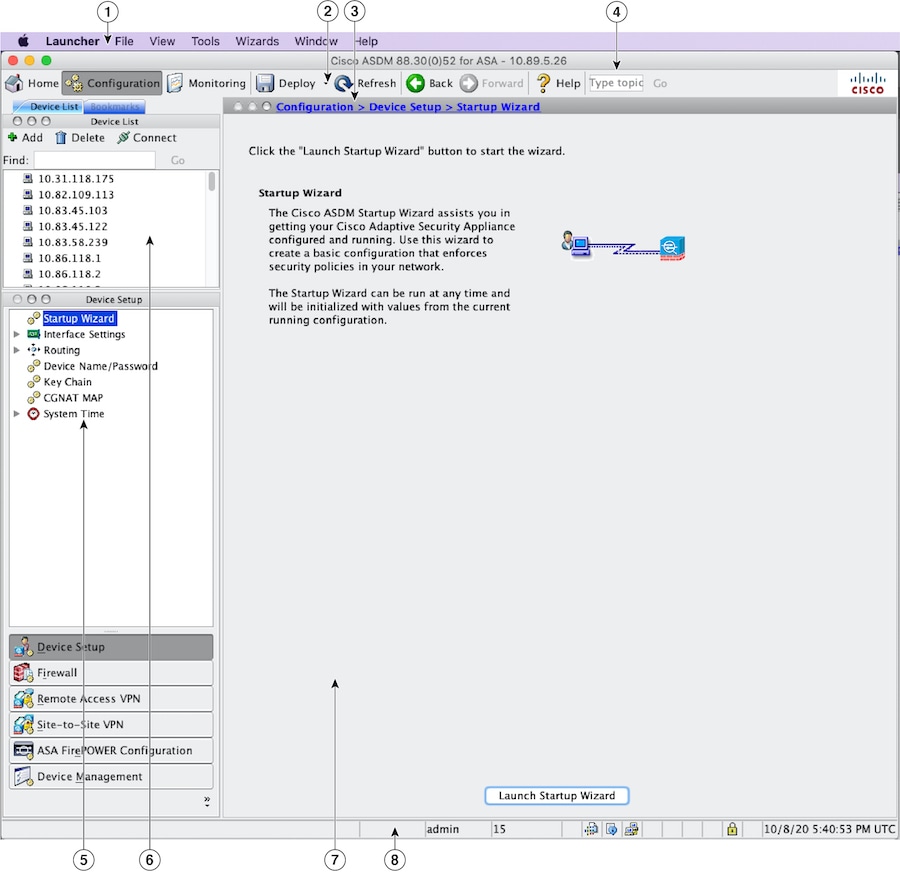
Figure 1. ASDM User Interface

Legend

GUI Element

Description

1

Menu Bar

2

Toolbar

3

Navigation Path

4

Search Field

5

Left Navigation Pane

6

Device List Pane

7

Content Pane

8

Status Bar


Note

Tool tips have been added for various parts of the GUI, including Wizards, the Configuration and Monitoring panes, and the Status Bar. To view tool tips, hover your mouse over a specific user interface element, such as an icon in the status bar.


Navigate the ASDM User Interface

To move efficiently throughout the ASDM user interface, you may use a combination of menus, the toolbar, dockable panes, and the left and right Navigation panes, which are described in the previous section. The available functions appear in a list of buttons below the Device List pane. An example list could include the following function buttons:

  • Device Setup

  • Firewall

  • Botnet Traffic Filter

  • Remote Access VPN

  • Site to Site VPN

  • Device Management

The list of function buttons that appears is based on the licensed features that you have purchased. Click each button to access the first pane in the selected function for either the Configuration view or the Monitoring view. The function buttons are not available in the Home view.

To change the display of function buttons, perform the following steps:

Procedure


Step 1

Choose the drop-down list below the last function button to display a context menu.

Step 2

Choose one of the following options:

  • Click Show More Buttons to show more buttons.

  • Click Show Fewer Buttons to show fewer buttons.

  • Click Add or Remove Buttons to add or remove buttons, then click the button to add or remove from the list that appears.

  • Choose Option to display the Option dialog box, which displays a list of the buttons in their current order. Then choose one of the following:

    • Click Move Up to move up a button in the list.

    • Click Move Down to move down a button in the list.

    • Click Reset to return the order of the items in the list to the default setting.

Step 3

Click OK to save your settings and close this dialog box.


Menus

You can access ASDM menus using the mouse or keyboard.

File Menu

The File menu lets you manage ASA configurations.

File Menu Item

Description

Refresh ASDM with the Running Configuration on the Device

Loads a copy of the running configuration into ASDM.

Reset Device to the Factory Default Configuration

Restores the configuration to the factory default.

Show Running Configuration in New Window

Displays the current running configuration in a new window.

Save Running Configuration to Flash

Writes a copy of the running configuration to flash memory.

Save Running Configuration to TFTP Server

Stores a copy of the current running configuration file on a TFTP server.

Save Running Configuration to Standby Unit

Sends a copy of the running configuration file on the primary unit to the running configuration of a failover standby unit.

Save Internal Log Buffer to Flash

Saves the internal log buffer to flash memory.

Print

Prints the current page. We recommend landscape page orientation when you print rules. When you use Internet Explorer, permission to print was already granted when you originally accepted the signed applet.

Clear ASDM Cache

Removes local ASDM images. ASDM downloads images locally when you connect to ASDM.

Clear ASDM Password Cache

Removes the password cache if you have defined a new password and still have a existing password that is different than the new password.

Clear Internal Log Buffer

Empties the syslog message buffer.

Exit

Closes ASDM.

View Menu

The View menu lets you display various parts of the ASDM user interface. Certain items are dependent on the current view. You cannot select items that cannot be displayed in the current view.

View Menu Item

Description

Home

Displays the Home view.

Configuration

Displays the Configuration view.

Monitoring

Displays the Monitoring view.

Device List

Displays a list of devices in a dockable pane.

Navigation

Shows and hides the display of the Navigation pane in the Configuration and Monitoring views.

ASDM Assistant

Searches and finds useful ASDM procedural help about certain tasks.

Latest ASDM Syslog Messages

Shows and hides the display of the Latest ASDM Syslog Messages pane in the Home view. This pane is only available in the Home view. If you do not have sufficient memory to upgrade to the most current release, syslog message %ASA-1-211004 is generated, indicating what the installed memory is and what the required memory is. This message reappears every 24 hours until the memory is upgraded.

Addresses

Shows and hides the display of the Addresses pane. The Addresses pane is only available for the Access Rules, NAT Rules, Service Policy Rules, AAA Rules, and Filter Rules panes in the Configuration view.

Services

Shows and hides the display of the Services pane. The Services pane is only available for the Access Rules, NAT Rules, Service Policy Rules, AAA Rules, and Filter Rules panes in the Configuration view.

Time Ranges

Shows and hides the display of the Time Ranges pane. The Time Ranges pane is only available for the Access Rules, Service Policy Rules, AAA Rules, and Filter Rules panes in the Configuration view.

Select Next Pane

Highlights the next pane shown in a multi-pane display, for example, going from the Service Policies Rules pane to the Address pane beside it.

Select Previous Pane

Highlights the previous pane shown in multi-pane displays.

Back

Returns to the previous pane.

Forward

Goes to the next pane previously visited.

Find in ASDM

Locates an item for which you are searching, such as a feature or the ASDM Assistant.

Reset Layout

Returns the layout to the default configuration.

Office Look and Feel

Changes the screen fonts and colors to the Microsoft Office settings.

Tools Menu

The Tools menu provides you with the following series of tools to use in ASDM.

Tools Menu Item

Description

Command Line Interface

Sends commands to the ASA and view the results.

Show Commands Ignored by ASDM on Device

Displays unsupported commands that have been ignored by ASDM.

Packet Tracer

Traces a packet from a specified source address and interface to a destination. You can specify the protocol and port of any type of data and view the lifespan of a packet, with detailed information about actions taken on it. See the firewall configuration guide for more information.

Ping

Verifies the configuration and operation of the ASA and surrounding communications links, as well as performs basic testing of other network devices. See the firewall configuration guide for more information.

Traceroute

Determines the route that packets will take to their destination. See the firewall configuration guide for more information.

File Management

Views, moves, copies, and deletes files stored in flash memory. You can also create a directory in flash memory. You can also transfer files between various file systems, including TFTP, flash memory, and your local PC.

Check for ASA/ASDM Updates

Upgrades ASA software and ASDM software through a wizard.

Upgrade Software from Local Computer

Uploads an ASA image, ASDM image, or another image on your PC to flash memory.

Downgrade Software

Loads an older ASA image than the one you are currently running.

Backup Configurations

Backs up the ASA configuration, a Cisco Secure Desktop image, and SSL VPN Client images and profiles.

Restore Configurations

Restores the ASA configuration, a Cisco Secure Desktop image, and SSL VPN Client images and profiles.

System Reload

Restarts the ASDM and reload the saved configuration into memory.

Administrator’s Alert to Clientless SSL VPN Users

Enables an administrator to send an alert message to clientless SSL VPN users. See the VPN configuration guide for more information.

Migrate Network Object Group Members

If you migrate to 8.3 or later, the ASA creates named network objects to replace inline IP addresses in some features. In addition to named objects, ASDM automatically creates non-named objects for any IP addresses used in the configuration. These auto-created objects are identified by the IP address only, do not have a name, and are not present as named objects in the platform configuration.

When the ASA creates named objects as part of the migration, the matching non-named ASDM-only objects are replaced with the named objects. The only exception are non-named objects in a network object group. When the ASA creates named objects for IP addresses that are inside a network object group, ASDM retains the non-named objects as well, creating duplicate objects in ASDM. Choose Tools > Migrate Network Object Group Members to merge these object.

See Cisco ASA 5500 Migration to Version 8.3 and Later for more information.

Preferences

Changes the behavior of specified ASDM functions between sessions.

ASDM Java Console

Shows the Java console.

Wizards Menu

The Wizards menu lets you run a wizard to configure multiple features.

Wizards Menu Item

Description

Startup Wizard

Guides you, step-by-step, through the initial configuration of the ASA.

VPN Wizards

There are separate wizards for a variety of VPN configurations. See the VPN configuration guide for more information.

High Availability and Scalability Wizard

Allows you to configure failover: VPN cluster load balancing, or ASA clustering on the ASA.

Unified Communication Wizard

Enables you to configure unified communication features, such as an IP phone, on the ASA. See the firewall configuration guide for more information.

ASDM Identity Certificate Wizard

When using Java 7 update 51 and later, the ASDM Launcher requires a trusted certificate. An easy approach to fulfill the certificate requirements is to install a self-signed identity certificate. You can use Java Web Start to launch ASDM until you install a certificate using this wizard. See http://www.cisco.com/go/asdm-certificate for more information.

Packet Capture Wizard

Allows you to configure packet capture on the ASA. The wizard runs one packet capture on each ingress and egress interface. After you run the capture, you can save it on your computer, and then examine and analyze the capture with a packet analyzer.

Window Menu

The Window menu enables you to move between ASDM windows. The active window appears as the selected window.

Help Menu

The Help menu provides links to online help, as well as information about ASDM and the ASA.

Help Menu Items

Description

Help Topics

Opens a new browser window to show the ASDM online help. If you are managing an ASA FirePOWER module in ASDM, this item is labeled ASDM Help Topics.

ASA FirePOWER Help Topics

Opens a new browser window to show online help for the ASA FirePOWER module. This item is available only if you have installed the module and are managing it in ASDM.

Help for Current Screen

Opens context-sensitive help about the screen you are viewing. Alternatively, you can also click the ? Help button in the tool bar.

Release Notes

Opens the most current version of the ASDM release notes on Cisco.com. The release notes contain the most current information about ASDM software and hardware requirements, and the most current information about changes in the software.

Cisco ASA Series Documentation

Opens a document on Cisco.com that includes links to all of the available product documentation.

ASDM Assistant

Opens the ASDM Assistant, which lets you search downloadable content from Cisco.com, with details about performing certain tasks.

About Cisco Adaptive Security Appliance (ASA)

Displays information about the ASA, including the software version, hardware set, configuration file loaded at startup, and software image loaded at startup. This information is helpful in troubleshooting.

About Cisco ASDM

Displays information about ASDM such as the software version, hostname, privilege level, operating system, device type, and Java version.

Toolbar

The Toolbar below the menus provides access to the Home view, Configuration view, and Monitoring view. It also lets you choose between the system and security contexts in multiple context mode, and provides navigation and other commonly used features.

Toolbar Button

Description

Home

Displays the Home pane, which lets you view important information about your ASA such as the status of your interfaces, the version you are running, licensing information, and performance. In multiple mode, the system does not have a Home pane.

Configuration

Configures the ASA. Click a function button in the left Navigation pane to configure that function.

Monitoring

Monitors the ASA. Click a function button in the left Navigation pane to monitor various elements.

Save

Saves the running configuration to the startup configuration for write-accessible contexts only.

The button is labeled Save ASA Changes if you have an ASA FirePOWER module installed on the device and you are configuring it through ASDM.

Refresh

Refreshes ASDM with the current running configuration, except for graphs in any of the Monitoring panes.

Back

Returns to the last pane of ASDM that you visited.

Forward

Goes forward to the last pane of ASDM that you visited.

Help

Shows context-sensitive help for the screen that is currently open.

Search

Searches for a feature in ASDM. The Search function looks through the titles of each pane and presents you with a list of matches, and gives you a hyperlink directly to that pane. Click Back or Forward to switch quickly between two different panes that you found.

ASDM Assistant

The ASDM Assistant lets you search and view useful ASDM procedural help about certain tasks. This feature is available in routed and transparent modes, and in the single and system contexts.

ChooseView > ASDM Assistant > How Do I? or enter a search request from the Look For field in the menu bar to access information. Choose How Do I? from the Find drop-down list to begin the search.

To use the ASDM Assistant, perform the following steps:

Procedure


Step 1

Choose View > ASDM Assistant.

The ASDM Assistant pane appears.

Step 2

Enter the information that you want to find in the Search field, then click Go.

The requested information appears in the Search Results pane.

Step 3

Click any links that appear in the Search Results and Features areas to obtain more details.


Status Bar

The Status Bar appears at the bottom of the ASDM window. The following table lists the areas shown from left to right.

Area

Description

Status

The status of the configuration (for example, “Device configuration loaded successfully.”)

Failover

The status of the failover unit, either active or standby.

User Name

The username of the ASDM user. If you logged in without a username, the username is “admin.”

User Privilege

The privilege of the ASDM user.

Commands Ignored by ASDM

Click the icon to show a list of commands from your configuration that ASDM did not process. These commands will not be removed from the configuration.

Connection to Device

The ASDM connection status to the ASA.

Syslog Connection

The syslog connection is up, and the ASA is being monitored.

SSL Secure

The connection to ASDM is secure because it uses SSL.

Time

The time that is set on the ASA.

Connection to Device

ASDM maintains a constant connection to the ASA to maintain up-to-date Monitoring and Home pane data. This dialog box shows the status of the connection. When you make a configuration change, ASDM opens a second connection for the duration of the configuration, and then closes it; however, this dialog box does not represent the second connection.

Device List

The Device List is a dockable pane. You can click one of the three buttons in the header to maximize or restore this pane, make it a floating pane that you can move, hide it, or close it. This pane is available in the Home, Configuration, Monitoring, and System views. You can use this pane to switch to another device, and between the System and contexts; however, that device must run the same version of ASDM that you are currently running. To display the pane fully, you must have at least two devices listed. This pane is available in routed and transparent modes, and in the single, multiple, and system contexts.

To use this pane to connect to another device, perform the following steps:

Procedure


Step 1

Click Add to add another device to the list.

The Add Device dialog box appears.

Step 2

Enter the device name or IP address of the device, then click OK.

Step 3

Click Delete to remove a selected device from the list.

Step 4

Click Connect to connect to another device.

The Enter Network Password dialog box appears.

Step 5

Enter your username and password in the applicable fields, then click Login.


Common Buttons

Many ASDM panes include buttons that are listed in the following table. Click the applicable button to complete the desired task:

Button

Description

Apply

Sends changes made in ASDM to the ASA and applies them to the running configuration.

Save

Writes a copy of the running configuration to flash memory.

Reset

Discards changes and reverts to the information displayed before changes were made or the last time that you clicked Refresh or Apply. After you click Reset, click Refresh to make sure that information from the current running configuration appears.

Restore Default

Clears the selected settings and returns to the default settings.

Cancel

Discards changes and returns to the previous pane.

Enable

Displays read-only statistics for a feature.

Close

Closes an open dialog box.

Clear

Remove information from a field, or remove a check from a check box.

Back

Returns to the previous pane.

Forward

Goes to the next pane.

Help

Displays help for the selected pane or dialog box.

Keyboard Shortcuts

You can use the keyboard to navigate the ASDM user interface.

The following table lists the keyboard shortcuts you can use to move across the three main areas of the ASDM user interface.

Table 1. Keyboard Shortcuts Within the Main Window

To display the

Windows/Linux

MacOS

Home Pane

Ctrl+H

Shift+Command+H

Configuration Pane

Ctrl+G

Shift+Command+G

Monitoring Pane

Ctrl+M

Shift+Command+M

Help

F1

Command+?

Back

Alt+Left Arrow

Command+[

Forward

Alt+Rightarrow

Command+]

Refresh the display

F5

Command+R

Cut

Ctrl+X

Command+X

Copy

Ctrl+C

Command+C

Paste

Ctrl+V

Command+V

Save the configuration

Ctrl+S

Command+S

Popup menus

Shift+F10

Close a secondary window

Alt+F4

Command+W

Find

Ctrl+F

Command+F

Exit

Alt+F4

Command+Q

Exit a table or text area

Ctrl_Shift or Ctrl+Shift+Tab

Ctril+Shift or Ctrl+Shift+Tab

The following table lists the keyboard shortcut you can use to navigate within a pane.

Table 2. Keyboard Shortcuts Within a Pane

To move the focus to the

Press

Next field

Tab

Previous field

Shift+Tab

Next field when the focus is in a table

Ctrl+Tab

Previous field when the focus is in a table

Shift+Ctrl+Tab

Next tab (when a tab has the focus)

Right Arrow

Previous tab (when a tab has the focus)

Left Arrow

Next cell in a table

Tab

Previous sell in a table

Shift+Tab

Next pane (when multiple panes are displayed)

F6

Previous pane (when multiple panes are displayed)

Shift+F6

The following table lists the keyboard shortcuts you can use with the Log Viewers.

Table 3. Keyboard Shortcuts for the Log Viewer

To

Windows/Linux

MacOS

Pause and Resume Real-Time Log Viewer

Ctrl+U

Command+

Refresh Log Buffer Pane

F5

Command+R

Clear Internal Log Buffer

Ctrl+Delete

Command+Delete

Copy Selected Log Entry

Ctrl+C

Command+C

Save Log

Ctrl+S

Command+S

Print

Ctrl+P

Command+P

Close a secondary window

Alt+F4

Command+W

The following table lists the keyboard shortcuts you can use to access menu items.

Table 4. Keyboard Shortcuts to Access Menu Items

To access the

Windows/Linux

Menu Bar

Alt

Next Menu

Right Arrow

Previous Menu

Left Arrow

Next Menu Option

Down Arrow

Previous Menu Option

Up Arrow

Selected Menu Option

Enter

Find Function in ASDM Panes

Some ASDM panes contain tables with many elements. To make it easier for you to search, highlight, and then edit a particular entry, several ASDM panes have a find function that allows you to search on objects within those panes.

To perform a search, you can type a phrase into the Find field to search on all columns within any given pane. The phrase can contain the wild card characters “*” and “?”. The * matches one or more characters, and ? matches one character. The up and down arrows to the right of the Find field locate the next (up) or previous (down) occurrence of the phrase. Check the Match Case check box to find entries with the exact uppercase and lowercase characters that you enter.

For example, entering B*ton-L* might return the following matches:


Boston-LA, Boston-Lisbon, Boston-London

Entering Bo?ton might return the following matches:


Boston, Bolton

Find Function in Rule Lists

Because ACLs and ACEs and other rules contain many elements of different types, the find function in the any pane that displays rules allows for a more targeted search than the find function in other panes. This includes access rules, service policy rules, the ACL Manager, and any other pane that lists ACL rules, and also the NAT rules.

To find elements within the rule lists, perform the following steps:

Procedure


Step 1

Click Find.

Step 2

Choose one of the following options in the Filter field from the drop-down list.

The items you can search on differ depending on the rule type, and correspond to the columns in the table. Select Query if you want to create a complex search that uses more than one field.

Step 3

Unless you picked Query, in the second field, choose one of the following options from the drop-down list:

  • is—Specifies an exact match to the search string. This is always the option for queries.

  • contains—Specifies a match to any rule that includes, whether exactly or partially, your search string.

Step 4

In the third field, enter the string you want to find. Click ... to pick an object from a list. If you are using a query, click Define Query.

If you search for an IP address, you can get matches to addresses that are in a network object or group, so long as that object or group was created by ASDM. That is, the group name begins with DM_INLINE. The find feature cannot find IP addresses within user-created objects.

Step 5

Click Filter to perform the search.

The view is updated to show only those rules that match. The rule numbers are maintained so that you can see their absolute location within the rule list.

Step 6

Click Clear to remove the filter and see the complete list again.

Step 7

When you are finished, click the red x to close the find controls.


Enable Extended Screen Reader Support

By default, labels and descriptions are not included in tab order when you press the Tab key to navigate a pane. Some screen readers, such as JAWS, only read screen objects that have the focus. You can include the labels and descriptions in the tab order by enabling extended screen reader support.

To enable extended screen reader support, perform the following steps:

Procedure


Step 1

Choose Tools  > Preferences.

The Preferences dialog box appears.

Step 2

Check the Enable screen reader support check box on the General tab.

Step 3

Click OK.

Step 4

Restart ASDM to activate screen reader support.


Organizational Folder

Some folders in the navigation pane for the configuration and monitoring views do not have associated configuration or monitoring panes. These folders are used to organize related configuration and monitoring tasks. Clicking these folders displays a list of sub-items in the right Navigation pane. You can click the name of a sub-item to go to that item.

Home Pane (Single Mode and Context)

The ASDM Home pane lets you view important information about your ASA. Status information in the Home pane is updated every ten seconds. This pane usually has two tabs: Device Dashboard and Firewall Dashboard.

If you have hardware or software modules installed on the device, such as IPS, CX, or ASA FirePOWER modules, there are separate tabs for those modules.

Device Dashboard Tab

The Device Dashboard tab lets you view, at a glance, important information about your ASA, such as the status of your interfaces, the version you are running, licensing information, and performance.

The following figure shows the elements of the Device Dashboard tab.

Figure 2. Device Dashboard Tab

Legend

GUI Element

Description

1

Device Information Pane

2

Interface Status Pane

3

VPN Sessions Pane

4

Traffic Status Pane

5

System Resources Status Pane

6

Traffic Status Pane

Device List

Latest ASDM Syslog Messages Pane

Device Information Pane

The Device Information pane includes two tabs that show device information: General tab and License tab. Under the General tab you have access to the Environment Status button, which provides an at-a-glance view of the system health:

General Tab

This tab shows basic information about the ASA:

  • Host name—Shows the hostname of the device.

  • ASA version—Lists the version of ASA software that is running on the device.

  • ASDM version—Lists the version of ASDM software that is running on the device.

  • Firewall mode—Shows the firewall mode in which the device is running.

  • Total flash—Displays the total RAM that is currently being used.

  • ASA Cluster Role—When you enable clustering, shows the role of this unit, either Master or Slave.

  • Device uptime—Shows the time in which the device has been operational since the latest software upload.

  • Context mode—Shows the context mode in which the device is running.

  • Total Memory—Shows the DRAM installed on the ASA.

  • Environment status—Shows the system health. View hardware statistics by clicking the plus sign (+) to the right of the Environment Status label in the General tab. You can see how many power supplies are installed, track the operational status of the fan and power supply modules, and track the temperatures of the CPUs and the ambient temperature of the system.

    In general, the Environment Status button provides an at-a-glance view of the system health. If all monitored hardware components within the system are operating within normal ranges, the plus sign (+) button shows OK in green. Conversely, if any one component within the hardware system is operating outside of normal ranges, the plus sign (+) button turns into a red circle to show Critical status and to indicate that a hardware component requires immediate attention.

    See the hardware guide for your particular device for more information about specific hardware statistics.


Note

If you do not have enough memory to upgrade to the most current release of the ASA, the Memory Insufficient Warning dialog box appears. Follow the directions that appear in this dialog box to continue using the ASA and ASDM in a supported manner. Click OK to close this dialog box.


License Tab

This tab shows a subset of licensed features. Click More Licenses to view detailed license information, or to enter a new activation key; the Configuration > Device Management > Licensing > Activation Key pane appears.

Cluster Tab

This tab shows the cluster interface mode, as well as the cluster status

Virtual Resources Tab (ASAv)

This tab shows the virtual resources used by the ASAv, including the number of vCPUs, RAM, and whether the ASAv is over- or under-provisioned.

Interface Status Pane

This pane shows the status of each interface. If you select an interface row, the input and output throughput in Kbps displays below the table.

VPN Sessions Pane

This pane shows the VPN tunnel status. Click Details to go to the Monitoring > VPN > VPN Statistics > Sessions pane.

Failover Status Pane

This pane shows the failover status.

Click Configure to start the High Availability and Scalability Wizard. After you have completed the wizard, the failover configuration status (either Active/Active or Active/Standby) appears.

If failover is configured, click Details to open the Monitoring > Properties > Failover > Status pane.

System Resources Status Pane

This pane shows CPU and memory usage statistics.

Traffic Status Pane

This pane shows graphs for connections per second for all interfaces and for the traffic throughput of the lowest security interface.

When your configuration contains multiple lowest security level interfaces, and any one of them is named “outside,” then that interface is used for the traffic throughput graphs. Otherwise, ASDM picks the first interface from the alphabetical list of lowest security level interfaces.

Latest ASDM Syslog Messages Pane

This pane shows the most recent system messages generated by the ASA, up to a maximum of 100 messages. Click Enable Logging to enable logging if it is disabled.

The following figure shows the elements of the Latest ASDM Syslog Messages pane.

Figure 3. Latest ASDM Syslog Messages Pane
Legend

GUI Element

Description

1

Drag the divider up or down to resize the pane.

2

Expands the pane. Click the double-square icon to return the pane to the default size.

3

Makes a floating pane. Click the docked pane icon to dock the pane.

4

Enables or disables Auto-hide. When Auto-hide is enabled, move your cursor over the Latest ASDM Syslog Messages button in the left, bottom corner and the pane displays. Move your cursor away from the pane, and it disappears.

5

Closes the pane. Choose View Latest ASDM Syslog Messages to show the pane.

6

Click the green icon on the right-hand side to continue updating the display of syslog messages.

7

Click the red icon on the right-hand side To stop updating the display of syslog messages.

8

Click the filters icon on the right-hand side to open the Logging Filters pane.

  • Right-click an event and choose Clear Content to clear the current messages.

  • Right-click an event and click Save Content to save the current messages to a file on your PC.

  • Right-click an event and choose Copy to copy the current content.

  • Right-click an event and choose Color Settings to change the background and foreground colors of syslog messages according to their severity.

Firewall Dashboard Tab

The Firewall Dashboard tab lets you view important information about the traffic passing through your ASA. This dashboard differs depending on whether you are in single context mode or multiple context mode. In multiple context mode, the Firewall Dashboard is viewable within each context.

The following figure shows some of the elements of the Firewall Dashboard tab.

Figure 4. Firewall Dashboard Tab

Legend

GUI Element

Description

1

Traffic Overview Pane

2

Top 10 Access Rules Pane

3

Top Usage Status Pane

(not shown)

Top Ten Protected Servers Under SYN Attack Pane

(not shown)

Top 200 Hosts Pane

(not shown)

Top Botnet Traffic Filter Hits Pane

Traffic Overview Pane

Enabled by default. If you disable basic threat detection (see the firewall configuration guide), then this area includes an Enable button that lets you enable basic threat detection. The runtime statistics include the following information, which is display-only:

  • The number of connections and NAT translations.

  • The rate of dropped packets per second caused by access list denials and application inspections.

  • The rate of dropped packets per second that are identified as part of a scanning attack, or that are incomplete sessions detected, such as TCP SYN attack detected or no data UDP session attack detected.

Top 10 Access Rules Pane

Enabled by default. If you disable threat detection statistics for access rules (see the firewall configuration guide), then this area includes an Enable button that lets you enable statistics for access rules.

In the Table view, you can select a rule in the list and right-click the rule to display a popup menu item, Show Rule. Choose this item to go to the Access Rules table and select that rule in this table.

Top Usage Status Pane

Disabled by default. This pane include the following four tabs:

  • Top 10 Services—Threat Detection service

  • Top 10 Sources—Threat Detection service

  • Top 10 Destinations—Threat Detection service

  • Top 10 Users—Identity Firewall service

The first three tabs—Top 10 Services, Top 10 Sources, and Top 10 Destinations—provide statistics for threat detection services. Each tab includes an Enable button that let you enable each threat detection service. You can enable them according to the firewall configuration guide.

The Top 10 Services Enable button enables statistics for both ports and protocols (both must be enabled for the display). The Top 10 Sources and Top 10 Destinations Enable buttons enable statistics for hosts. The top usage status statistics for hosts (sources and destinations), and ports and protocols are displayed.

The fourth tab for Top 10 Users provides statistics for the Identity Firewall service. The Identity Firewall service provides access control based on users’ identities. You can configure access rules and security policies based on user names and user groups name rather than through source IP addresses. The ASA provides this service by accessing an IP-user mapping database.

The Top 10 Users tab displays data only when you have configured one of the following features:

  • Identity Firewall service configuration, which includes configuring these additional components: Microsoft Active Directory and Cisco Active Directory (AD) Agent. The Identity Firewall service is enabled using the user-identity enable command (enabled by default) and the user-accounting statistics command.

  • VPN configuration using a RADIUS server for authenticating, authorizing, or accounting VPN users.

Depending on which option you choose, the Top 10 Users tab shows statistics for received EPS packets, sent EPS packets, and sent attacks for the top 10 users. For each user (displayed as domain \user_name ), the tab displays the average EPS packet, the current EPS packet, the trigger, and total events for that user.


Caution

Enabling statistics can affect the ASA performance, depending on the type of statistics enabled. Enabling statistics for hosts affects performance in a significant way; if you have a high traffic load, you might consider enabling this type of statistics temporarily. Enabling statistics for ports, however, has a modest effect.


Top Ten Protected Servers Under SYN Attack Pane

Disabled by default. This area includes an Enable button that lets you enable the feature, or you can enable it according to the firewall configuration guide. Statistics for the top ten protected servers under attack are displayed.

For the average rate of attack, the ASA samples the data every 30 seconds over the rate interval (by default 30 minutes).

If there is more than one attacker, then “<various>” displays, followed by the last attacker IP address.

Click Detail to view statistics for all servers (up to 1000) instead of just 10 servers. You can also view history sampling data. The ASA samples the number of attacks 60 times during the rate interval, so for the default 30-minute period, statistics are collected every 60 seconds.

Top 200 Hosts Pane

Disabled by default. Shows the top 200 hosts connected through the ASA. Each entry of a host contains the IP address of the host and the number of connections initiated by the host, and is updated every 120 seconds. Enter the hpm topnenable command to enable this display.

Top Botnet Traffic Filter Hits Pane

Disabled by default. This area includes links to configure the Botnet Traffic Filter. Reports of the top ten botnet sites, ports, and infected hosts provide a snapshot of the data, and may not match the top ten items since statistics started to be collected. If you right-click an IP address, you can invoke the whois tool to learn more about the botnet site.

See the Botnet configuration guide for more information.

Cluster Dashboard Tab

When you enable ASA clustering and are connected to the master unit, the Cluster Dashboard tab shows a summary of cluster membership and resource utilization.

  • Cluster Members—Shows the names and basic information about the members comprising the cluster (their management IP address, version, role in the cluster, and so on) and their health status (environment status, health status, and resource utilization).


    Note

    In multiple context mode, if you connect ASDM to the admin context, and then change to a different context, the management IP address listed does not change to show the current context management IP addresses; it continues to show the admin context management IP addresses, including the main cluster IP address to which ASDM is currently connected.


  • System Resource Status—Shows resource utilization (CPU and memory) across the cluster and traffic graphs, both cluster-wide and per-device.

  • Traffic Status—Each tab has the following graphs.

    • Connections Per Second tab:

      Cluster Overall—Shows the connections per second throughout the cluster.

      Per-Member Total—Shows the average connections per second for each member.

    • Throughput tab:

      Cluster Overall—Shows the aggregated egress throughput throughout the cluster.

      Per-Member Throughput—Shows the member throughput, one line per member.

    • Load Balancing tab:

      Per-Member Percentage of Total Traffic—For each member, shows the percentage of total cluster traffic that the member receives.

      Per-Member Locally Processed Traffic—For each member, shows the percentage of traffic that was processed locally.

    • Control Link Usage tab:

      Per-Member Receival Capacity Utilization—For each member, shows the usage of the transmittal capacity.

      Per-Member Transmittal Capacity Utilization—For each member, shows the usage of the receival capacity.

Cluster Firewall Dashboard Tab

The Cluster Firewall Dashboard tab shows traffic overview and the “top N” statistics, similar to those shown in the Firewall Dashboard, but aggregated across the whole cluster.

Content Security Tab

The Content Security tab lets you view important information about the Content Security and Control (CSC) SSM. This pane appears only if CSC software running on the CSC SSM is installed in the ASA.


Note

If you have not completed the CSC Setup Wizard by choosing Configuration > Trend Micro Content Security > CSC Setup, you cannot access the panes under Home > Content Security. Instead, a dialog box appears and lets you access the CSC Setup Wizard directly from this location.


The following figure shows the elements of the Content Security tab.

Figure 5. Content Security Tab

Legend

GUI Element

Description

1

CSC SSM Information pane.

2

Threat Summary pane. Shows aggregated data about threats detected by the CSC SSM, including the following threat types: Virus, Spyware, URL Filtered or Blocked, Spam. Blocked, Files Blocked, and Damage Control Services.

3

System Resources Status pane.

4

Email Scan pane. The graphs display data in ten-second intervals.

5

Latest CSC Security Events pane.

Intrusion Prevention Tab

The Intrusion Prevention tab lets you view important information about IPS. This tab appears only when you have an IPS module installed on the ASA.

To connect to the IPS module, perform the following steps:

  1. Click the Intrusion Prevention tab.

    The Connecting to IPS dialog box appears.

  2. Enter the IP address, port, username and password. The default IP address and port is 192.168.1.2:443. The default username and password is cisco and cisco.

  3. Check the Save IPS login information on local host check box to save the login information on your local PC.

  4. Click Continue.

See the IPS quick start guide for more information about intrusion prevention.

The following figure shows the elements of the Health Dashboard tab, located on the Intrusion Prevention tab.

Figure 6. Intrusion Prevention Tab (Health Dashboard)

Legend

GUI Element

Description

1

Sensor Information pane.

2

Sensor Health pane.

3

CPU, Memory, and Load pane.

4

Interface Status pane.

5

Licensing pane.

ASA CX Status Tab

The ASA CX Status tab lets you view important information about the ASA CX module. This tab appears only when you have an ASA CX module installed on the ASA.

ASA FirePower Status Tabs

The ASA FirePOWER Status tab lets you view information about the module. This includes module information, such as the model, serial number, and software version, and module status, such as the application name and status, data plane status, and overall status. If the module is registered to a FireSIGHT Management Center, you can click the link to open the application and do further analysis and module configuration.

This tab appears only if you have an ASA FirePOWER module installed in the device.

If you are managing the ASA FirePOWER module with ASDM rather than FireSIGHT Management Center, there are additional tabs:

  • ASA FirePOWER Dashboard—The dashboard provides summary information about the software running on the module, product updates, licensing, system load, disk usage, system time, and interface status.

  • ASA FirePOWER Reporting—The reporting page provides Top 10 dashboards for a wide variety of module statistics, such as web categories, users, sources, and destinations for the traffic passing through the module.

Home Pane (System)

The ASDM System Home pane lets you view important status information about your ASA. Many of the details available in the ASDM System Home pane are available elsewhere in ASDM, but this pane shows at-a-glance how your ASA is running. Status information in the System Home pane is updated every ten seconds.

The following figure shows the elements of the System Home pane.

Figure 7. System Home Pane

Legend

GUI Element

Description

1

System vs. Context selection.

2

Interface Status pane. Choose an interface to view the total amount of traffic through the interface.

3

Connection Status pane.

4

CPU Status pane.

5

Memory Status pane.

Define ASDM Preferences

You can define the behavior of certain ASDM settings.

To change various settings in ASDM, perform the following steps:

Procedure


Step 1

Choose Tools > Preferences.

The Preferences dialog box appears, with three tabs: General, Rules Table, and Syslog.

Step 2

To define your settings, click one of these tabs: the General tab to specify general preferences; the Rules Table tab to specify preferences for the Rules table; and the Syslog tab to specify the appearance of syslog messages displayed in the Home pane and to enable the display of a warning message for NetFlow-related syslog messages.

Step 3

On the General tab, specify the following:

  • Check the Warn that configuration in ASDM is out of sync with the configuration in ASA check box to be notified when the startup configuration and the running configuration are no longer in sync with each other.

  • Check the Show configuration restriction message to read-only user check box to display the following message to a read-only user at startup. This option is checked by default.

    
    “You are not allowed to modify the ASA configuration, 
    because you do not have sufficient privileges.”
    
    
  • Check the Show configuration restriction message on a slave unit in an ASA cluster check box to display a configuration restriction message to a user connected to a slave unit.

  • Check the Confirm before exiting ASDM check box to display a prompt when you try to close ASDM to confirm that you want to exit. This option is checked by default.

  • Check the Enable screen reader support (requires ASDM restart) check box to enable screen readers to work. You must restart ASDM to enable this option.

  • Check the Warn of insufficient ASA memory when ASDM loads check box to receive notification when the minimum amount of ASA memory is insufficient to run complete functionality in the ASDM application. ASDM displays the memory warning in a text banner message at bootup, displays a message in the title bar text in ASDM, and sends a syslog alert once every 24 hours.

  • In the Communications area:

    • Check the Preview commands before sending them to the device check box to view CLI commands generated by ASDM.

    • Check the Enable cumulative (batch) CLI delivery check box to send multiple commands in a single group to the ASA.

    • In the Minimum Configuration Sending Timeout field, enter the minimum amount of time in seconds for a configuration to send a timeout message. The default is 60 seconds.

  • In the Logging area:

    • Check the Enable logging to the ASDM Java console check box to configure Java logging.

    • Set the severity level by choosing a Logging Level from the drop-down list.

  • In the Packet Capture Wizard area, to display captured packets, enter the name of the Network Sniffer Application or click Browse to find it in the file system.

Step 4

On the Rules Table tab, specify the following:

  • Display settings let you change the way rules appear in the Rules table.

    • Check the Auto-expand network and service object groups with specified prefix check box to display the network and service object groups automatically expanded based on the Auto-Expand Prefix setting.

    • Enter the prefix of the network and service object groups to expand automatically when displayed in the Auto-Expand Prefix field.

    • Check the Show members of network and service object groups check box to display members of network and service object groups and the group name in the Rules table. If the check box is not checked, only the group name is displayed.

    • Enter the number of network and service object groups to display in the Limit Members To field. When the object group members are displayed, then only the first n members are displayed.

    • Check the Show all actions for service policy rules check box to display all actions in the Rules table. When unchecked, a summary appears.

  • Deployment settings let you configure the behavior of the ASA when deploying changes to the Rules table.

    • Check the Issue “clear xlate” command when deploying access lists check box to clear the NAT table when deploying new access lists. This setting ensures the access lists that are configured on the ASA are applied to all translated addresses.

  • Access Rule Hit Count Settings let you configure the frequency for which the hit counts are updated in the Access Rules table. Hit counts are applicable for explicit rules only. No hit count will be displayed for implicit rules in the Access Rules table.

    • Check the Update access rule hit counts automatically check box to have the hit counts automatically updated in the Access Rules table.

    • Specify the frequency in seconds in which the hit count column is updated in the Access Rules table. Valid values are 10 - 86400 seconds.

Step 5

On the Syslog tab, specify the following:

  • In the Syslog Colors area, you can customize the message display by configuring background or foreground colors for messages at each severity level. The Severity column lists each severity level by name and number. To change the background color or foreground color for messages at a specified severity level, click the corresponding column. The Pick a Color dialog box appears. Click one of the following tabs:

    • Choose a color from the palette on the Swatches tab and click OK.

    • Specify the H, S, and B settings on the HSB tab, and click OK.

    • Specify the Red, Green, and Blue settings on the RGB tab, and click OK.

  • Check the Warn to disable redundant syslog messages when NetFlow action is first applied to the global service policy rule check box in the NetFlow area to enable the display of a warning message to disable redundant syslog messages.

Step 6

After you have specified settings on these three tabs, click OK to save your settings and close the Preferences dialog box.

Note 

Each time that you check or uncheck a preferences setting, the change is saved to the .conf file and becomes available to all the other ASDM sessions running on the workstation at the time. You must restart ASDM for all changes to take effect.


Search with the ASDM Assistant

The ASDM Assistant tool lets you search and view useful ASDM procedural help about certain tasks.

Choose View > ASDM Assistant > How Do I? to access information, or enter a search request from the Look For field in the menu bar. Choose How Do I? From the Find drop-down list to begin the search.

To view the ASDM Assistant, perform the following steps:

Procedure


Step 1

Choose View > ASDM Assistant.

The ASDM Assistant pane appears.

Step 2

Enter the information that you want to find in the Search field, and click Go.

The requested information appears in the Search Results pane.

Step 3

Click any links that appear in the Search Results and Features sections to obtain more details.


Enable History Metrics

The History Metrics pane lets you configure the ASA to keep a history of various statistics, which ASDM can display on any graph/table. If you do not enable history metrics, you can only monitor statistics in real time. Enabling history metrics lets you view statistics graphs from the last 10 minutes, 60 minutes, 12 hours, and 5 days.

To configure history metrics, perform the following steps:

Procedure


Step 1

Choose Configuration > Device Management > Advanced > History Metrics.

The History Metrics pane appears.

Step 2

Check the ASDM History Metrics check box to enable history metrics, then click Apply.


Unsupported Commands

ASDM supports almost all commands available for the ASA, but ASDM ignores some commands in an existing configuration. Most of these commands can remain in your configuration; see Tools > Show Commands Ignored by ASDM on Device for more information.

Ignored and View-Only Commands

The following table lists commands that ASDM supports in the configuration when added through the CLI, but that cannot be added or edited in ASDM. If ASDM ignores the command, it does not appear in the ASDM GUI at all. If the command is view-only, then it appears in the GUI, but you cannot edit it.

Table 5. List of Unsupported Commands

Unsupported Commands

ASDM Behavior

capture

Ignored.

coredump

Ignored. This can be configured only using the CLI.

crypto engine large-mod-accel

Ignored.

dhcp-server (tunnel-group name general-attributes)

ASDM only allows one setting for all DHCP servers.

eject

Unsupported.

established

Ignored.

failover timeout

Ignored.

fips

Ignored.

nat-assigned-to-public-ip

Ignored.

pager

Ignored.

pim accept-register route-map

Ignored. You can configure only the list option using ASDM.

service-policy global

Ignored if it uses a match access-list class. For example:


access-list myacl extended permit ip any any
class-map mycm
  match access-list myacl
policy-map mypm
  class mycm
    inspect ftp
service-policy mypm global

set metric

Ignored.

sysopt nodnsalias

Ignored.

sysopt uauth allow-http-cache

Ignored.

terminal

Ignored.

threat-detection rate

Ignored.

Effects of Unsupported Commands

If ASDM loads an existing running configuration and finds other unsupported commands, ASDM operation is unaffected. Choose Tools > Show Commands Ignored by ASDM on Device to view the unsupported commands.

Discontinuous Subnet Masks Not Supported

ASDM does not support discontinuous subnet masks such as 255.255.0.255. For example, you cannot use the following:


ip address inside 192.168.2.1 255.255.0.255

Interactive User Commands Not Supported by the ASDM CLI Tool

The ASDM CLI tool does not support interactive user commands. If you enter a CLI command that requires interactive confirmation, ASDM prompts you to enter “[yes/no]” but does not recognize your input. ASDM then times out waiting for your response.

For example:

  1. Choose Tools > Command Line Interface.

  2. Enter the crypto key generate rsa command.

    ASDM generates the default 1024-bit RSA key.

  3. Enter the crypto key generate rsa command again.

    Instead of regenerating the RSA keys by overwriting the previous one, ASDM displays the following error:


    Do you really want to replace them? [yes/no]:WARNING: You already have 
    RSA ke0000000000000$A key
    Input line must be less than 16 characters in length.
    
    %Please answer 'yes' or 'no'.
    Do you really want to replace them [yes/no]:
    
    %ERROR: Timed out waiting for a response.
    ERROR: Failed to create new RSA keys names <Default-RSA-key>


Workaround:

  • You can configure most commands that require user interaction by means of the ASDM panes.

  • For CLI commands that have a noconfirm option, use this option when entering the CLI command. For example:

    
    crypto key generate rsa noconfirm