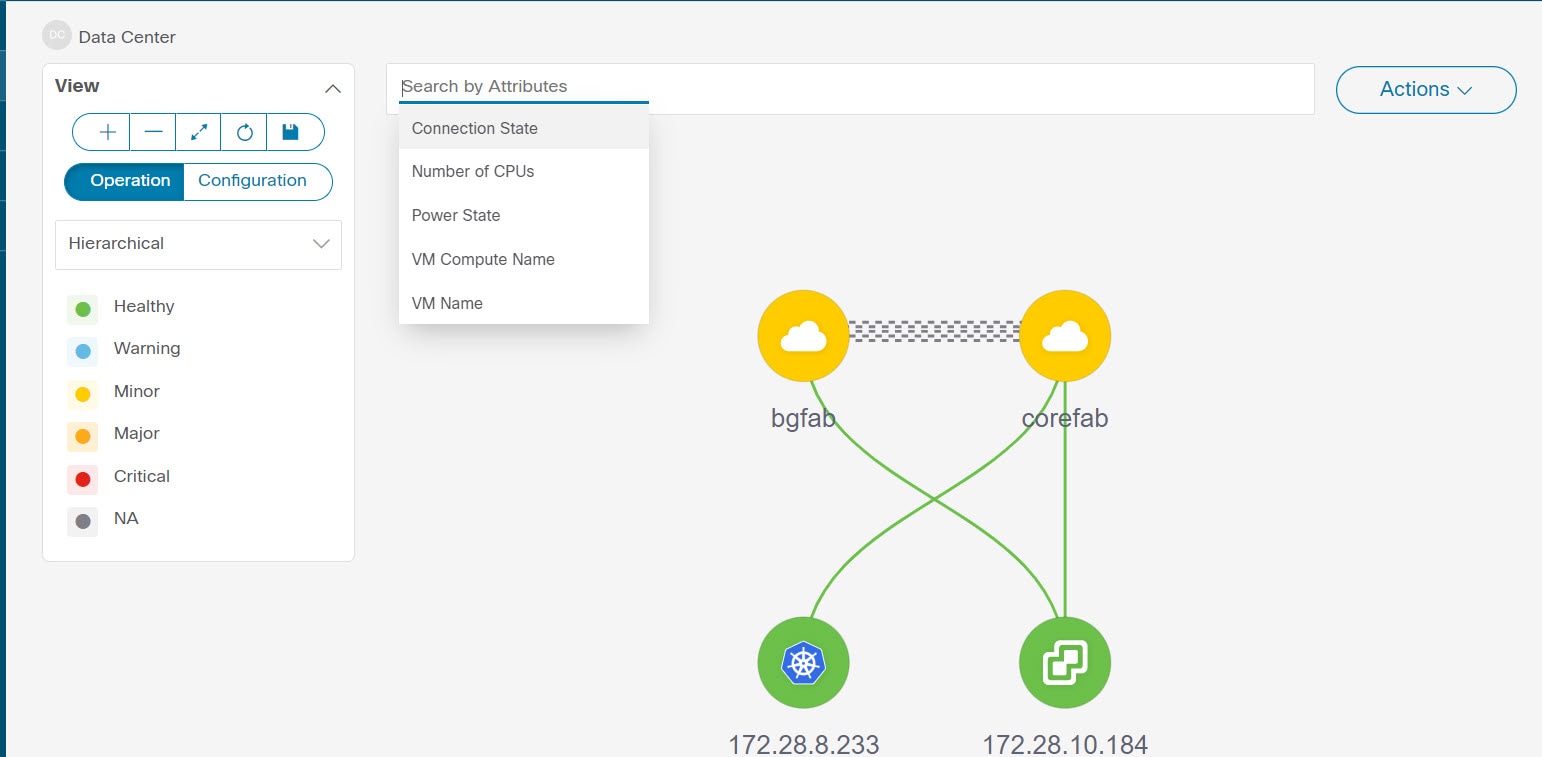
Topology

UI Navigation - Click Topology.

The Topology window displays color-encoded nodes and links that correspond to various network elements, including switches, links, fabric extenders, port-channel configurations, virtual port-channels, and more. Use this window to perform the following tasks:

  • To view more information about each of these elements, hover your cursor over the corresponding element.

  • To view your navigation in the topology, view the breadcrumb at the top.

  • When you click the device or the element, a slide-in pane appears from the right that displays more information about the device or the element. To view more information in the topology, double-click a node to open the node topology. For example, to view the fabric topology and its components in the Topology window, double-click the fabric node and then double-click an element that you want to view such as a host, a multicast group or a multicast flow, as applicable to the fabric type, and view the respective topology.

  • If you want to view the fabric summary for the fabrics, click the fabric node. From the Fabric Summary slide-in pane, open the Fabric Overview window. Alternatively, you can right-click a fabric and choose Detailed View to open the Fabric Overview window. For more information about fabric overview window, see Fabric Overview.

  • Similarly, you can click on a switch to display the configured switch name, IP address, switch model, and other summary information such as status, serial number, health, last-polled CPU utilization, and last-polled memory utilization in the Switch slide-in pane. To view more information, click the Launch icon to open the Switch Overview window. For more information about switch overview window, see Switches.

  • Choose an action from the Actions drop-down list to perform various actions based on the element you select in the topology.

    For example, when you open the data center topology view, the only action available in the actions drop-down list is Add Fabric. However, when you open the fabric topology view, many more options are available in the drop-down list. For example, for LAN fabrics, the available actions are Detailed View, Edit Fabric, Add Switches, Recalculate Config, Preview Config, Deploy Config, Add Link, Deployment Disable, Backup Fabric, Restore Fabric, VXLAN OAM, and Delete Fabric.. Note that for IPFM fabrics, the available actions are Detailed View, Edit Fabric, Add Switches, Recalculate Config, Preview Config, Deploy Config, and Delete Fabric.

  • To perform actions on the elements in the topology, other than the ones listed in the actions drop-down list, right-click the element. This opens the appropriate windows and allows you to perform tasks based on the elements. For example, if you right-click a fabric, you can perform tasks such as various configurations, delete the fabric, backup and restore, and many more.

  • The VXLAN OAM option appears in the Actions drop-down list only for VXLAN Fabric, eBGP VXLAN Fabric, External, and Lan Classic fabric technologies, which support VXLAN OAM. For more instructions, see VXLAN OAM.

The IPFM fabric topology is specific to the operations performed by Nexus Dashboard Fabric Controller IP for Media Fabric (IPFM) and applicable for both the IPFM and Generic Multicast modes .


Note


In a flow topology that involves the Ingress and Egress nodes, the arrows in the node icon indicate the direction of the flow from the Ingress node or sender (indicated by (S)) to the Egress node or receiver (indicated by (R)).


This section contains the following:

Searching Topology

Use a combination of search attributes and search criteria in the search bar for an effective search. As you enter a combination of search attribute and search criteria in the search bar, the corresponding devices are highlighted in the topology.

You can apply the search criteria such as equals (=), does not equal (!=), contains (contains), and does not contain (!contains).

The search attributes that you can use for LAN fabrics are ASN, Fabric Type, Fabric Name, and Fabric technology. The fabric type attributes that you can use for search include switch fabric, multi-fabric domain, external, and LAN monitor. The fabric technology attributes that you can use for search include fabricpath fabric, VXLAN fabric, VLAN fabric, external, LAN classic, IPFM classic, IPFM fabric, switch group, multi-fabric domain, eBGP VXLAN fabric, eBGP routed fabric, MSO site group, meta fabric, LAN monitor fabric, and IOS-XE VXLAN fabric.

For IPFM fabrics, the following fields are available to search on: switch or hostname, switch or host IP address, switch MAC, and switch serial number. In the Generic Multicast mode, also, you can search the receiver-interface name or IP addresses in this window.

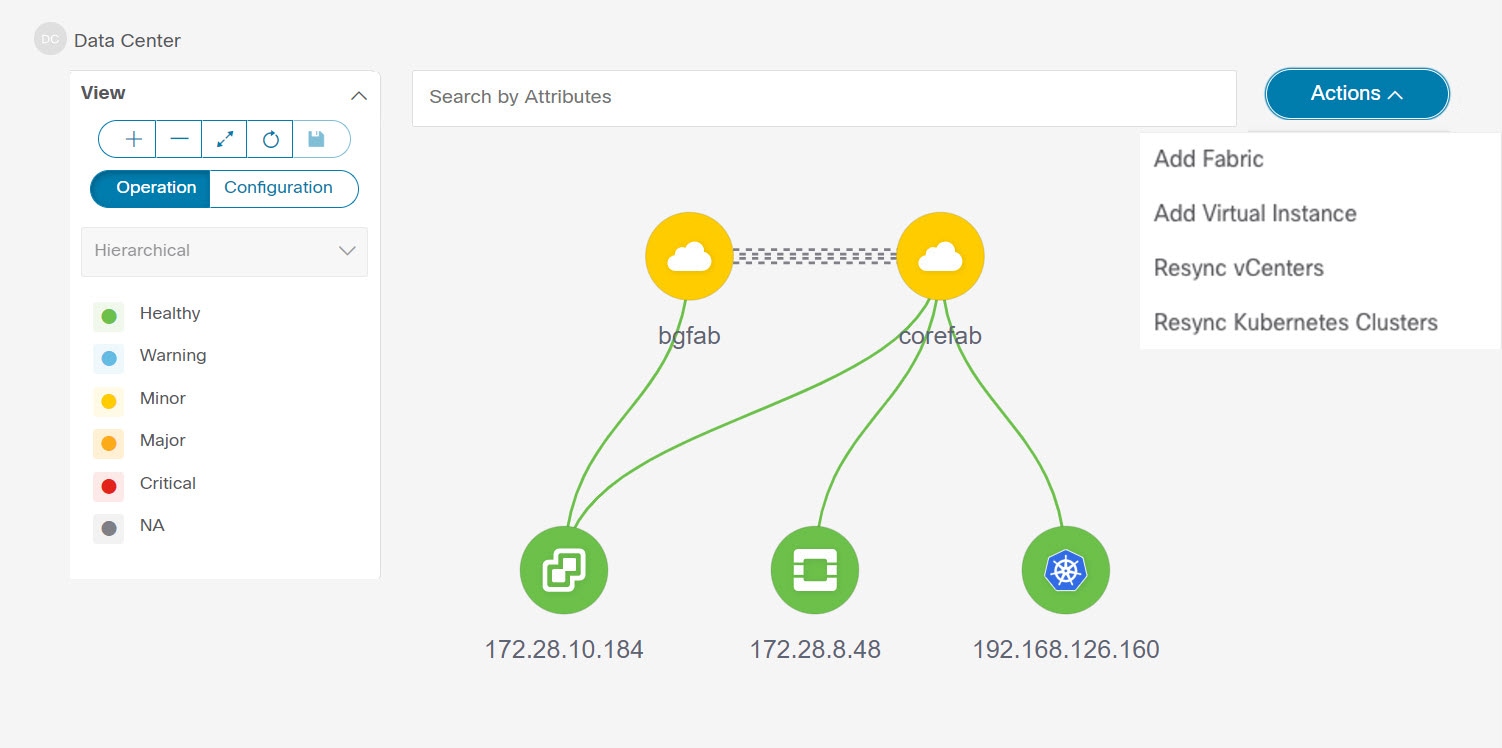
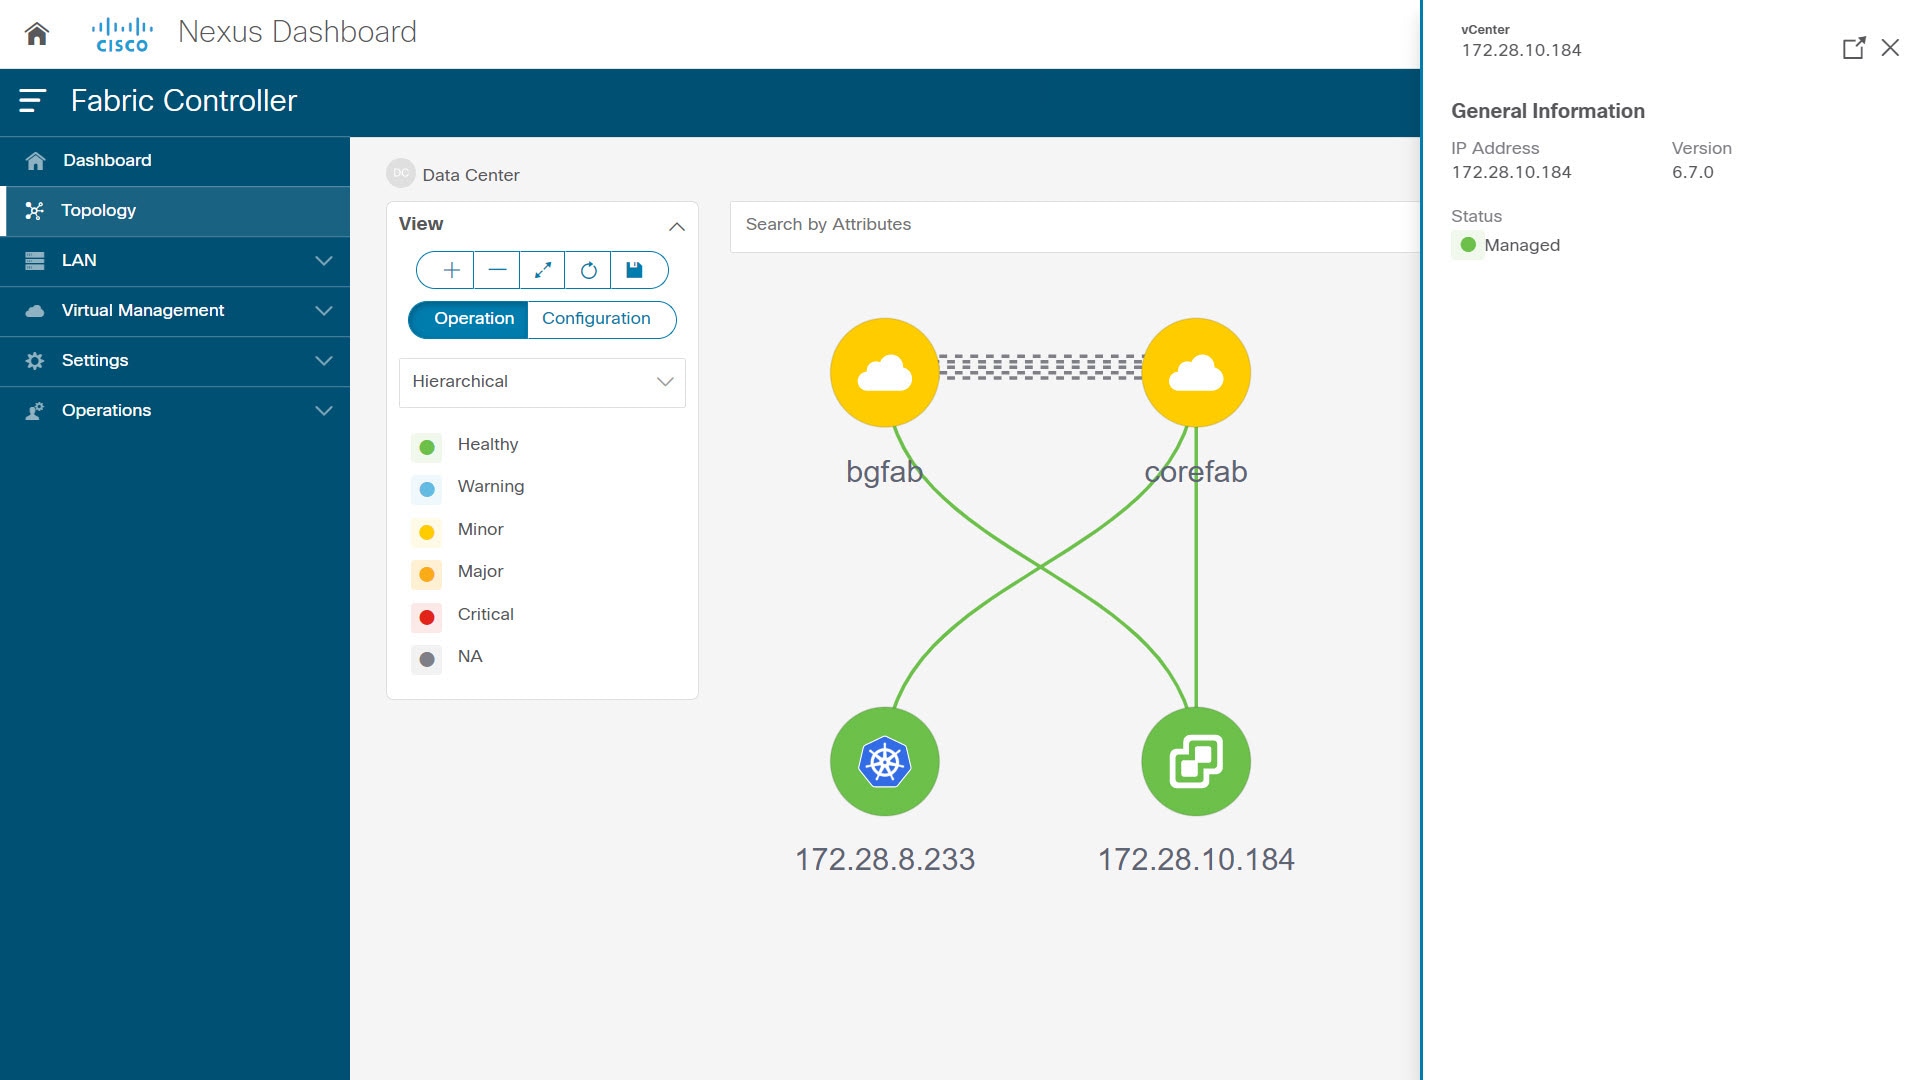
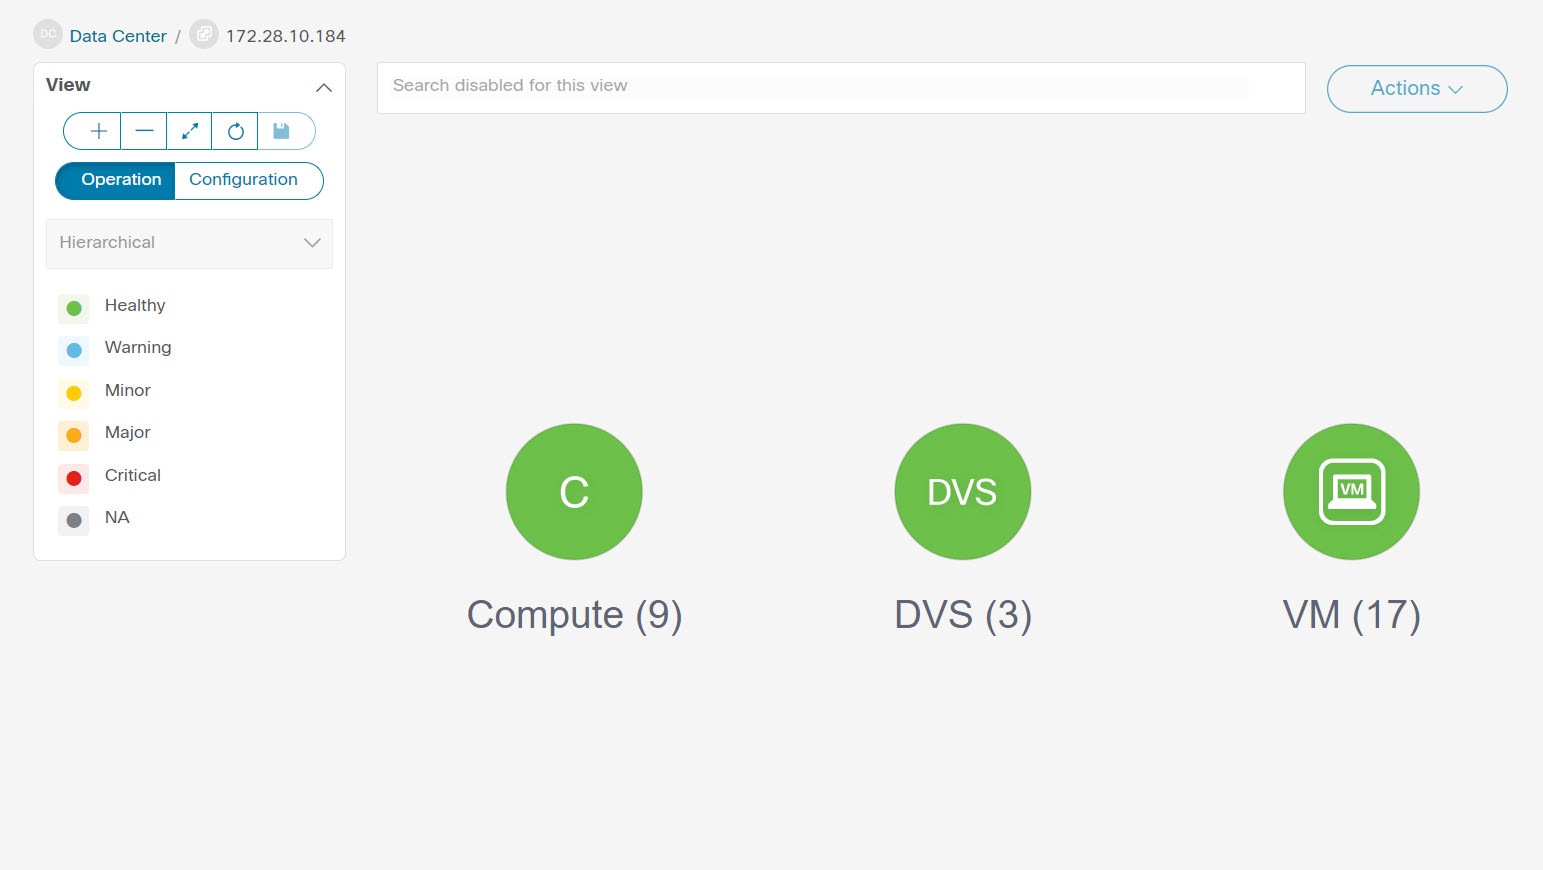
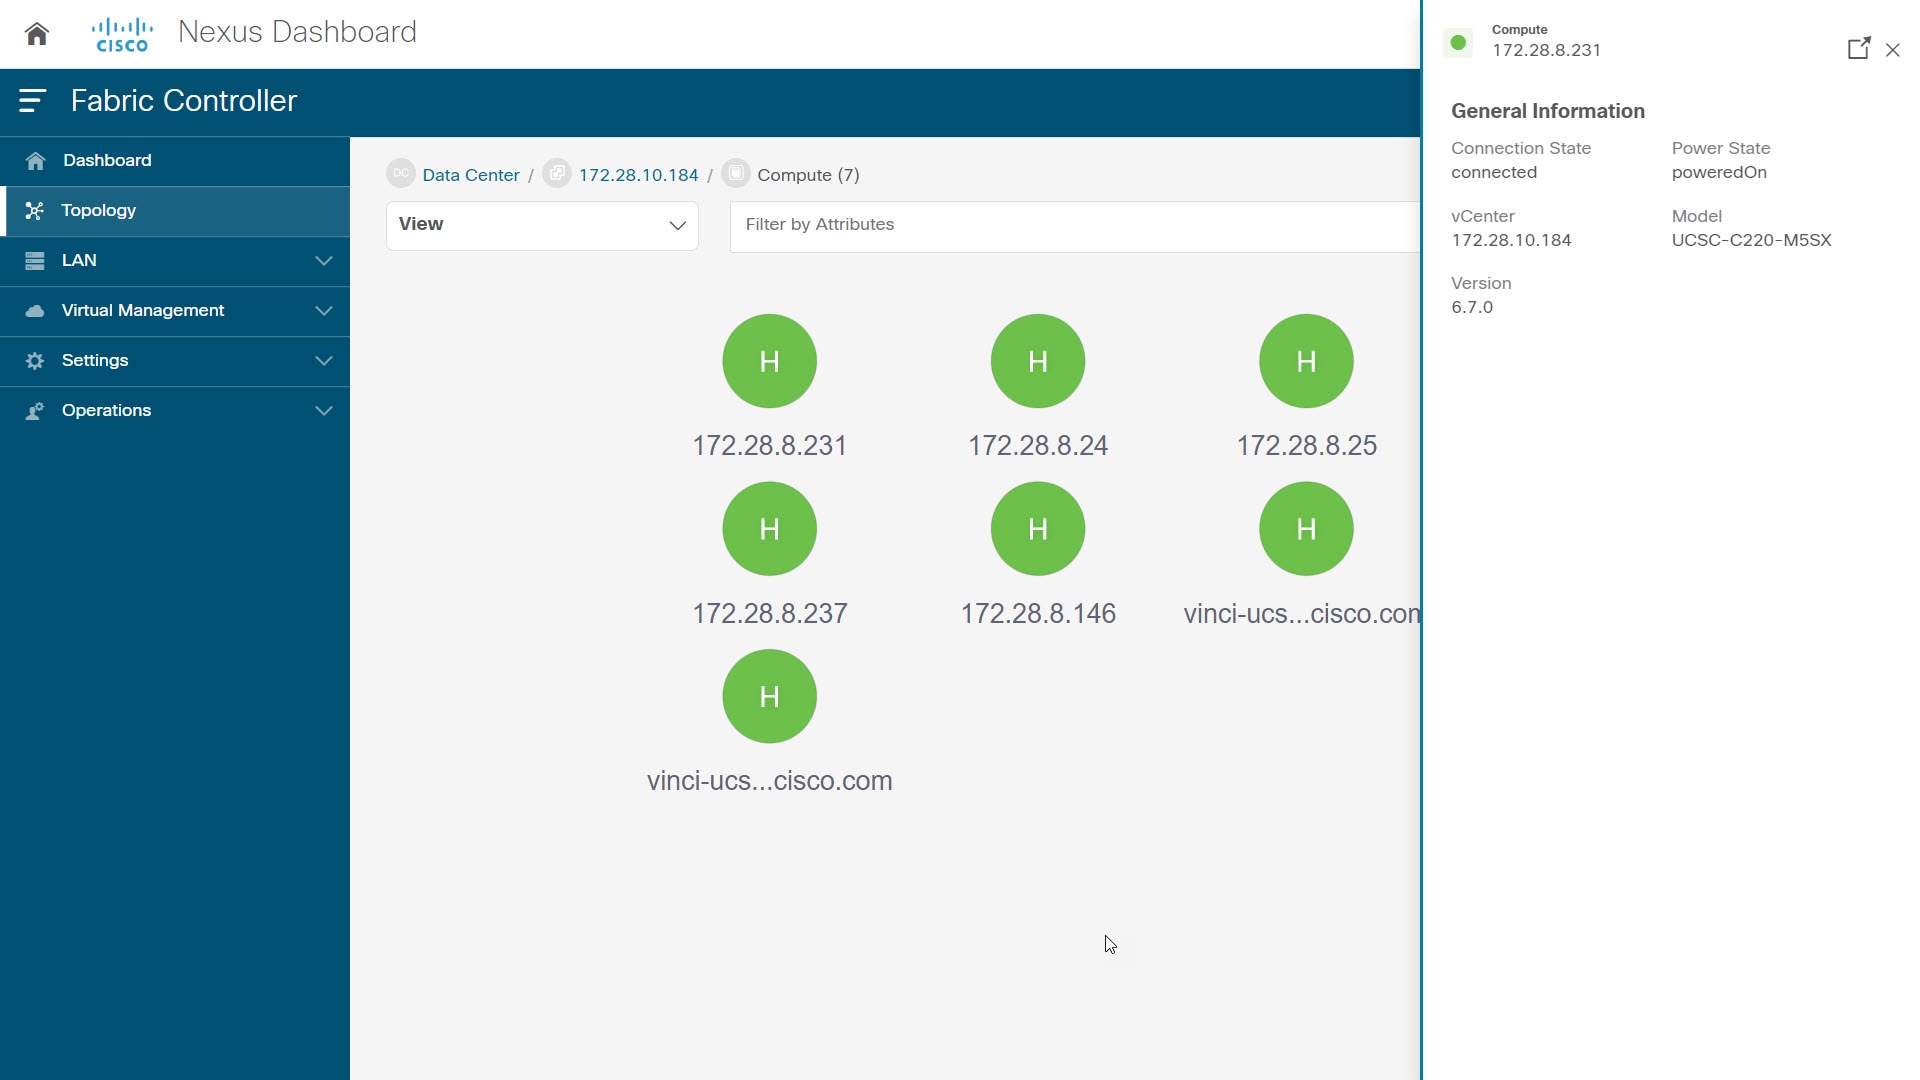
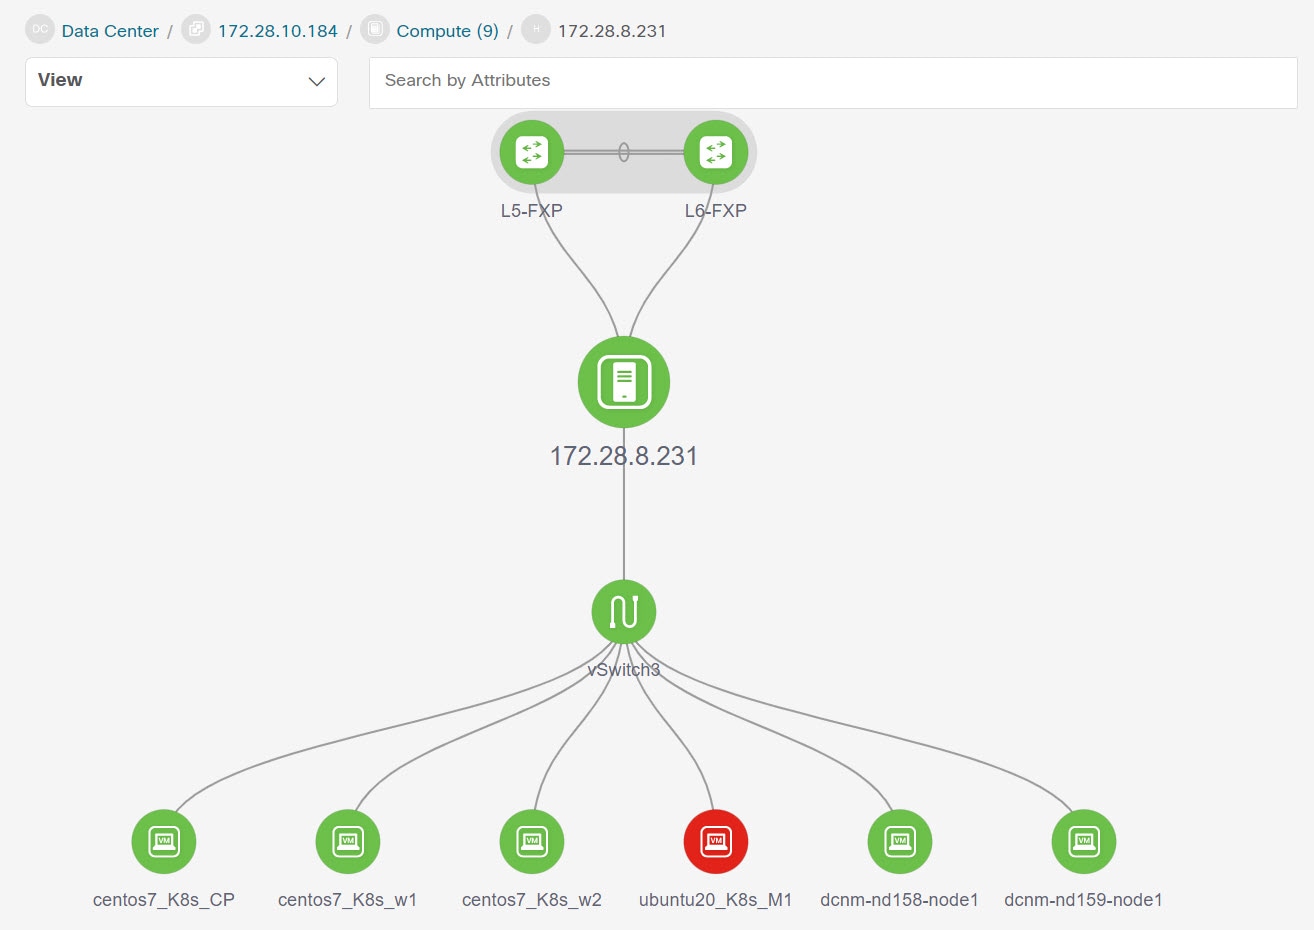
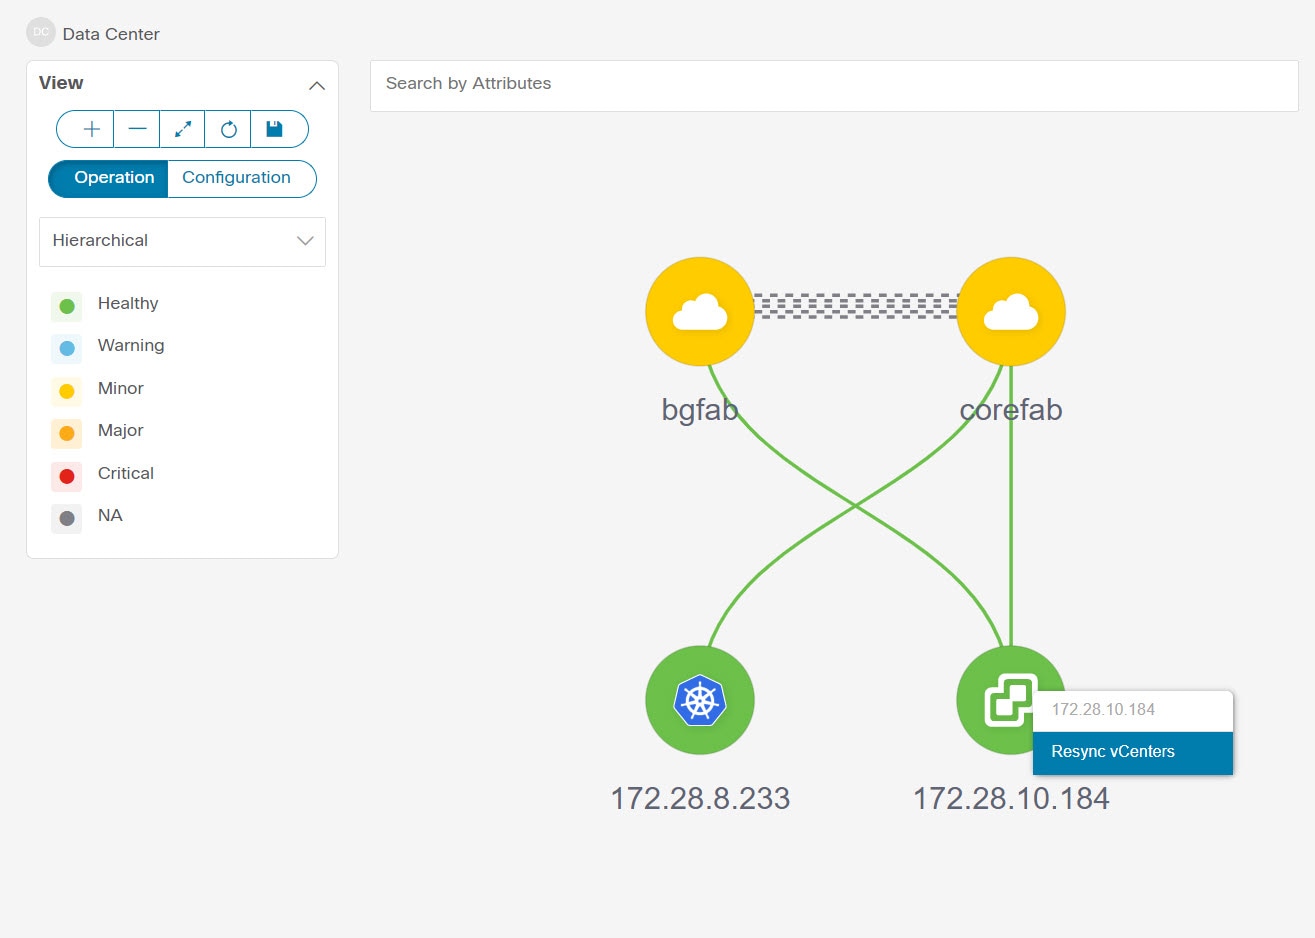
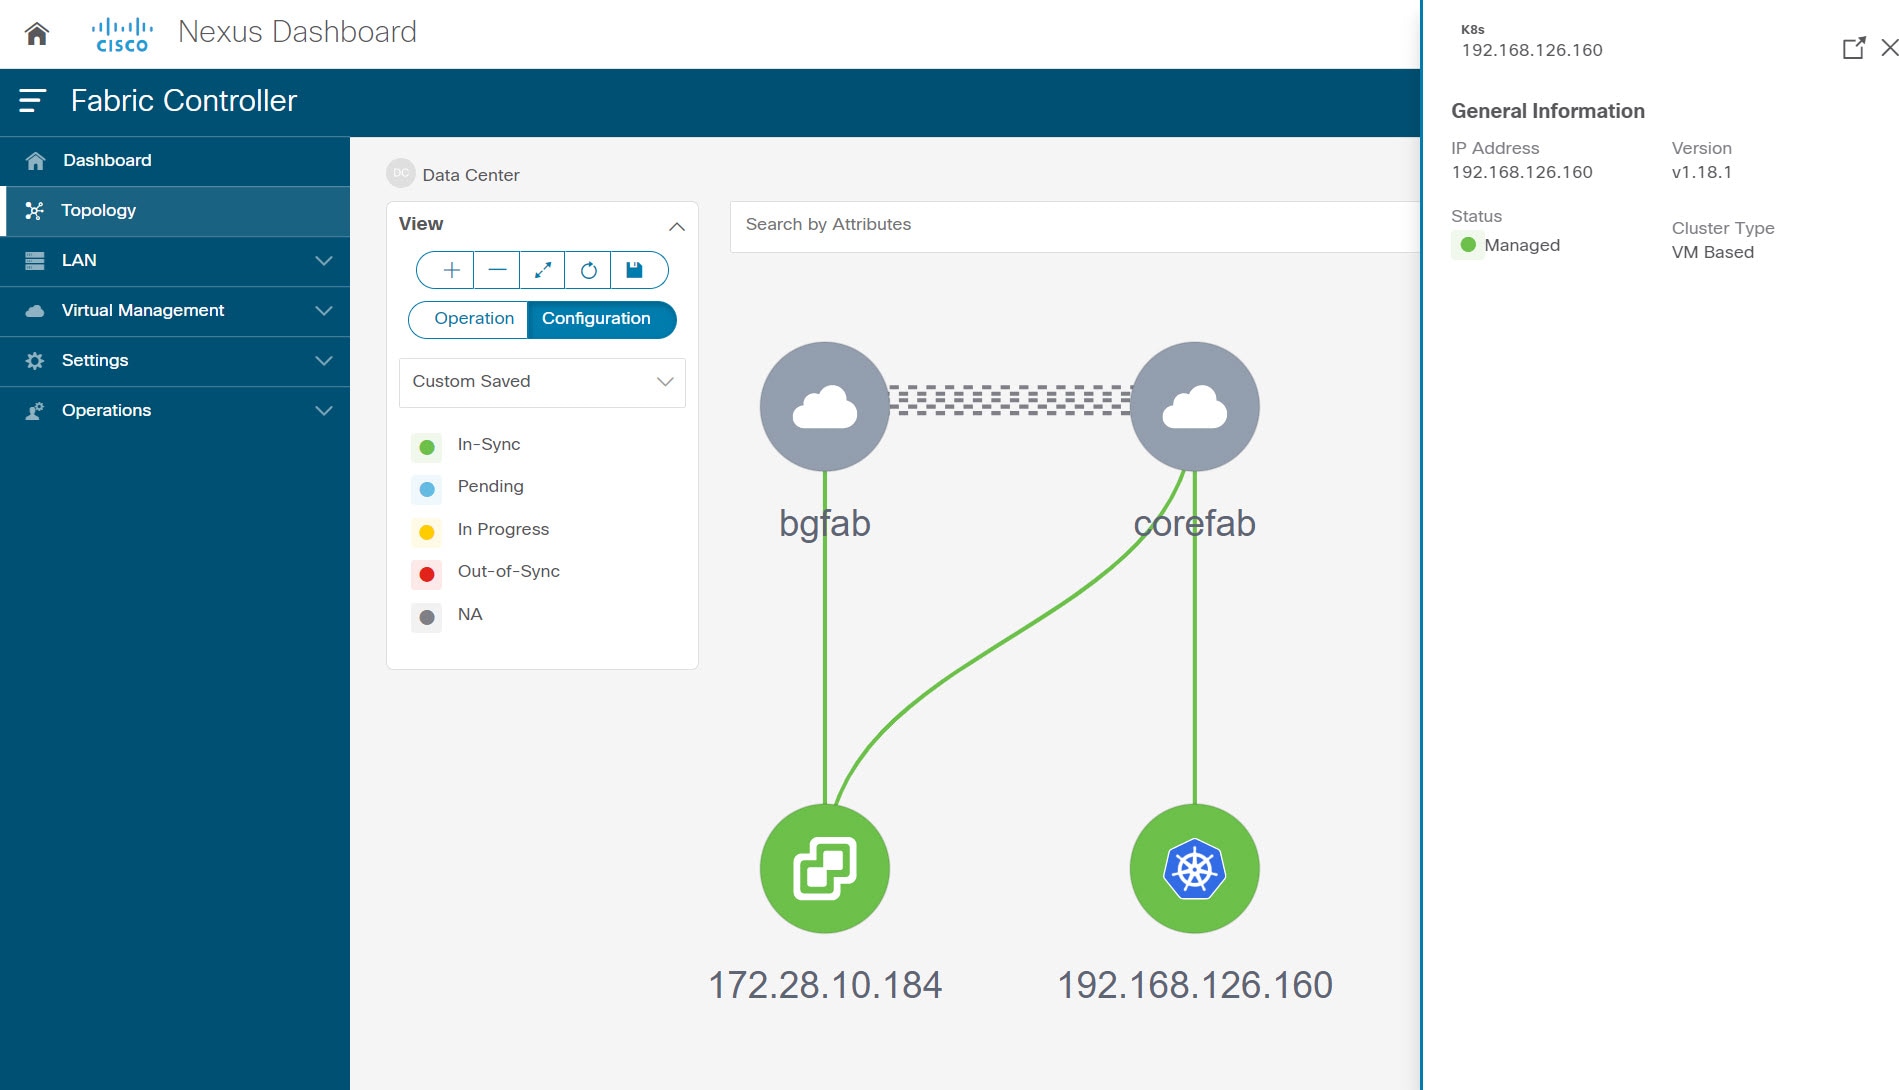
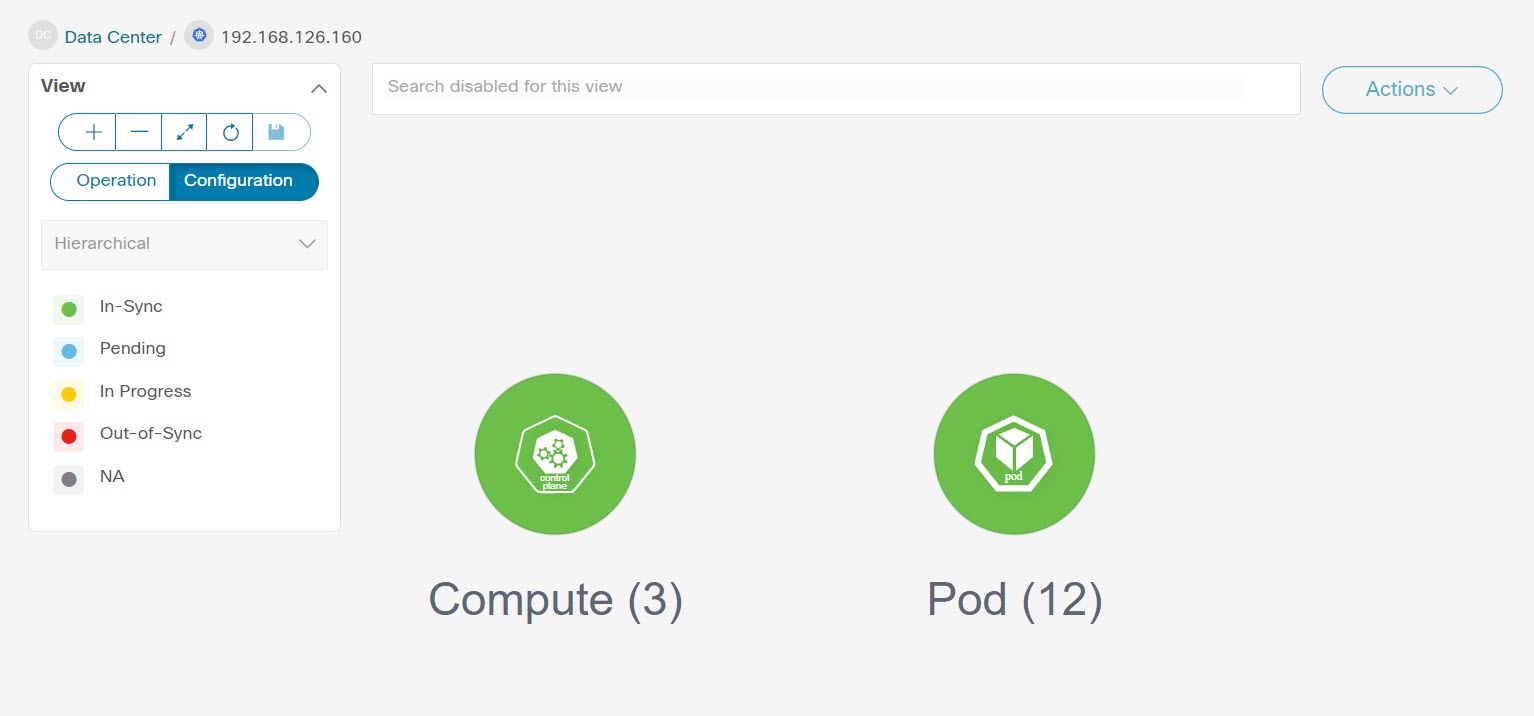
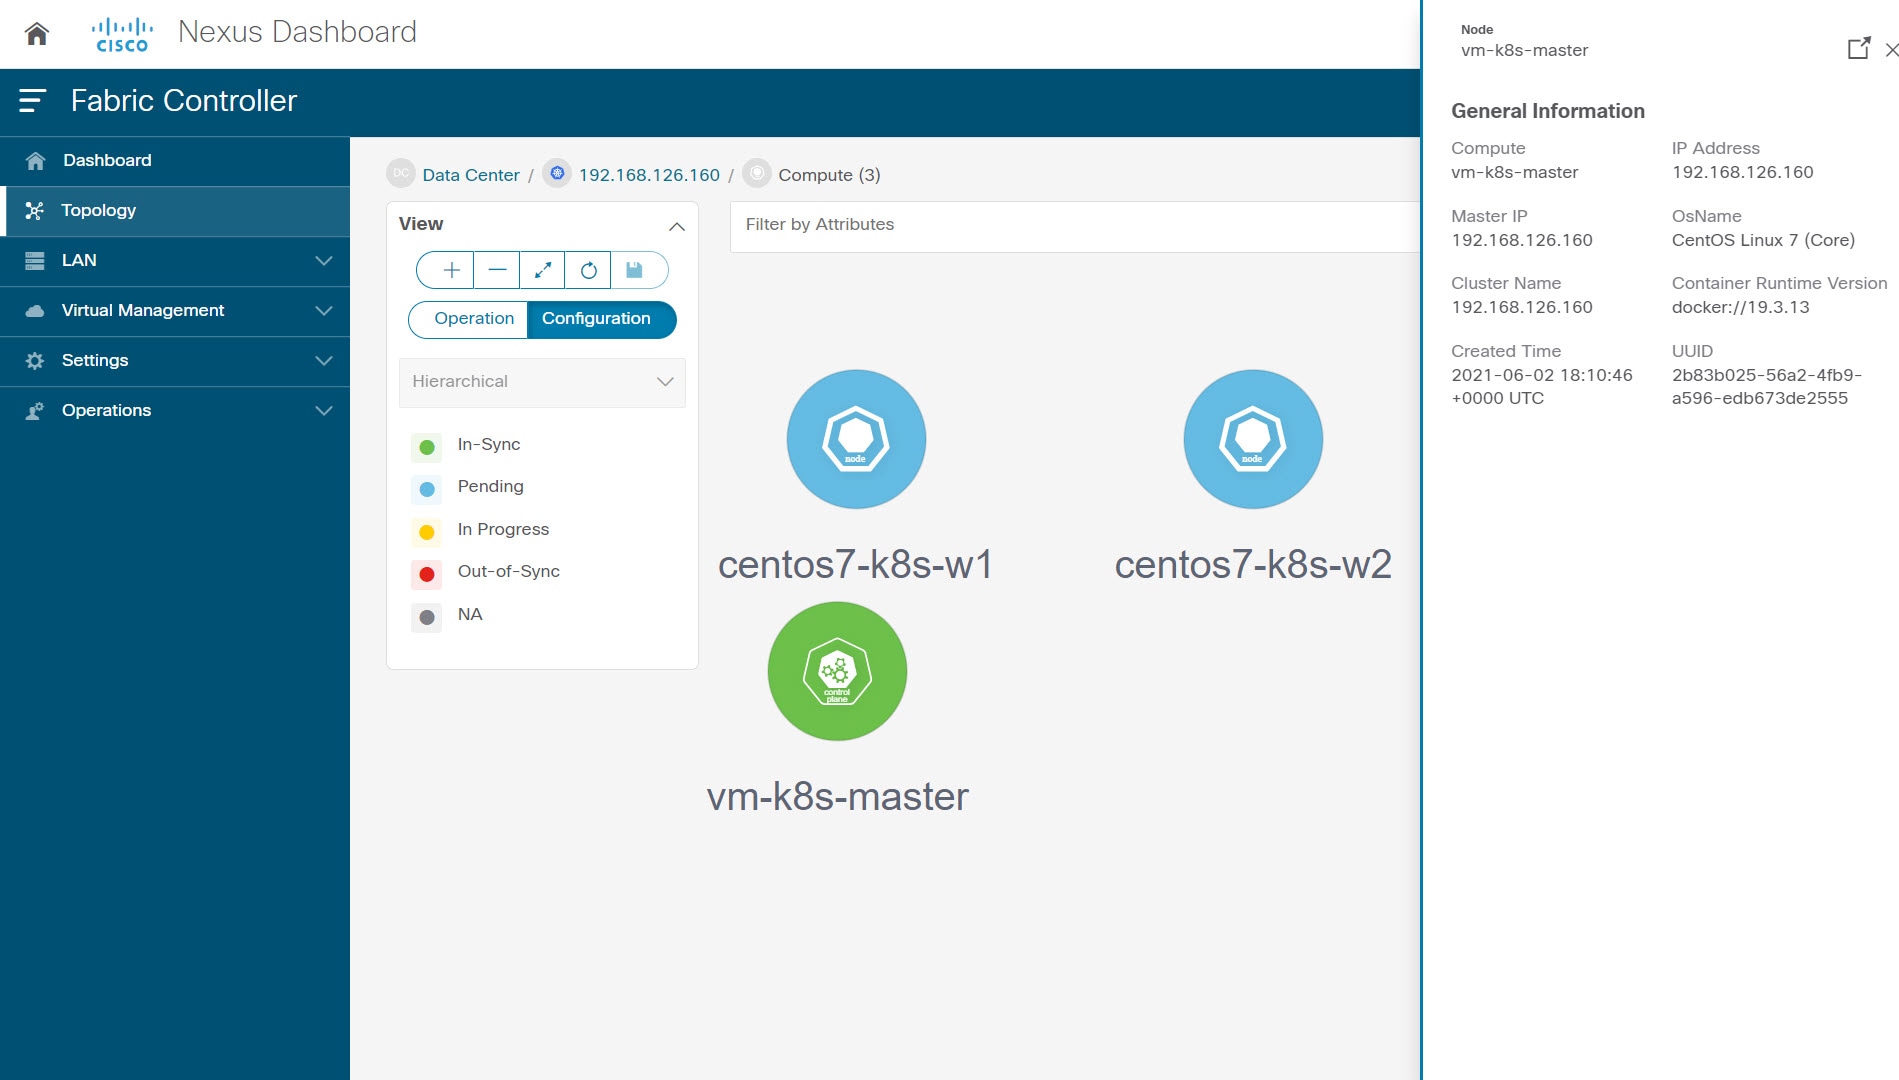
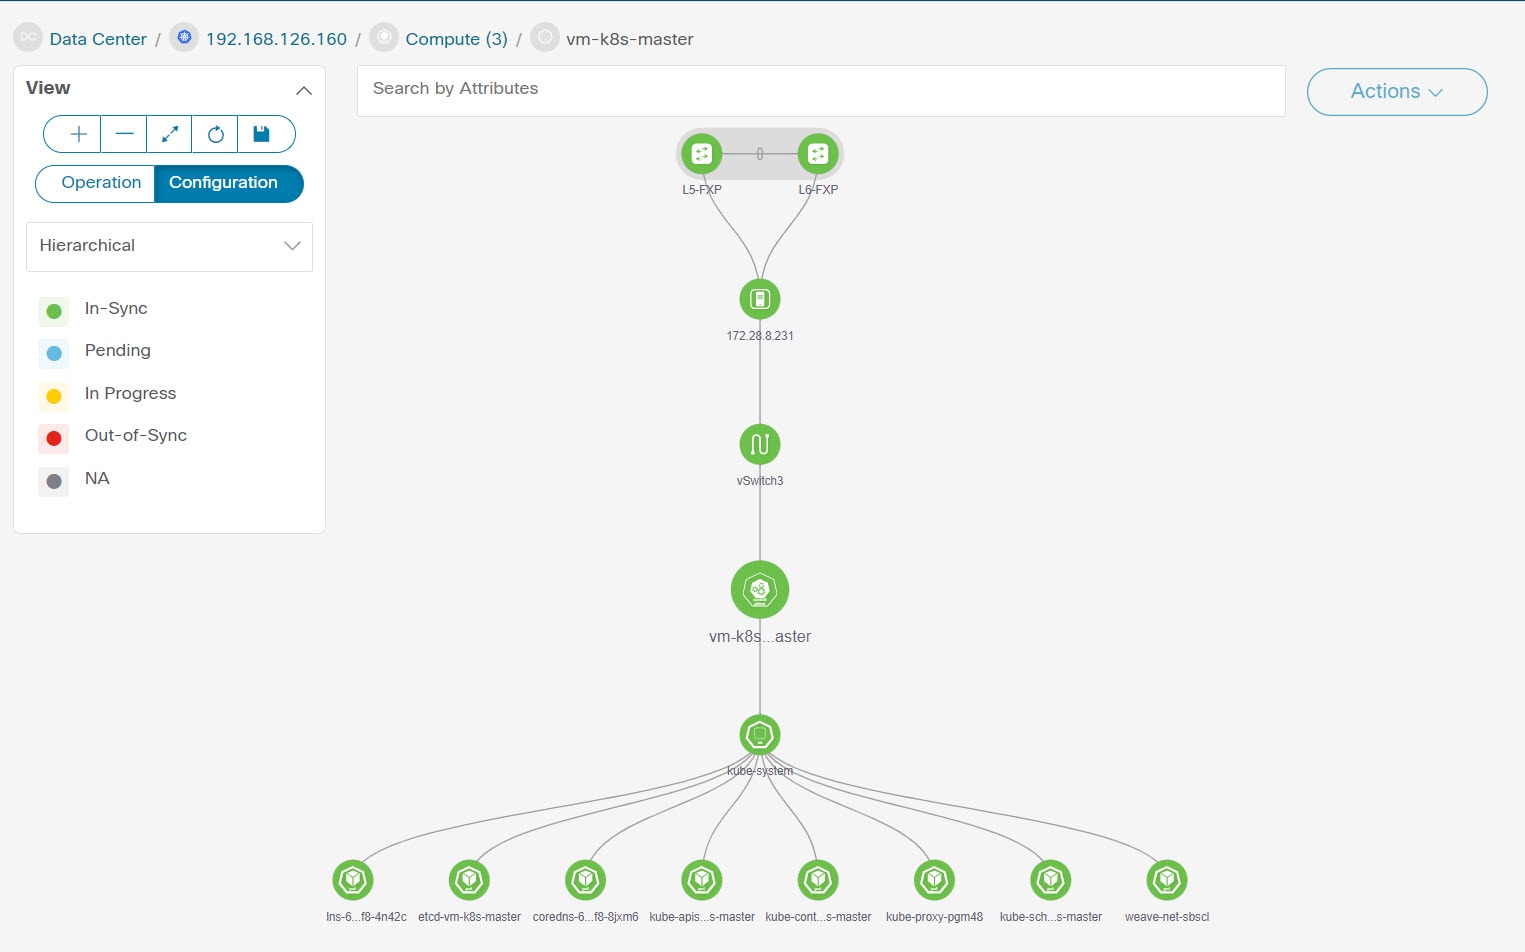
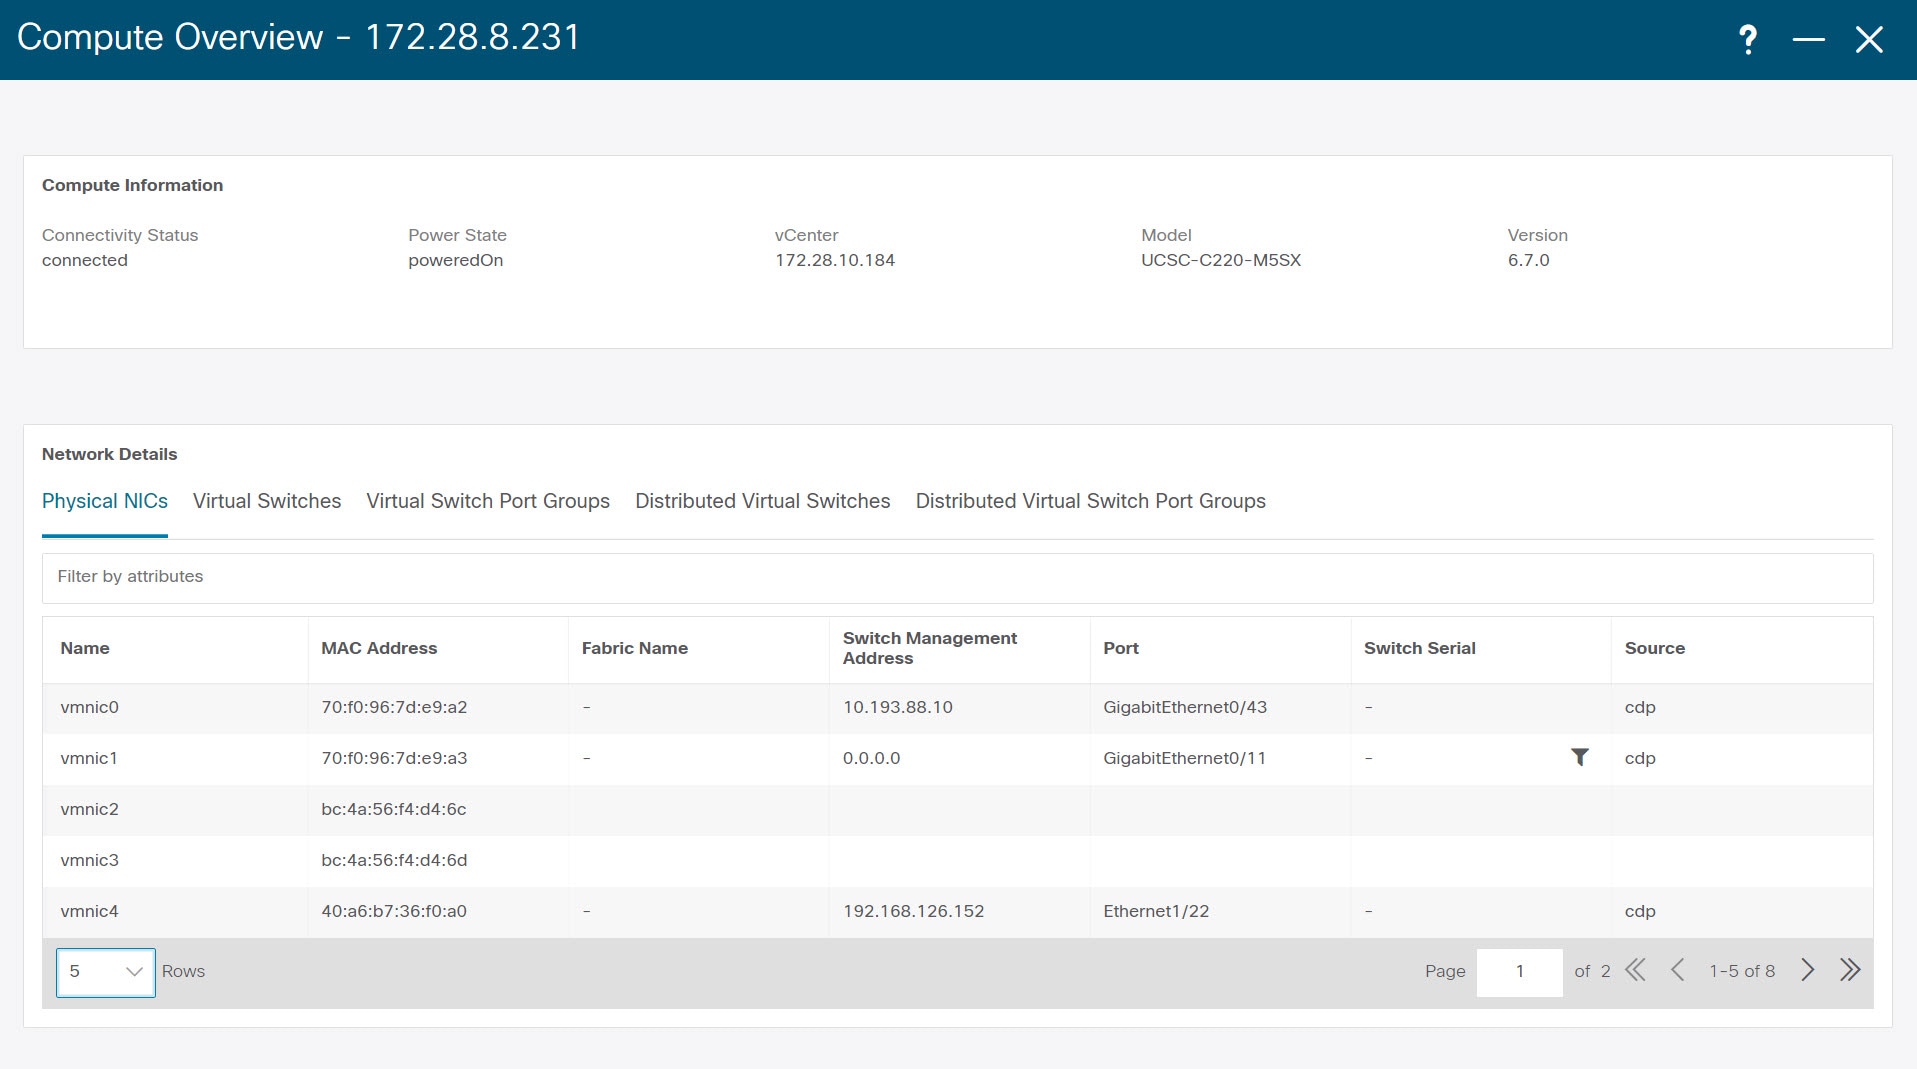
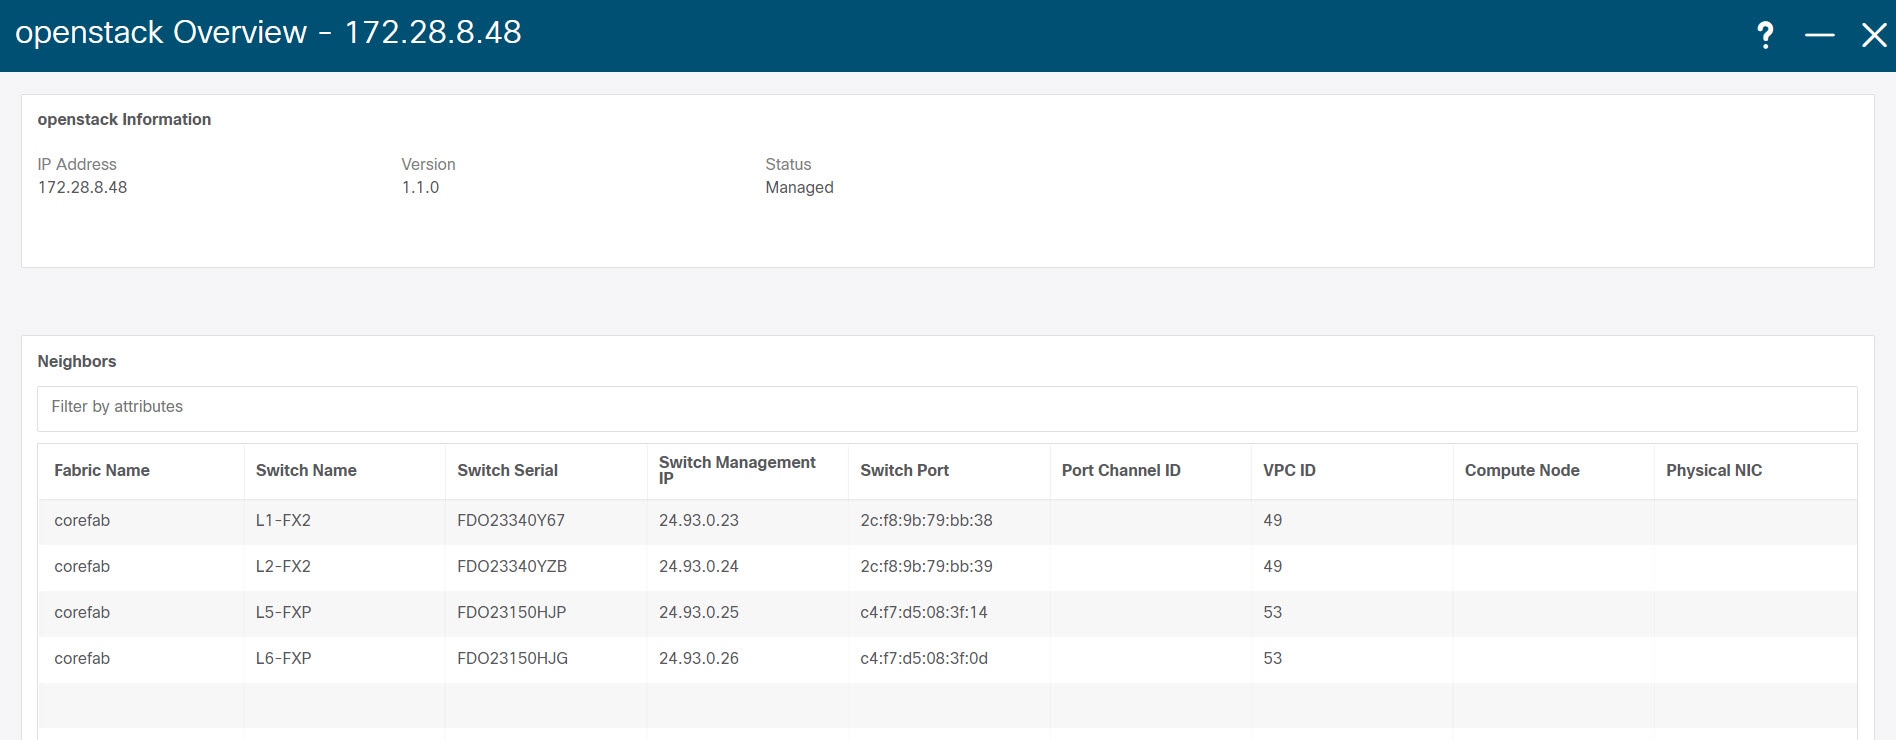
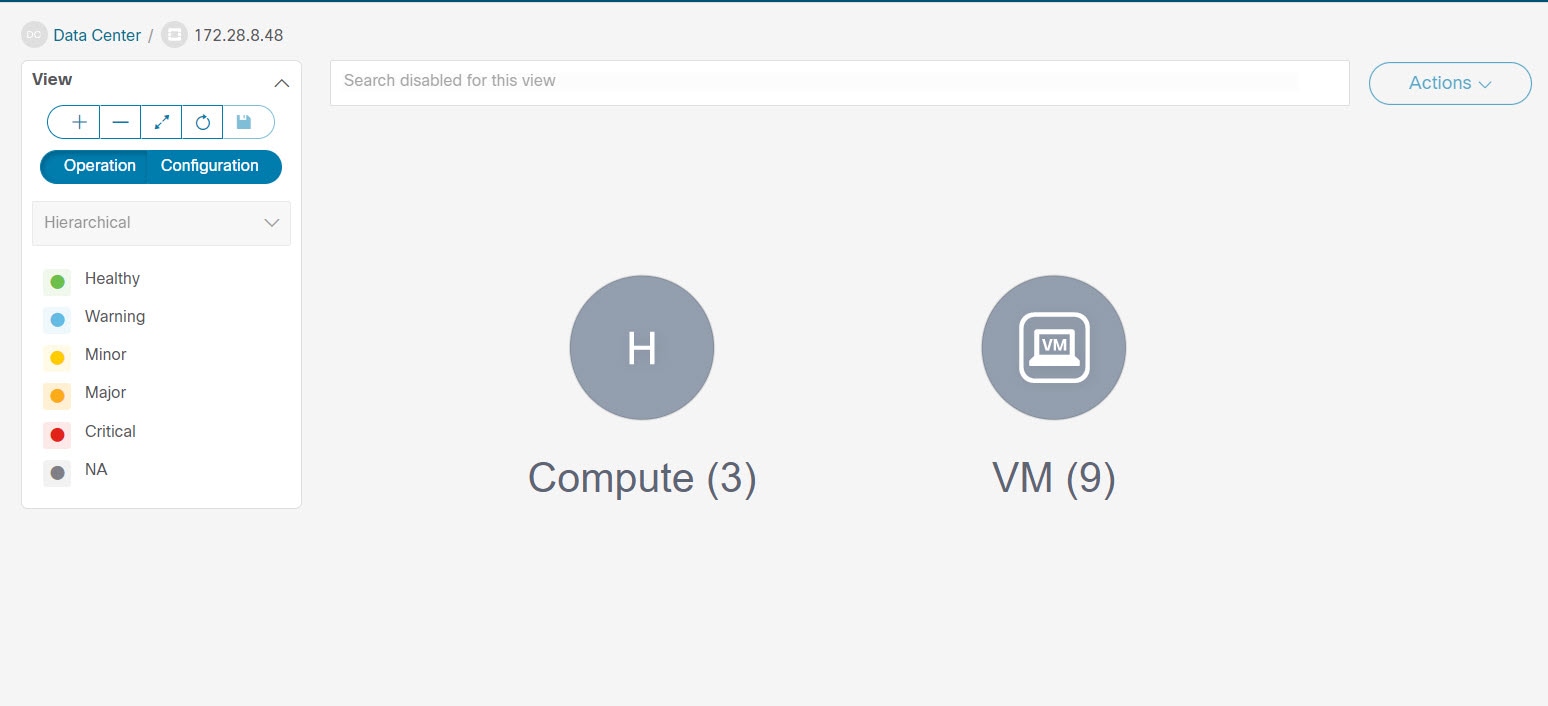
When a device is displayed on the topology, double-click it to navigate further into the topology. For example, when the fabric that you searched is displayed on the topology, double-click on the fabric (cloud icon) to navigate inside its topology. Furthermore, after the fabric is displayed on the topology, you can continue to search based on a combination of a criteria and various search attributes such as VPC peer, IP address, model, mode, switch, switch role, discovery status, software version, up time, and serial.


Note


Certain levels of the topology allow filters only, that is, filters take the place of Search. The topology listing for these levels display a limited number of entities. For example, Easy Fabric Networks are limited to 50 networks shown. Filters must be used to see additional elements or entities.


Viewing Topology

To pan, click and hold anywhere in the whitespace and drag the cursor up, down, left, or right. To drag switches, click, hold, and move the cursor around the whitespace region of the topology.

In case of multiple selection of switch, you must release the modifier keys (cmd/ctrl) before releasing mouse drag to end the switch selection.

You can view the following information of the devices and links in the View pane:

  • Layout options - You can zoom in, zoom out, or adjust the layout to fit the screen. You can also refresh the topology or save any changes to the topology. For more information, see Zooming, Panning, and Dragging.

  • Logical Links - For LAN topologies, you can view the logical links using the Show Logical Links toggle switch.

  • Operation/Configuration - For LAN topologies, you can also select operation or configuration.

  • Select Layout drop-down list - Choose the layout for your topology from this drop-down list, and click Save Topology Layout in the layout options. For more information, see Layouts.

  • Status - The status of every device or link is represented by different colors. You can view the configurational status and operational status as well for LAN topologies. For more information, see Status.

    topology-search-attribute

Topology for a node is displayed at multiple scope. Each scope is shown in the hierarchical order. The scope hierarchy is shown as breadcrumbs and can be navigated to required scope. Scopes are as follows:

  • Data Center

  • Cluster (vCenter)

  • Resource List (DVS, Compute, and VM)

  • Resource


Note


  • In the Topology window, FEX appears in gray (Unknown or NA) because Operation and Configuration status is not calculated for FEX.

  • After moving a cable from one port to another port, the old fabric link is retained in the Topology window, and it is shown in the red color indicating that the link is down. Right-click on the link and delete it if the removal was intentional. A manual Rediscover of the switch will also delete and re-learn all links to that switch.


view-nodes-L1

Viewing vCenter Visualization

In a virtualized environment, troubleshooting is intiated with identifying network attachment point for Virtual Machines (VMs). This process discovers critical details such as server, virtual switch, port group, VLAN, associated network switch, and physical port. These requires multiple touch points and communication between server, network administrator and other applications like compute orchestrator, compute manager, network manager, network controller.

Click on the vCenter visualization node, a slide-in panel appears, click on Launch icon to view vCenter Overview window.vcenter-general-information

This window has summarized data such as vCenter IP address, status of vCenter, fabric associated with the cluster, Switch name, Switch IP, Switch Port, VPC ID, Compute Node and Physical NIC.topology-vcenter

Double-click on the vCenter cluster node to view the associated vCenter cluster resources such as Compute, DVS, VMs. Each node has a number displayed in brackets, which indicates the number of specific nodes in the vCenter instance.

Double-click on Compute, or DVS, or VMs to view required list of resource type and its topology.


Note


When you double-click on DVS, it displays the associated compute hosts under the DVS.


resource-list

Click on a node, a slide-in panel appears, click on Launch icon to view Compute Overview window. vcenter-overview

You can view the Compute information and Network details tabs which displays information such as power state, memory size, IP address, MAC address associated with the node.

You can search using Search by Attributes to search required node. Double-click on the specific node to view the complete topology of vCenter node.

Resync vCenter

Resync synchronizes the state of all on board vCenter clusters. To resynchronize vCenter clusters, right-click on topology window, choose Resync vCenters and click Confirm. To synchronize individual vCenter cluster, choose the Rediscover flow.resync-vcenter

Viewing Kubernetes Cluster

You can view topology in multiple scope, each scope is displayed in the hierarchical order and navigation breadcrumb. These scopes are:

  • Data Center, Cluster (Kubernetes)

  • Resource List (Compute, and Pod)

  • Resource (Compute and Pod)

view-nodes-L1

Kubernetes Clusters are of two types:

  • VM based Kubernetes clusters are hosted on the VMs managed by the vCenter.

  • Kubernetes installed on Bare metal, which is directly connected to a Switch.

Click on the Kubernetes cluster node, a slide-in panel appears, click on Launch icon to view Kubernetes Overview window.k8-cluster-info

This window has summarized data such as vCenter IP address, status of vCenter, fabric associated with the cluster, Switch name, Switch IP, Switch Port, VPC ID, Compute Node and Physical NIC.resource-list

Double-click on the Kubernetes cluster node to view the associated Kubernetes cluster resources such as Computes and Pods. Each node as a number displayed in brackets, which indicates the number of specific nodes in the Kubernetes cluster.compute-pods

Double-click on appropriate resource (computes or pods) group to display the list of computes and the pods in the Kubernetes cluster. You can search the specific node using Filter by Attributes.k8-pods

Click on the Nodes to view details about the node. A side panel appears, showing the Node Summary. Click Launch icon to view Meta Data, Specifications, and Status information for the selected node.k8-compute-overview

Meta data tab consists of Kubernetes node or Pod name. Specification tabs include the desired design or configuration of the node or the Pod. Status tab indicates the running state information of the node or the pod.

Click on Compute or Pod to view specific compute or pod node details. You can search using Filter by Attributes to search required node.

Double-click on the specific node to view the complete topology of vCenter node.k8-topology

Click on a cluster node, a slide-in panel appears, click on Launch icon to view Kubernetes Cluster Node Overview window. To view the Compute information and Network details tabs.

Click on the pod node, a slide-in panel appears. Click on Launch icon to view the Kubernetes Pod Overview window.po-general-info

Compute Information – Displays connectivity status, Power state, vCenter IP, Model and Version.

Network Details – Displays tabular information such as Physical NICs, Virtual Switches, Virtual Switch Port Groups, Distributed Virtual Switches, Distributed Virtual Switch Port Groups.

Resync Kubernetes Clusters

To resynchronize kubernetes clusters, right-click on topology window, click Resync Kubernetes Clusters and click Confirm.

Resync synchronizes the state of all onboarded Kubernetes clusters.

Viewing OpenStack Cluster

Topology for a node is displayed at multiple scope. Each scope is shown in the hierarchical order. The scope hierarchy is shown as breadcrumbs and can be navigated to required scope. Scopes are as follows:

  • Data Center

  • Cluster (Openstack)

  • Resource List (Compute, and VM)

  • Cluster

topology-view

Click on the Openstack cluster node, a slide-in panel appears, click on Launch icon to view Openstack cluster window.

This window has summarized data such as Openstack cluster IP address, status of vCenter, fabric associated with the cluster, Switch name, Switch IP, Switch Port, VPC ID, Compute Node and Physical NIC.

Double-click Openstack cluster node, to view associated VMs and compute nodes. Each node has a number displayed in brackets, which indicates the number of specific nodes in the vCenter instance.

Double-click on Compute or VM group icon to view list of specific compute or VMs in the cluster.

You can search using Filter by Attributes to search required node.

Double-click on the specific node to view the complete topology of Openstack cluster node.

IPFM - Multicast Flow

Generic Multicast is not limited to the two-tier spine or leaf topology. The flow classification and path tracing are not limited to any specific topology if all the involved switches are Cisco Nexus 9000 Series switches with the Cisco NX-OS Release 9.3(5). Generic Multicast is supported for the default VRF.


Note


  • If you remove a device from the Inventory, the Policy deployment status for that switch is removed. However, clear the policy configuration on the switch also.


To enable prefix for multicast, perform the following steps:

  1. From Nexus Dashboard Fabric Controller Web UI, choose Settings > Server Settings.

  2. Click IPFM tab, and check the check box Enable mask/prefix for the multicast range in Host Policy.

  3. Click Save.

To view the multicast flows topology, perform the following steps:

  1. Double-click the IPFM fabric in the Topology window.

  2. Double-click the Multicast Flows node.

  3. Double-click the required Multicast Flow.

    The multicast flow topology is displayed.

    A multicast flow topology involves spine, leaf, and sender and receiver hosts. The dotted moving lines depict the flow of traffic in the IPFM fabric topology. The arrows in the icon indicate the direction of the flow, and the IP address suffixed with (S) and (R) indicate the sender and receiver host respectively.

Zooming, Panning, and Dragging

You can zoom in and zoom out using the controls that are provided at the bottom left of the windows or by using your mouse's wheel.

To pan, click and hold anywhere in the whitespace and drag the cursor up, down, left, or right.

To drag switches, click, hold, and move the cursor around the whitespace region of the topology.

Layouts

The topology supports different layouts along with a Save Layout option that remembers how you positioned your topology.

  • Hierarchical and Hierarchical Left-Right - Provide an architectural view of your topology. Various switch roles can be defined that will draw the nodes on how you configure your CLOS topology.


    Note


    When running a large-scale setup, being able to easily view all your switches on a leaf-tier can become difficult. To mitigate this, Nexus Dashboard Fabric Controller splits your leaf-tier every 16 switches.


  • Circular and Tiered-Circular - Draw nodes in a circular or concentric circular pattern.

  • Random - Nodes are placed randomly on the window. Nexus Dashboard Fabric Controller tries to make a guess and intelligently place nodes that belong together in close proximity.

  • Custom saved layout - Nodes can be dragged around according to your preference. After you position as required, click Save to retain the positions. The next time you come to the topology, Nexus Dashboard Fabric Controller will draw the nodes based on your last saved layout positions.

Before a layout is chosen, Nexus Dashboard Fabric Controller checks if a custom layout is applied. If a custom layout is applied, Nexus Dashboard Fabric Controller uses it. If a custom layout is not applied, Nexus Dashboard Fabric Controller checks if switches exist at different tiers, and chooses the Hierarchical layout or the Hierarchical Left-Right layout. Force-directed layout is chosen if all the other layouts fail.

Status

The color coding of each node and link corresponds to its state. The operational colors and what they indicate are described in the following list:

  • Green - Indicates that the element is in good health and functioning as intended.

  • Blue - Indicates that the element is in a warning state and requires attention to prevent any further problems.

  • Yellow - Indicates that the element has minor issues.

  • Orange - Indicates that the element has major issues and requires attention to prevent any further problems.

  • Red - Indicates that the element is in critical state and requires immediate attention.

  • Gray: Indicates lack of information to identify the element or the element has been discovered.

The configurational colors and what they indicate are described in the following list:

  • Green - Indicates that the element is element is In-Sync with the intended configuration.

  • Blue - Indicates that the element has pending deployments.

  • Yellow - Indicates that active deployments are in-progress.

  • Red - Indicates that the element is Out-of-Sync with the intended configuration.

  • Gray: Indicates lack of information or no support for Configuration Sync calculation.


    Note


    • In the Topology window, FEX appears in gray (Unknown or n/a) because Operation and Configuration status is not calculated for FEX.

    • After moving a cable from one port to another port, the old fabric link is retained in the Topology window, and it is shown in the red color indicating that the link is down. Right-click on the link and delete it if the removal was intentional. A manual Rediscover of the switch will also delete and re-learn all links to that switch.