Deploying in VMware ESX

Prerequisites and Guidelines

Before you proceed with deploying the Nexus Dashboard cluster in VMware ESX, you must:

  • Ensure that the ESX form factor supports your scale and services requirements.

    Scale and services support and co-hosting vary based on the cluster form factor and the specific services you plan to deploy. You can use the Nexus Dashboard Capacity Planning tool to verify that the virtual form factor satisfies your deployment requirements.


    Note


    Some services (such as Nexus Dashboard Fabric Controller) may require only a single ESX virtual node for one or more specific use cases. In that case, the capacity planning tool will indicate the requirement and you can simply skip the additional node deployment step in the following section.

    However, note that if you have to deploy a mix of App and Data nodes, for example if you plan to deploy Nexus Dashboard Insights or co-host multiple services in the same cluster, you must ensure that the Data nodes are deployed first as the initial cluster's 3 master nodes. Then you can add the App nodes as the worker nodes, as described in the Cisco Nexus Dashboard User Guide.


  • Review and complete the general prerequisites described in Deployment Overview and Requirements.

    Note that this document describes how to initially deploy the base Nexus Dashboard cluster. If you want to expand an existing cluster with additional nodes (such as worker or standby), see the "Infrastructure Management" chapter of the Cisco Nexus Dashboard User Guide instead, which is available from the Nexus Dashboard UI or online at Cisco Nexus Dashboard User Guide

  • Review and complete any additional prerequisites described in the Release Notes for the services you plan to deploy.

  • When deploying in VMware ESX, you can deploy two types of nodes:

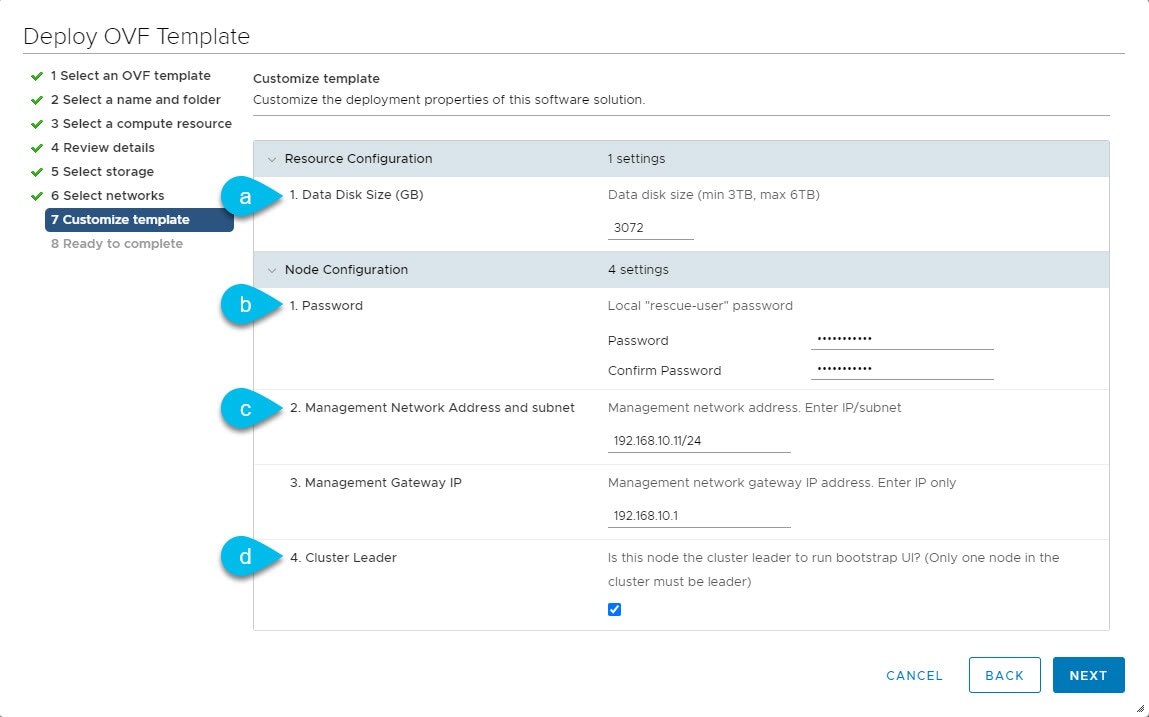
    • Data Node—node profile designed for data-intensive applications, such Nexus Dashboard Insights

    • App Node—node profile designed for non-data-intensive applications, such Nexus Dashboard Orchestrator

    Ensure you have enough system resources:

    Table 1. Deployment Requirements

    Nexus Dashboard Version

    Data Node Requirements

    App Node Requirements

    Release 2.1.x

    • VMware ESXi 6.5, 6.7, or 7.0

    • VMware vCenter 6.x, if deploying using vCenter

    • Each VM requires:

      • 32 vCPUs

      • 128GB of RAM

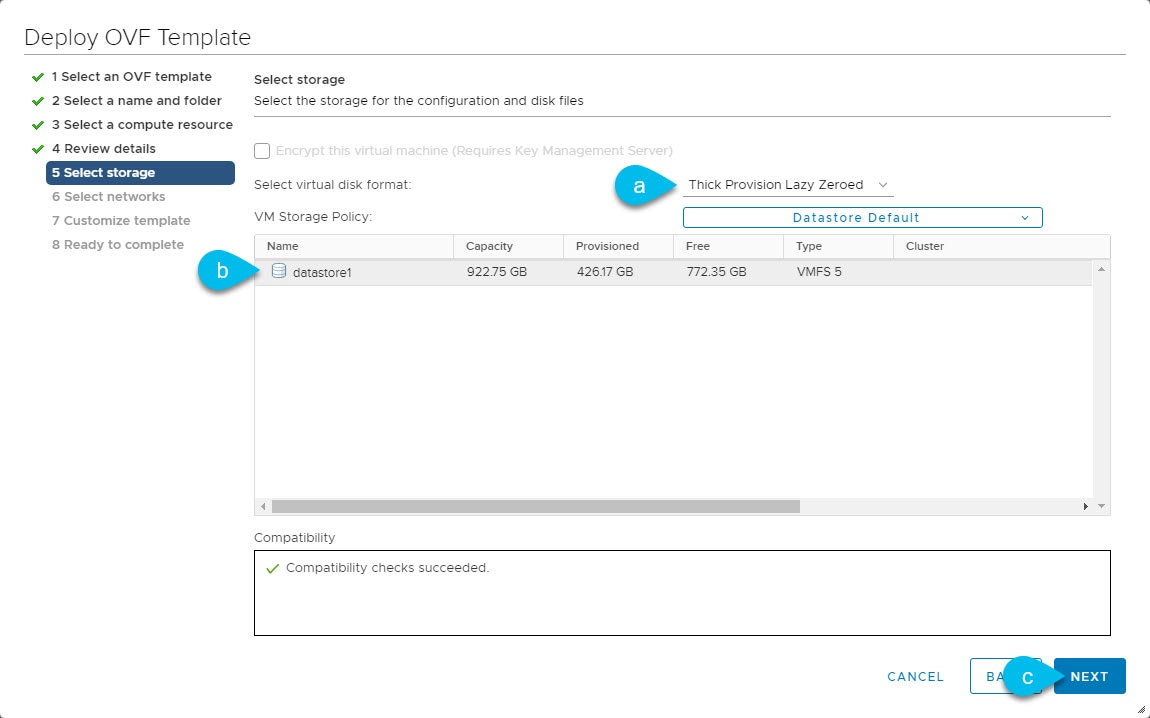
      • 3TB SSD storage for the data volume and an additional 50GB for the system volume

        All Data nodes must be deployed on SSD or faster storage.

    • We recommend that each Nexus Dashboard node is deployed in a different ESXi server.

    • VMware ESXi 6.5, 6.7, or 7.0

    • VMware vCenter 6.x, if deploying using vCenter

    • Each VM requires:

      • 16 vCPUs

      • 64GB of RAM

      • 500GB HDD or SSD storage for the data volume and an additional 50GB for the system volume

        Some services require App nodes to be deployed on faster SSD storage while other services support HDD. Check the Nexus Dashboard Capacity Planning tool to ensure that you use the correct type of storage.

    • We recommend that each Nexus Dashboard node is deployed in a different ESXi server.

  • After each node's VM is deployed, ensure that the VMware Tools periodic time synchronization is disabled as described in the deployment procedure in the next section.

  • VMware vMotion is not supported for Nexus Dashboard cluster nodes.

  • VMware Distributed Resource Scheduler (DRS) is not supported for Nexus Dashboard cluster nodes.

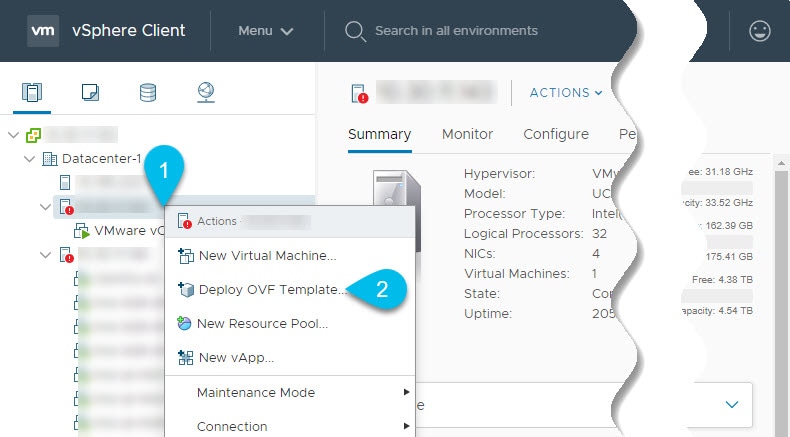
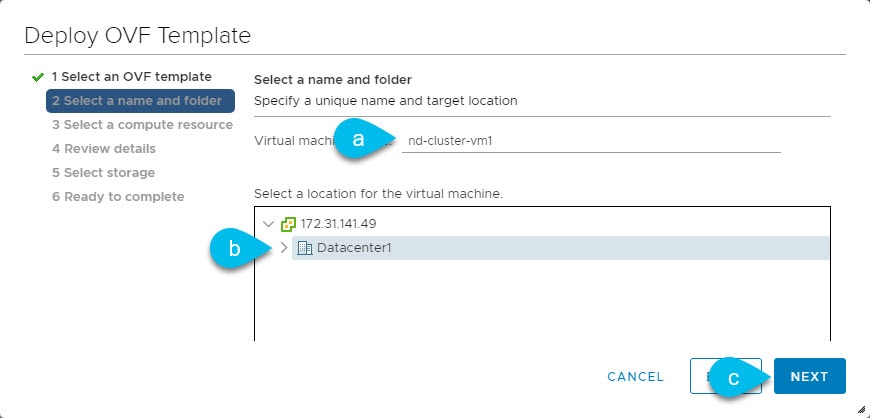
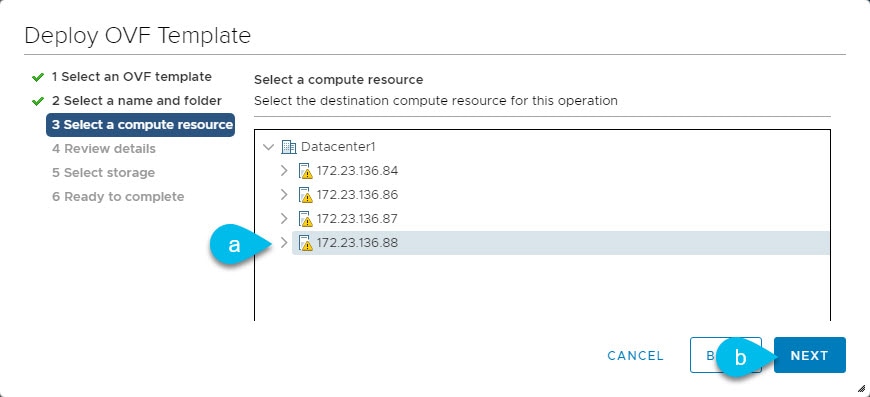
  • You can choose to deploy the nodes directly in ESXi or using vCenter.

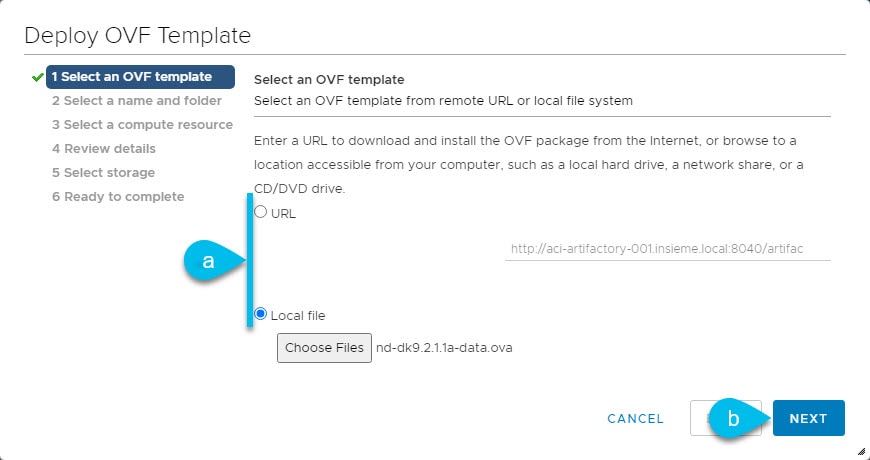
    If you want to deploy using vCenter, following the steps described in Deploying Cisco Nexus Dashboard Using VMware vCenter.

    If you want to deploy directly in ESXi, following the steps described in Deploying Cisco Nexus Dashboard Directly in VMware ESXi.

ESX Host Network Connectivity

If you plan to install Nexus Dashboard Insights or Fabric Controller service and use the Persistent IPs feature, you must ensure that the ESX host where the cluster nodes are deployed has a single logical uplink. In other words, it is connected via a single link, PC, or vPC and not a dual Active/Active (A/A) or Active/Standby (A/S) link without PC/vPC.

The following diagrams summarize the supported and unsupported network connectivity configurations for the ESX host where the nodes are deployed:

  • In case the ESX host is connected directly, the following configurations are supported:

    • A/A uplinks of Port-Group or virtual switch with PC or vPC

    • Single uplink of Port-Group or virtual switch

    • Port-Channel used for the uplink of Port-Group or virtual switch.

    A/A or A/S uplinks of Port-Group or virtual switch without PC or vPC are not supported

    Figure 1. ESX Host Connectivity (Direct)
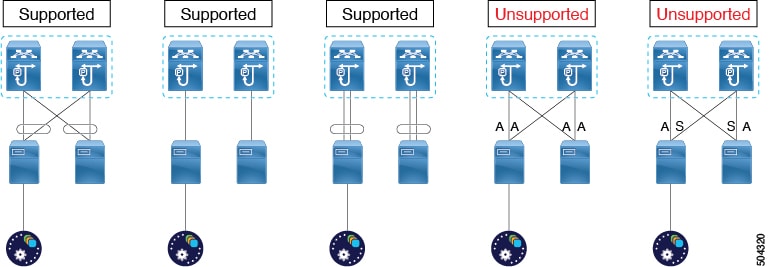
  • In case the ESX host is connected via a UCS Fabric Interconnect (or equivalent), the following configurations are supported:

    • A/S uplinks of Port-Group or virtual switch at UCS Fabric Interconnect level without PC or vPC

      In this case, the Active/Standby links are based on the server technology, such as Fabric Failover for Cisco UCS and not at the ESXi hypervisor level.

    • Single uplink of Port-Group or virtual switch

    A/A or A/S uplinks of Port-Group or virtual switch at the hypervisor level without PC or vPC are not supported

    Figure 2. ESX Host Connectivity (with Fabric Interconnect)
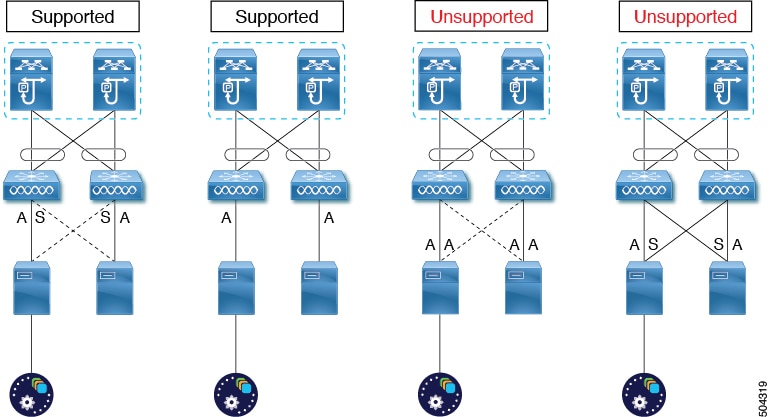
Deploying Cisco Nexus Dashboard Using VMware vCenter

This section describes how to deploy Cisco Nexus Dashboard cluster using VMware vCenter. If you prefer to deploy directly in ESXi, follow the steps described in Deploying Cisco Nexus Dashboard Directly in VMware ESXi instead.

Before you begin

Procedure


Step 1

Obtain the Cisco Nexus Dashboard OVA image.

  1. Browse to the Software Download page.

    https://www.cisco.com/c/en/us/support/data-center-analytics/nexus-dashboard/series.html

  2. Click the Downloads tab.

  3. Choose the Nexus Dashboard version you want to download.

  4. Download the appropriate Cisco Nexus Dashboard image (nd-dk9.<version>.ova).

    For Data nodes, download the nd-dk9.<version>-data.ova.

    For App nodes, download the nd-dk9.<version>-app.ova.

Step 2

Log in to your VMware vCenter.

Depending on the version of your vSphere client, the location and order of configuration screens may differ slightly. The following steps provide deployment details using VMware vSphere Client 6.7.

Step 3

Start the new VM deployment.

  1. Right-click the ESX host where you want to deploy.

  2. Then select Deploy OVF Template...

    The Deploy OVF Template wizard appears.

Step 4

In the Select an OVF template screen, provide the OVA image.

  1. Provide the image.

    If your image is local, select Local file and click Choose Files to select the OVA file you downloaded.

    If you hosted the image on a web server in your environment, select URL and provide the URL to the image.

  2. Click Next to continue.

Step 5

In the Select a name and folder screen, provide a name and location for the VM.

  1. Provide the name for the virtual machine.

  2. Select the location for the virtual machine.

  3. Click Next to continue

Step 6

In the Select a compute resource screen, select the ESX host.

  1. Select the vCenter datacenter and the ESX host for the virtual machine.

  2. Click Next to continue

Step 7

In the Review details screen, click Next to continue.

Step 8

In the Select storage screen, provide the storage information.

  1. From the Select virtual disk format dropdown, select Thick Provision Lazy Zeroed.

  2. Select the datastore for the virtual machine.

    We recommend a unique datastore for each node.

  3. Click Next to continue

Step 9

In the Select networks screen, accept default values and click Next to continue.

There are two networks, fabric0 is used for the data network and mgmt0 is used for the management network.

Step 10

In the Customize template screen, provide the required information.

  1. Provide the size for the node's data volume.

    We recommend using the default values for the required data volume.

    The default values will be pre-populated based on the type of node you are deploying, with App node having a single 500GB disk and Data node having a single 3TB disk.

    Note that in addition to the data volume, a second 50GB system volume will also be configured but cannot be customized.

  2. Provide and confirm the Password.

    We recommend configuring the same password for all nodes, however you can choose to provide different passwords for the second and third node. If you provide different passwords, the first node's password will be used as the initial password of the admin user in the GUI.

  3. Provide the Management Network IP address, netmask, and gateway.

  4. If this is the first node you are deploying, check the Cluster Leader checkbox.

    Only a single node in the cluster must be leader. You will use the cluster leader's management IP address to complete cluster creation using a GUI wizard in your browser.

  5. Click Next to continue.

Step 11

In the Ready to complete screen, verify that all information is accurate and click Finish to begin deploying the first node.

Step 12

Repeat previous steps to deploy the second and third nodes.

You do not need to wait for the first node deployment to complete, you can begin deploying the other two nodes simultaneously.

Note


The steps to deploy the second and third nodes are identical with the only exception being that you must leave the Cluster Leader checkbox unchecked.

Step 13

Wait for all three VMs to finish deploying.

Step 14

Ensure that the VMware Tools periodic time synchronization is disabled, then start the VMs.

To disable time synchronization:

  1. Right-click the node's VM and select Edit Settings.

  2. In the Edit Settings window, select the VM Options tab.

  3. Expand the VMware Tools category and uncheck the Synchronize guest time with host option.

Step 15

Open your browser and navigate to https://<first-node-management-ip> to open the GUI.

The rest of the configuration workflow takes place from the first node's (Cluster Leader) GUI. You do not need to log in to or configure the other two nodes directly.

Enter the password you provided in a previous step and click Begin Setup

Step 16

Enter the password you provided for the first node and click Begin Setup.

Step 17

Provide the Cluster Details.

In the Cluster Details screen of the initial setup wizard, provide the following information:

  1. Provide the Cluster Name for this Nexus Dashboard cluster.

  2. Click +Add NTP Host to add one or more NTP servers.

    You must provide an IP address, fully qualified domain name (FQDN) are not supported.

    After you enter the IP address, click the green checkmark icon to save it.

  3. Click +Add DNS Provider to add one or more DNS servers.

    After you enter the IP address, click the green checkmark icon to save it.

  4. Provide a Proxy Server.

    For clusters that do not have direct connectivity to Cisco cloud, we recommend configuring a proxy server to establish the connectivity, which will allow you to mitigate risk from exposure to non-conformant hardware and software in your fabrics.

    If you want to skip proxy configuration, click the information (i) icon next to the field, then click Skip.

  5. (Optional) If your proxy server required authentication, change Authentication required for Proxy to Yes and provide the login credentials.

  6. (Optional) Expand the Advanced Settings category and change the settings if required.

    Under advanced settings, you can configure the following:

    • Provide one or more search domains by clicking +Add DNS Search Domain.

      After you enter the IP address, click the green checkmark icon to save it.

    • Provide custom App Network and Service Network.

      The application overlay network defines the address space used by the application's services running in the Nexus Dashboard. The field is pre-populated with the default 172.17.0.1/16 value.

      The services network is an internal network used by the Nexus Dashboard and its processes. The field is pre-populated with the default 100.80.0.0/16 value.

      Application and Services networks are described in the Prerequisites and Guidelines section earlier in this document.

  7. Click Next to continue.

Step 18

In the Node Details screen, provide the node's information.

  1. Click the Edit button next to the first node.

  2. Provide the node's Name.

  3. Provide the node's Data Network information.

    The Management Network information is already pre-populated with the information you provided for the first node.

    You must provide the data network IP address, netmask, and gateway. Optionally, you can also provide the VLAN ID for the network. For most deployments, you can leave the VLAN ID field blank.

  4. (Optional) Provide IPv6 addresses for the management and data networks.

    Starting with release 2.1.1, Nexus Dashboard supports dual stack IPv4/IPv6 for the management and data networks.

    Note


    If you want to provide IPv6 information, you must do it during cluster bootstrap process. If you deploy the cluster using only IPv4 stack and want to add IPv6 information later, you would need to redeploy the cluster.

    All nodes in the cluster must be configured with either only IPv4 or dual IPv4/IPv6 stack.

  5. Click Save to save the changes.

Step 19

Click Add Node to add the second node to the cluster.

The Node Details window opens.

  1. Provide the node's Name.

  2. In the Credentials section, provide the node's Management Network IP address and login credentials, then click Verify.

    The IP address and login credentials are used to pull that node's information.

  3. Provide the node's Data Network IP address and gateway.

    The Management Network information will be pre-populated with the information pulled from the node based on the IP address and credentials you provided in the previous sub-step.

    You must provide the data network IP address, netmask, and gateway. Optionally, you can also provide the VLAN ID for the network. For most deployments, you can leave the VLAN ID field blank.

  4. (Optional) Provide IPv6 information for the management and data networks.

    Starting with release 2.1.1, Nexus Dashboard supports dual stack IPv4/IPv6 for the management and data networks.

    Note


    If you want to provide IPv6 information, you must do it during cluster bootstrap process. If you deploy the cluster using only IPv4 stack and want to add IPv6 information later, you would need to redeploy the cluster.

    All nodes in the cluster must be configured with either only IPv4 or dual IPv4/IPv6 stack.

  5. Click Save to save the changes.

Step 20

Repeat the previous step to add the 3rd node.

Step 21

Click Next to continue.

Step 22

In the Confirmation screen, review the entered information and click Configure to create the cluster.

During the node bootstrap and cluster bring-up, the overall progress as well as each node's individual progress will be displayed in the UI.

It may take up to 30 minutes for the cluster to form and all the services to start. When cluster configuration is complete, the page will reload to the Nexus Dashboard GUI.

Step 23

Verify that the cluster is healthy.

It may take up to 30 minutes for the cluster to form and all the services to start.

After all three nodes are ready, you can log in to any one node via SSH and run the following command to verify cluster health:

  1. Verify that the cluster is up and running.

    You can check the current status of cluster deployment by logging in to any of the nodes and running the acs health command.

    While the cluster is converging, you may see the following outputs:

    $ acs health
    k8s install is in-progress
    $ acs health
    k8s services not in desired state - [...]
    $ acs health
    k8s: Etcd cluster is not ready
    When the cluster is up and running, the following output will be displayed:
    $ acs health
    All components are healthy
  2. Log in to the Nexus Dashboard GUI.

    After the cluster becomes available, you can access it by browsing to any one of your nodes' management IP addresses. The default password for the admin user is the same as the rescue-user password you chose for the first node of the Nexus Dashboard cluster.

Step 24

If you plan to host multiple applications in the same cluster, configure deployment profiles for the App Infra Services.

If you plan to host only a single application in your Nexus Dashboard cluster, skip this step.

If you are co-hosting multiple applications in the same cluster, you must configure the App Infra Services with deployment profiles appropriate for your combination of applications and fabric sizes.

After the cluster upgrade is completed, follow the instructions described in the "App Infra Services" section of the Cisco Nexus Dashboard User Guide, which is also available in the products GUI.


Deploying Cisco Nexus Dashboard Directly in VMware ESXi

This section describes how to deploy Cisco Nexus Dashboard cluster directly in VMware ESXi. If you prefer to deploy using vCenter, follow the steps described in Deploying Cisco Nexus Dashboard Directly in VMware ESXi instead.

Before you begin

Procedure


Step 1

Obtain the Cisco Nexus Dashboard OVA image.

  1. Browse to the Software Download page.

    https://www.cisco.com/c/en/us/support/data-center-analytics/nexus-dashboard/series.html

  2. Click the Downloads tab.

  3. Choose the Nexus Dashboard version you want to download.

  4. Download the appropriate Cisco Nexus Dashboard image (nd-dk9.<version>.ova).

    For Data nodes, download the nd-dk9.<version>-data.ova.

    For App nodes, download the nd-dk9.<version>-app.ova.

Step 2

Log in to your VMware ESXi.

Depending on the version of your ESXi server, the location and order of configuration screens may differ slightly. The following steps provide deployment details using VMware ESXi 6.7.

Step 3

Right-click the host and select Create/Register VM.

Step 4

In the Select creation type screen, choose Deploy a virtual machine from an OVF or OVA file, then click Next.

Step 5

In the Select OVF and VMDK files screen, provide the virtual machine name (for example, nd-node1) and the OVA image you downloaded in the first step, then click Next.

Step 6

In the Select storage screen, choose the datastore for the VM, then click Next.

Step 7

In the Select OVF and VMDK files screen, provide the virtual machine name (for example, nd-node1) and the OVA image you downloaded in the first step, then click Next.

Step 8

In the Deployment options screen, choose Disk Provisioning: Thick, uncheck the Power on automatically option, then click Next to continue.

There are two networks, fabric0 is used for the data network and mgmt0 is used for the management network.

Step 9

In the Ready to complete screen, verify that all information is accurate and click Finish to begin deploying the first node.

Step 10

Repeat previous steps to deploy the second and third nodes.

You do not need to wait for the first node deployment to complete, you can begin deploying the other two nodes simultaneously.

Step 11

Wait for all three VMs to finish deploying.

Step 12

Ensure that the VMware Tools periodic time synchronization is disabled, then start the VMs.

To disable time synchronization:

  1. Right-click the node's VM and select Edit Settings.

  2. In the Edit Settings window, select the VM Options tab.

  3. Expand the VMware Tools category and uncheck the Synchronize guest time with host option.

Step 13

Open one of the node's console and configure the node's basic information.

  1. Begin initial setup.

    You will be prompted to run the first-time setup utility:

    [ OK ] Started atomix-boot-setup.
           Starting Initial cloud-init job (pre-networking)...
           Starting logrotate...
           Starting logwatch...
           Starting keyhole...
    [ OK ] Started keyhole.
    [ OK ] Started logrotate.
    [ OK ] Started logwatch.
    
    Press any key to run first-boot setup on this console...
  2. Enter and confirm the admin password

    This password will be used for the rescue-user SSH login as well as the initial GUI password.

    Admin Password:
    Reenter Admin Password:
  3. Enter the management network information.

    Management Network:
      IP Address/Mask: 192.168.9.172/24
      Gateway: 192.168.9.1
  4. For the first node only, designate it as the "Cluster Leader".

    You will log into the cluster leader node to finish configuration and complete cluster creation.

    Is this the cluster leader?: y
  5. Review and confirm the entered information.

    You will be asked if you want to change the entered information. If all the fields are correct, choose n to proceed. If you want to change any of the entered information, enter y to re-start the basic configuration script.

    Please review the config
    Management network:
      Gateway: 192.168.9.1
      IP Address/Mask: 192.168.9.172/24
    Cluster leader: no
    
    Re-enter config? (y/N): n

Step 14

Open your browser and navigate to https://<first-node-management-ip> to open the GUI.

The rest of the configuration workflow takes place from the first node's (Cluster Leader) GUI. You do not need to log in to or configure the other two nodes directly.

Enter the password you provided in a previous step and click Begin Setup

Step 15

Enter the password you provided for the first node and click Begin Setup.

Step 16

Provide the Cluster Details.

In the Cluster Details screen of the initial setup wizard, provide the following information:

  1. Provide the Cluster Name for this Nexus Dashboard cluster.

  2. Click +Add NTP Host to add one or more NTP servers.

    You must provide an IP address, fully qualified domain name (FQDN) are not supported.

    After you enter the IP address, click the green checkmark icon to save it.

  3. Click +Add DNS Provider to add one or more DNS servers.

    After you enter the IP address, click the green checkmark icon to save it.

  4. Provide a Proxy Server.

    For clusters that do not have direct connectivity to Cisco cloud, we recommend configuring a proxy server to establish the connectivity, which will allow you to mitigate risk from exposure to non-conformant hardware and software in your fabrics.

    If you want to skip proxy configuration, click the information (i) icon next to the field, then click Skip.

  5. (Optional) If your proxy server required authentication, change Authentication required for Proxy to Yes and provide the login credentials.

  6. (Optional) Expand the Advanced Settings category and change the settings if required.

    Under advanced settings, you can configure the following:

    • Provide one or more search domains by clicking +Add DNS Search Domain.

      After you enter the IP address, click the green checkmark icon to save it.

    • Provide custom App Network and Service Network.

      The application overlay network defines the address space used by the application's services running in the Nexus Dashboard. The field is pre-populated with the default 172.17.0.1/16 value.

      The services network is an internal network used by the Nexus Dashboard and its processes. The field is pre-populated with the default 100.80.0.0/16 value.

      Application and Services networks are described in the Prerequisites and Guidelines section earlier in this document.

  7. Click Next to continue.

Step 17

In the Node Details screen, provide the node's information.

  1. Click the Edit button next to the first node.

  2. Provide the node's Name.

  3. Provide the node's Data Network information.

    The Management Network information is already pre-populated with the information you provided for the first node.

    You must provide the data network IP address, netmask, and gateway. Optionally, you can also provide the VLAN ID for the network. For most deployments, you can leave the VLAN ID field blank.

  4. (Optional) Provide IPv6 addresses for the management and data networks.

    Starting with release 2.1.1, Nexus Dashboard supports dual stack IPv4/IPv6 for the management and data networks.

    Note


    If you want to provide IPv6 information, you must do it during cluster bootstrap process. If you deploy the cluster using only IPv4 stack and want to add IPv6 information later, you would need to redeploy the cluster.

    All nodes in the cluster must be configured with either only IPv4 or dual IPv4/IPv6 stack.

  5. Click Save to save the changes.

Step 18

Click Add Node to add the second node to the cluster.

The Node Details window opens.

  1. Provide the node's Name.

  2. In the Credentials section, provide the node's Management Network IP address and login credentials, then click Verify.

    The IP address and login credentials are used to pull that node's information.

  3. Provide the node's Data Network IP address and gateway.

    The Management Network information will be pre-populated with the information pulled from the node based on the IP address and credentials you provided in the previous sub-step.

    You must provide the data network IP address, netmask, and gateway. Optionally, you can also provide the VLAN ID for the network. For most deployments, you can leave the VLAN ID field blank.

  4. (Optional) Provide IPv6 information for the management and data networks.

    Starting with release 2.1.1, Nexus Dashboard supports dual stack IPv4/IPv6 for the management and data networks.

    Note


    If you want to provide IPv6 information, you must do it during cluster bootstrap process. If you deploy the cluster using only IPv4 stack and want to add IPv6 information later, you would need to redeploy the cluster.

    All nodes in the cluster must be configured with either only IPv4 or dual IPv4/IPv6 stack.

  5. Click Save to save the changes.

Step 19

Repeat the previous step to add the 3rd node.

Step 20

Click Next to continue.

Step 21

In the Confirmation screen, review the entered information and click Configure to create the cluster.

During the node bootstrap and cluster bring-up, the overall progress as well as each node's individual progress will be displayed in the UI.

It may take up to 30 minutes for the cluster to form and all the services to start. When cluster configuration is complete, the page will reload to the Nexus Dashboard GUI.

Step 22

Verify that the cluster is healthy.

It may take up to 30 minutes for the cluster to form and all the services to start.

After all three nodes are ready, you can log in to any one node via SSH and run the following command to verify cluster health:

  1. Verify that the cluster is up and running.

    You can check the current status of cluster deployment by logging in to any of the nodes and running the acs health command.

    While the cluster is converging, you may see the following outputs:

    $ acs health
    k8s install is in-progress
    $ acs health
    k8s services not in desired state - [...]
    $ acs health
    k8s: Etcd cluster is not ready
    When the cluster is up and running, the following output will be displayed:
    $ acs health
    All components are healthy
  2. Log in to the Nexus Dashboard GUI.

    After the cluster becomes available, you can access it by browsing to any one of your nodes' management IP addresses. The default password for the admin user is the same as the rescue-user password you chose for the first node of the Nexus Dashboard cluster.

Step 23

If you plan to host multiple applications in the same cluster, configure deployment profiles for the App Infra Services.

If you plan to host only a single application in your Nexus Dashboard cluster, skip this step.

If you are co-hosting multiple applications in the same cluster, you must configure the App Infra Services with deployment profiles appropriate for your combination of applications and fabric sizes.

After the cluster upgrade is completed, follow the instructions described in the "App Infra Services" section of the Cisco Nexus Dashboard User Guide, which is also available in the products GUI.