Viewing Application Management Details
This section explains how to view application management details using the Cisco Cloud APIC GUI. The application management details include the information of a specific tenant, application profile, EPG, contract, filter, VRF, service, or cloud context profile.
Procedure
| Step 1 |
From the Navigation menu, choose the Application Management tab. When the Application Management tab expands, a list of subtab options appear. See the Application Management Options table for more information.
|
||||||||||||||||||
| Step 2 |
Click the tab that represents the component with the details you want to view. A summary table appears with items as rows in the table. For example, if you chose the Tenants subtab, a list of tenants appear as rows in a summary table You can filter the rows by clicking the Filter by Attributes bar. Choose the attribute, operator and filter-value. For example, for filtering based on a tenant, choose Name == T1 (where T1 is the name of a tenant). |
||||||||||||||||||
| Step 3 |
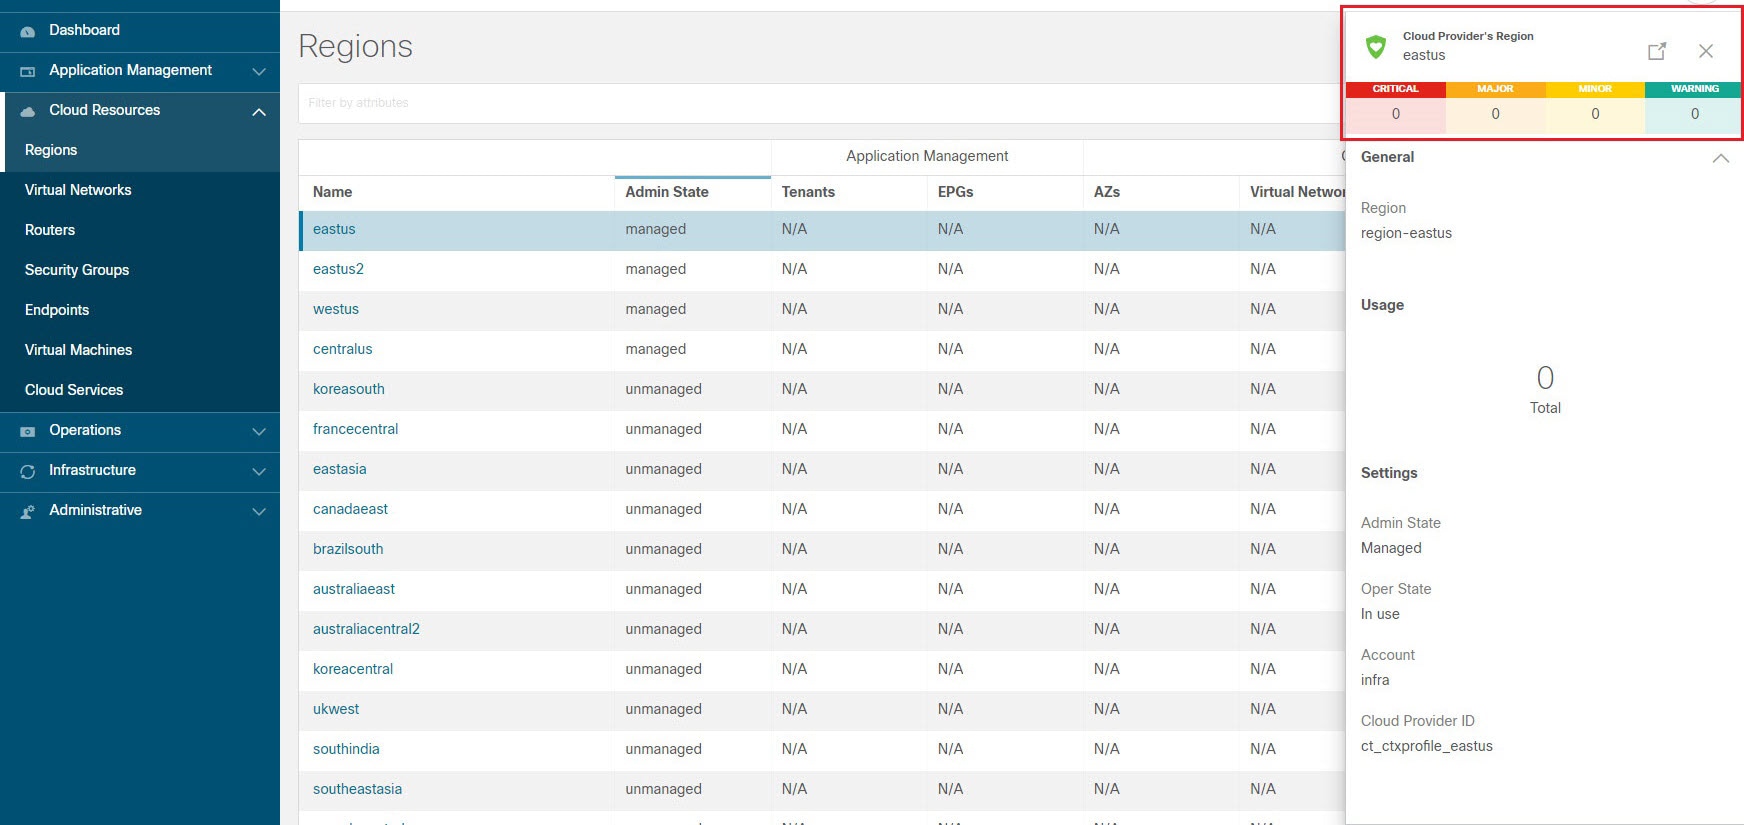
To view a summary pane, click the row that represents the specific component you want to view. |
||||||||||||||||||
| Step 4 |
For more information, double-click the summary table row that represents the specific component you want to view. A new dialog box appears over the work pane with any of the following tabs:
|


 Feedback