Viewing Sensor Performance Data
The Overview window displays the performance data of the active sensors available in the floors of the building. The data is displayed for the selected floor for the selected month. Use this data for your analysis.
Procedure
|
Step 1 |
In Cisco Spaces, click the Menu icon ( Optionally, from the Dashboard drop-down list (left navigation pane of the Cisco Spaces Home window), select Environmental Analytics. The Environmental Analytics window is displayed. |
|
Step 2 |
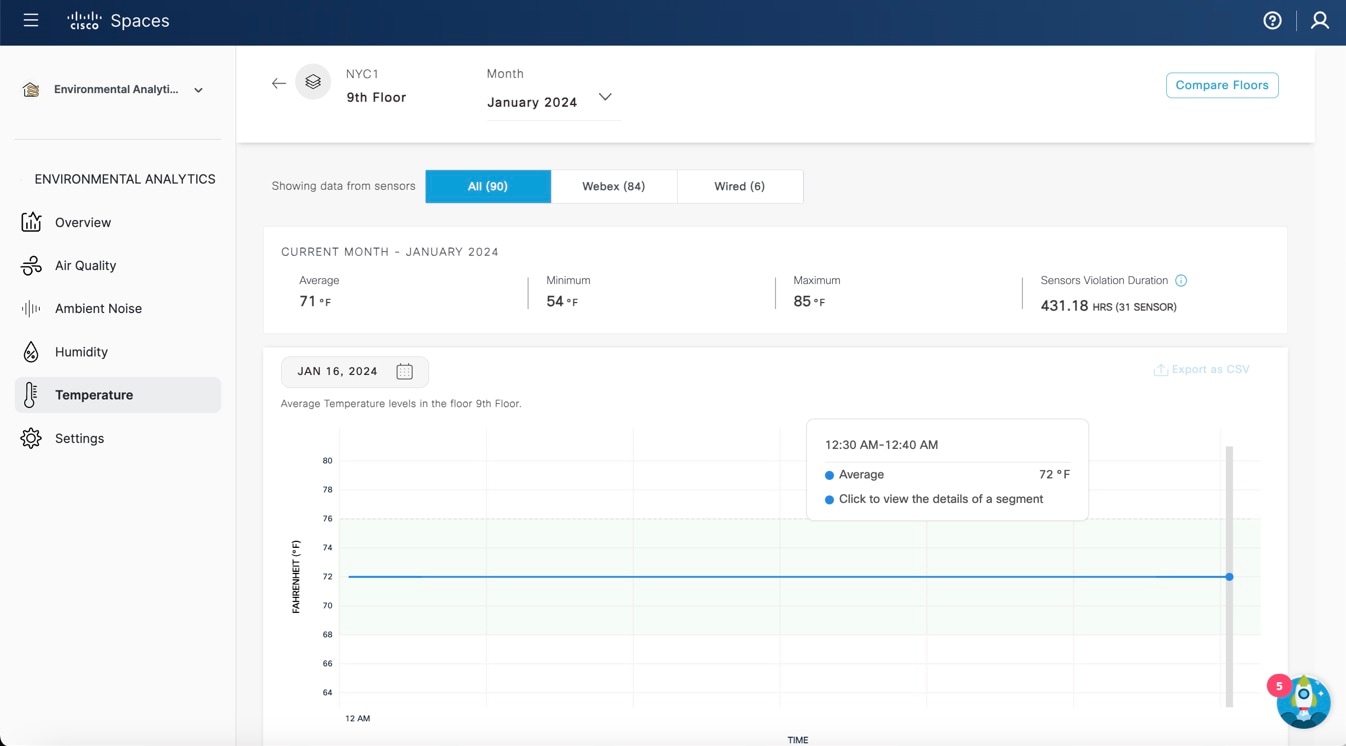
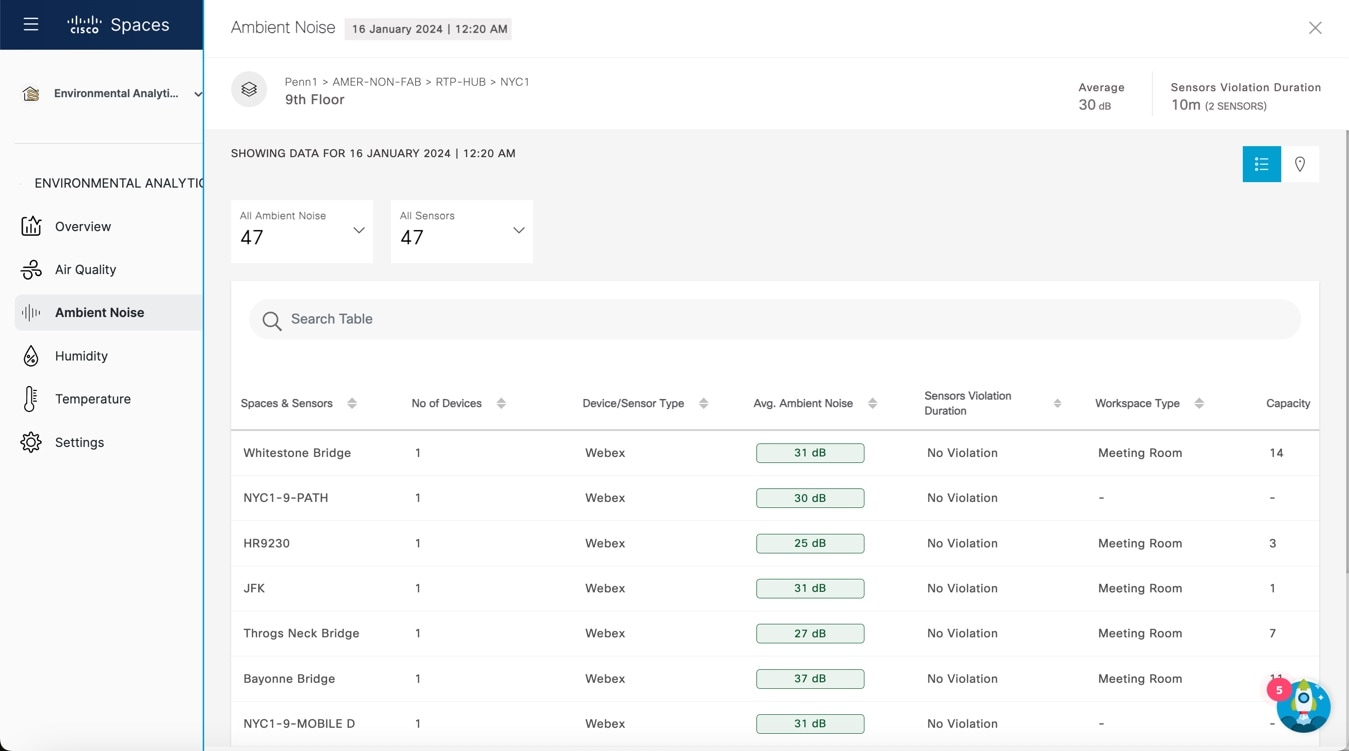
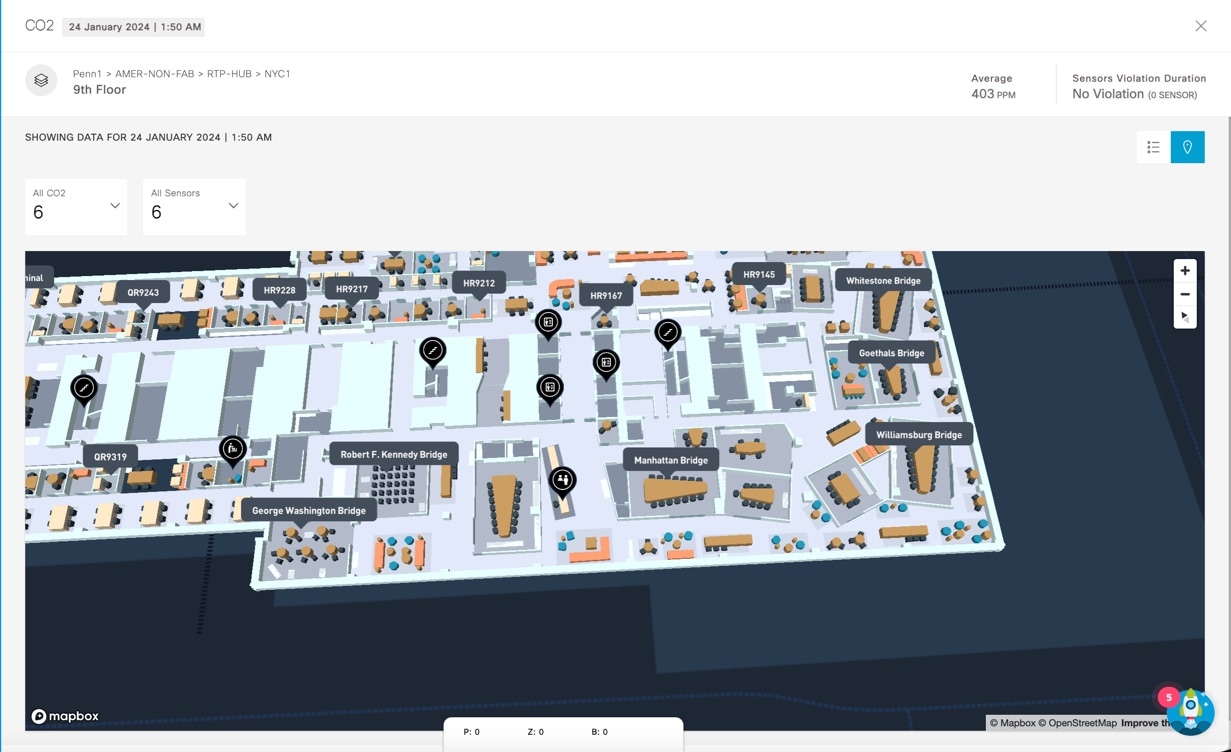
In the left navigation pane, click Overview. The Overview window displays the sensor performance data of the active sensors available in the selected root location or the floor for the month. |
|
Step 3 |
View the sensor data organized as per the following sections:
|
|
Step 4 |
(Optional) To view the sensor data for a different floor or month:
|
|
Step 5 |
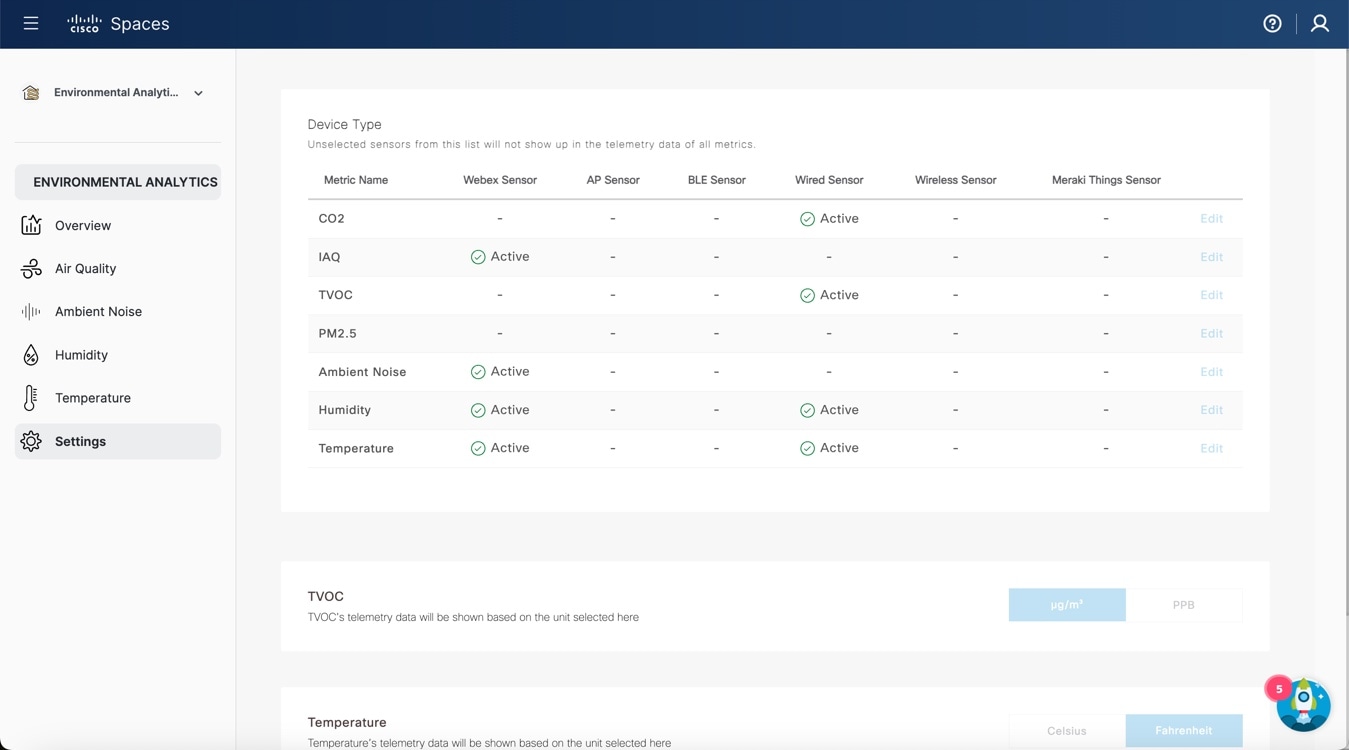
Click the |
 icon to open the corresponding parameter configuration window to perform the required updates.


 Feedback