Packet Capture

Using the Debug Packet Logging Facility

The debug packet logging facility enables you to display all packets going to and from the controller CPU. You can enable it for received packets, transmitted packets, or both. By default, all packets received by the debug facility are displayed. However, you can define access control lists (ACLs) to filter packets before they are displayed. Packets not passing the ACLs are discarded without being displayed.

Each ACL includes an action (permit, deny, or disable) and one or more fields that can be used to match the packet. The debug facility provides ACLs that operate at the following levels and on the following values:

  • Driver ACL

    • NPU encapsulation type

    • Port

  • Ethernet header ACL

    • Destination address

    • Source address

    • Ethernet type

    • VLAN ID

  • IP header ACL

    • Source address

    • Destination address

    • Protocol

    • Source port (if applicable)

    • Destination port (if applicable)

  • EoIP payload Ethernet header ACL

    • Destination address

    • Source address

    • Ethernet type

    • VLAN ID

  • EoIP payload IP header ACL

    • Source address

    • Destination address

    • Protocol

    • Source port (if applicable)

    • Destination port (if applicable)

  • CAPWAP payload 802.11 header ACL

    • Destination address

    • Source address

    • BSSID

    • SNAP header type

  • CAPWAP payload IP header ACL

    • Source address

    • Destination address

    • Protocol

    • Source port (if applicable)

    • Destination port (if applicable)

At each level, you can define multiple ACLs. The first ACL that matches the packet is the one that is selected.

This section contains the following subsection:

Configuring the Debug Facility (CLI)

Procedure


Step 1

To enable the debug facility, enter this command:

  • debug packet logging enable {rx | tx | all} packet_count display_size

    where

    • rx displays all received packets, tx displays all transmitted packets, and all displays both transmitted and received packets.

    • packet_count is the maximum number of packets to log. You can enter a value between 1 and 65535 packets, and the default value is 25 packets.

    • display_size is the number of bytes to display when printing a packet. By default, the entire packet is displayed.

      Note 

      To disable the debug facility, enter this command: debug packet logging disable .

  • debug packet logging acl driver rule_index action npu_encap port

    where

    • rule_index is a value between 1 and 6 (inclusive).

    • action is permit, deny, or disable.

    • npu_encap specifies the NPU encapsulation type, which determines how packets are filtered. The possible values include dhcp, dot11-mgmt, dot11-probe, dot1x, eoip-ping, iapp, ip, lwapp, multicast, orphan-from-sta, orphan-to-sta, rbcp, wired-guest, or any.

    • port is the physical port for packet transmission or reception.

  • Use these commands to configure packet-logging ACLs:

    debug packet logging acl eth rule_index action dst src type vlan

    where

    • rule_index is a value between 1 and 6 (inclusive).

    • action is permit, deny, or disable.

    • dst is the destination MAC address.

    • src is the source MAC address.

    • type is the two-byte type code (such as 0x800 for IP, 0x806 for ARP). This parameter also accepts a few common string values such as “ip” (for 0x800) or “arp” (for 0x806).

    • vlan is the two-byte VLAN ID.

  • debug packet logging acl ip rule_index action src dst proto src_port dst_port

    where

    • proto is a numeric or any string recognized by getprotobyname(). The controller supports the following strings: ip, icmp, igmp, ggp, ipencap, st, tcp, egp, pup, udp, hmp, xns-idp, rdp, iso-tp4, xtp, ddp, idpr-cmtp, rspf, vmtp, ospf, ipip, and encap.

    • src_port is the UDP/TCP two-byte source port (for example, telnet, 23) or “any.” The controller accepts a numeric or any string recognized by getservbyname(). The controller supports the following strings: tcpmux, echo, discard, systat, daytime, netstat, qotd, msp, chargen, ftp-data, ftp, fsp, ssh, telnet, smtp, time, rlp, nameserver, whois, re-mail-ck, domain, mtp, bootps, bootpc, tftp, gopher, rje, finger, www, link, kerberos, supdup, hostnames, iso-tsap, csnet-ns, 3com-tsmux, rtelnet, pop-2, pop-3, sunrpc, auth, sftp, uucp-path, nntp, ntp, netbios-ns, netbios-dgm, netbios-ssn, imap2, snmp, snmp-trap, cmip-man, cmip-agent, xdmcp, nextstep, bgp, prospero, irc, smux, at-rtmp, at-nbp, at-echo, at-zis, qmtp, z3950, ipx, imap3, ulistserv, https, snpp, saft, npmp-local, npmp-gui, and hmmp-ind.

    • dst_port is the UDP/TCP two-byte destination port (for example, telnet, 23) or “any.” The controller accepts a numeric or any string recognized by getservbyname(). The controller supports the same strings as those for the src_port .

  • debug packet logging acl eoip-eth rule_index action dst src type vlan

  • debug packet logging acl eoip-ip rule_index action src dst proto src_port dst_port

  • debug packet logging acl lwapp-dot11 rule_index action dst src bssid snap_type

    where

    • bssid is the Basic Service Set Identifier.

    • snap_type is the Ethernet type.

  • debug packet logging acl lwapp-ip rule_index action src dst proto src_port dst_port

    Note 

    To remove all configured ACLs, enter this command: debug packet logging acl clear-all .

Step 2

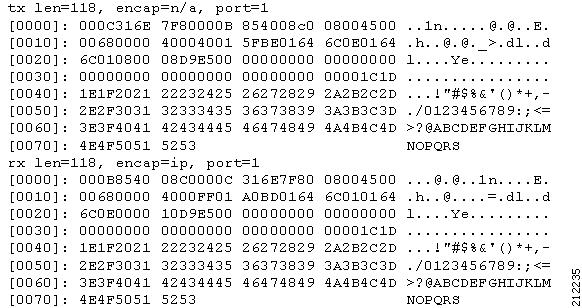
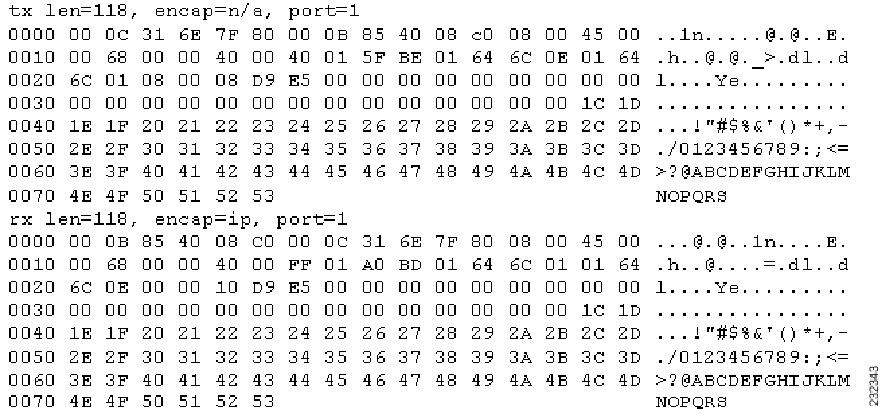
To configure the format of the debug output, enter this command:

debug packet logging format {hex2pcap | text2pcap}

The debug facility supports two output formats: hex2pcap and text2pcap. The standard format used by IOS supports the use of hex2pcap and can be decoded using an HTML front end. The text2pcap option is provided as an alternative so that a sequence of packets can be decoded from the same console log file.
Figure 1. Sample Hex2pcap Output. This figure shows an example of hex2pcap output.

Figure 2. Sample Text2pcap Output. This figure shows an example of text2pcap output.

Step 3

To determine why packets might not be displayed, enter this command:

debug packet error {enable | disable}
Step 4

To display the status of packet debugging, enter this command:

show debug packet

Information similar to the following appears:


Status........................................... disabled
Number of packets to display..................... 25
Bytes/packet to display.......................... 0
Packet display format............................ text2pcap

Driver ACL:
      [1]: disabled
      [2]: disabled
      [3]: disabled
      [4]: disabled
      [5]: disabled
      [6]: disabled
   Ethernet ACL:
      [1]: disabled
      [2]: disabled
      [3]: disabled
      [4]: disabled
      [5]: disabled
      [6]: disabled
   IP ACL:
      [1]: disabled
      [2]: disabled
      [3]: disabled
      [4]: disabled
      [5]: disabled
      [6]: disabled
   EoIP-Ethernet ACL:
      [1]: disabled
      [2]: disabled
      [3]: disabled
      [4]: disabled
      [5]: disabled
      [6]: disabled
   EoIP-IP ACL:
      [1]: disabled
      [2]: disabled
      [3]: disabled
      [4]: disabled
      [5]: disabled
      [6]: disabled
   LWAPP-Dot11 ACL:
      [1]: disabled
      [2]: disabled
      [3]: disabled
      [4]: disabled
      [5]: disabled
      [6]: disabled
   LWAPP-IP ACL:
      [1]: disabled
      [2]: disabled
      [3]: disabled
      [4]: disabled
      [5]: disabled
      [6]: disabled?

Wireless Sniffing

The controller enables you to configure an AP as a network sniffer, which captures and forwards all the packets on a particular channel to a remote machine that runs packet analyzer software. These packets contain information on time stamps, signal strength, packet sizes, and so on. Sniffers allow you to monitor and record network activity and to detect problems.

For more information about wireless sniffing using Cisco APs in Sniffer mode, see https://www.cisco.com/c/en/us/support/docs/wireless-mobility/80211/200527-Fundamentals-of-802-11-Wireless-Sniffing.html#anc11.

This section contains the following subsections:

Prerequisites for Wireless Sniffing

To perform wireless sniffing, you need the following hardware and software:

  • A dedicated access point—An access point configured as a sniffer cannot simultaneously provide wireless access service on the network. To avoid disrupting coverage, use an access point that is not part of your existing wireless network.

  • A remote monitoring device—A computer capable of running the analyzer software.

  • Software and supporting files, plug-ins, or adapters—Your analyzer software may require specialized files before you can successfully enable

Restrictions on Wireless Sniffing

  • Supported third-party network analyzer software applications are as follows:

    • Wildpackets Omnipeek or Airopeek

    • AirMagnet Enterprise Analyzer

    • Wireshark

  • The latest version of Wireshark can decode the packets by going to the Analyze mode. Select decode as, and switch UDP5555 to decode as PEEKREMOTE.

  • You must disable IP-MAC address binding in order to use an access point in sniffer mode if the access point is joined to a controller. To disable IP-MAC address binding, enter the config network ip-mac-binding disable command in the controller CLI.

  • You must enable WLAN 1 in order to use an access point in sniffer mode if the access point is joined to a controller. If WLAN 1 is disabled, the access point cannot send packets.

  • Issue: AP disconnections, traffic destined to controller received using AP sniffer radio MAC address.

    Conditions: These issues are observed if APs are configured to operate in sniffer mode and controller sends sniffed traffic to configured destination. These issues impact scenarios where the controller is connected to Cisco Application Centric Infrastructure (ACI) Fabric and data gleaning is used for IP-MAC address binding.

    Workaround: Avoid using APs in sniffer mode or do not use data gleaning for IP-MAC address binding.

Configuring Sniffing on an Access Point (GUI)

Procedure


Step 1

Choose Wireless > Access Points > All APs to open the All APs page.

Step 2

Click the name of the access point that you want to configure as the sniffer. The All APs > Details for page appears.

Step 3

From the AP Mode drop-down list, choose Sniffer.

Step 4

Click Apply.

Step 5

Click OK when prompted that the access point will be rebooted.

Step 6

Choose Wireless > Access Points > Radios > 802.11a/n (or 802.11b/g/n) to open the 802.11a/n/ac (or 802.11b/g/n) Radios page.

Step 7

Hover your cursor over the blue drop-down arrow for the desired access point and choose Configure. The 802.11a/n/ac (or 802.11b/g/n) Cisco APs > Configure page appears.

Step 8

Select the Sniff check box to enable sniffing on this access point, or leave it unselected to disable sniffing. The default value is unchecked.

Step 9

If you enabled sniffing in Step 8, follow these steps:

  1. From the Channel drop-down list, choose the channel on which the access point sniffs for packets.

  2. In the Server IP Address text box, enter the IP address of the remote machine running Omnipeek, Airopeek, AirMagnet, or Wireshark.

Step 10

Click Apply.

Step 11

Click Save Configuration.


Configuring Sniffing on an Access Point (CLI)

Procedure


Step 1

Configure the access point as a sniffer by entering this command:

config ap mode sniffer Cisco_AP

where Cisco_AP is the access point configured as the sniffer.

Step 2

When warned that the access point will be rebooted and asked if you want to continue, enter Y. The access point reboots in sniffer mode.

Step 3

Enable sniffing on the access point by entering this command:

config ap sniff {802.11a | 802.11b} enable channel server_IP_address Cisco_AP

where

  • channel is the radio channel on which the access point sniffs for packets. The default values are 36 (802.11a/n/ac) and 1 (802.11b/g/n).

  • server_IP_address is the IP address of the remote machine running Omnipeek, Airopeek, AirMagnet, or Wireshark.

  • Cisco_AP is the access point configured as the sniffer.

    Note 

    To disable sniffing on the access point, enter the config ap sniff {802.11a | 802.11b} disable Cisco_AP command.

Step 4

Save your changes by entering this command:

save config

Step 5

See the sniffer configuration settings for an access point by entering this command:

show ap config {802.11a | 802.11b} Cisco_AP