Troubleshooting

This chapter provides information and instructions for using the system command line interface (CLI) for troubleshooting any issues that may arise during system operation.

Refer to the ASR 5500 Installation Guide for comprehensive descriptions of the hardware components addressed by these troubleshooting procedures.

Detecting Faulty Hardware

When power is applied to the chassis, power is sequentially applied to the Management I/O (MIO/UMIO/MIO2) cards, Data Processing Cards (DPC/UDPC/DPC2/UDPC2s), Fabric and Storage Cards (FSCs), and System Status Cards (SSCs).

Each PFU and card installed in the system incorporates light emitting diodes (LEDs) that indicate its operating status. This section describes how to use these status LEDs to verify that all of the installed components are functioning properly.


Important


As the system progresses through its boot process, some cards will not exhibit immediate LED activity. Allow several minutes to elapse after a reboot is initiates before checking the LEDs on the various cards to verify that the boot process has successfully completed.


Licensing Issues

The system boot process is governed by StarOS licenses. During the startup process, each card performs a series of Power-On Self Tests (POSTs) to ensure that the hardware is operational. These tests also verify that the card meets all license requirements to operate in this chassis.

Refer to Chassis Universal License Requirements in the ASR 5500 Installation Guide for additional information on the effect licenses and card types have on the boot process.

Using the CLI to View Status LEDs

Status LEDs for all cards can be viewed via the CLI by entering the Exec mode show leds all command.

[local]host_name# show leds all 

The following displays a sample of this command's output.

Slot 01: Run/Fail: Green | Active: Off    | Redundant: Green 
Slot 02: Run/Fail: Green         | Active: Off    | Redundant: Green 
Slot 03: Run/Fail: Green         | Active: Off    | Redundant: Green 
Slot 05: Run/Fail: Green         | Active: Green  | Redundant: Green    Master: Green 
Slot 06: Run/Fail: Green         | Active: Off    | Redundant: Green    Master:Off 
Slot 08: Run/Fail: Green         | Active: Off    | Redundant: Green 
Slot 11: Run/Fail: Green         | Active: Green  | Redundant: Green    Status: Green  | Service: Off  
Slot 12: Run/Fail: Green         | Active: Green  | Redundant: Green    Status: Green  | Service: Off  
Slot 13: Run/Fail: Green         | Active: Green  | Redundant: Green 
Slot 14: Run/Fail: Green         | Active: Green  | Redundant: Green 
Slot 15: Run/Fail: Green         | Active: Green  | Redundant: Green 
Slot 16: Run/Fail: Green         | Active: Green  | Redundant: Green 
Slot 17: Run/Fail: Green         | Active: Green  | Redundant: Green 

The status of the two Power Filter Units (PFUs) can be viewed by entering the Exec mode show power chassis command.

Checking the LEDs on the PFU

Each PFU has four LEDs along the top edge of its front panel. You must unsnap the top front cover from the chassis to view these LEDs. Each LED is associated with one of the four -48 VDC power feeds connected to the PFU.

Each LED on the PFU should illuminate blue for normal operating conditions.

Figure 1. PFU LEDs


The possible states for these LEDs are described in the following table. If the LED is not blue, use the troubleshooting information below to diagnose the problem.
Table 1. PFU LED States
Color Description Troubleshooting
Blue Power feed is supplying -48VDC to this power plane None needed.
None PFU is not receiving power to one or more of its power planes. Verify that each circuit breaker is in the ON position.
Verify that the RTN and -48VDC lugs are attached properly to the posts on the upper rear of the chassis.
Verify that the ground lug is attached properly.
Use a voltmeter to verify that the power distribution panel is supplying the correct voltage and sufficient current to the terminals at the rear of the PFU.
Check the cables from the power source to the rack for continuity.
If a power distribution panel (PDP) is installed between the power distribution frame (PDF) and the chassis, verify that its circuit breakers are set to ON.
If a PDP is installed between the PDF and the chassis, check the cables from the PDP to the chassis for continuity.
If all of the above suggestions have been verified, then it is likely that the PFU is not functional. Please contact your service representative.

Checking the LEDs on the MIO Card

Each MIO/UMIO/MIO2 is equipped with the following LEDs:

  • Run/Fail

  • Active

  • Redundancy

  • Master

  • Busy

Figure 2. MIO Card Status LEDs


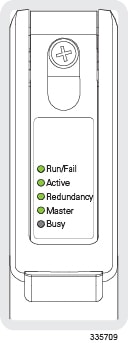
The possible states for all MIO/UMIO/MIO2 LEDs are described in the sections that follow.

MIO Run/Fail LED States

The MIO/UMIO/MIO2 Run/Fail LED indicates the overall status of the card. This LED should be steady green for normal operation.

The possible states for this LED are described in the following table. If the LED is not green, use the troubleshooting information in the table to diagnose the problem.
Table 2. MIO Run/Fail LED States
Color Description Troubleshooting
Green Card powered with no errors detected

None needed.

Blinking Green Card is initializing and/or loading software

This is normal operation during boot-up.

Red Card powered with error(s) detected

Errors were detected during the Power On Self Tests (POSTs). It is likely that the errors were logged to the system's command line interface during boot.

None Card is not receiving power Verify that the LEDs on the PFUs are blue. If they are not, refer to Checking the LEDs on the PFU for troubleshooting information.
Verify that the power source is supplying ample voltage and current to the chassis.
Verify that the card is properly installed per the instructions in the ASR 5500 Installation Guide.
If all of the above suggestions have been verified, it is possible that the MIO is not functional. Please contact your service representative.

MIO Active LED States

The Active LED on the MIO/UMIO/MIO2 indicates that the software is loaded on the card and it is ready for operation. For the MIO installed in chassis slot 5, this LED should be green for normal operation. For the MIO installed in slot 6, this LED should be off for normal operation.

The possible states for this LED are described in the following table. If the LED is not green, use the troubleshooting information in the table to diagnose the problem.
Table 3. Active LED States
Color Description Troubleshooting
Green Card is active None needed for the MIO/UMIO/MIO2 in slot 5. If green for the MIO/UMIO/MIO2 in slot 6, verify that the MIO/UMIO/MIO2 in slot 5 is installed and licensed properly according to the instructions in the ASR 5500 Installation Guide.
Blinking Green Tasks or processes being migrated from the active MIO to the standby MIO. Refer to Monitoring the System for information on determining the status of the MIO/UMIO/MIO2 and system software processes.
None

Card is not receiving power.

OR

Card has failed.

Verify that the Run/Fail LED is green. If so, the card is receiving power and POST results are positive. If it is off, refer to MIO Run/Fail LED States for troubleshooting information.

MIO Redundancy LED States

The Redundancy LED on the MIO/UMIO/MIO2 indicates that software is loaded on the card, but it is serving as a redundant component. For the MIO/UMIO/MIO2 installed in slot 6, this LED should be green for normal operation. For the MIO/UMIO installed in slot 8, this LED should be off for normal operation.

The possible states for this LED are described in the following table. If the LED is not green, use the troubleshooting information in the table to diagnose the problem.
Table 4. MIO Redundancy LED States
Color Description Troubleshooting
Green Card is in redundant mode None needed. If green for the MIO/UMIO/MIO2s in slot 5 and slot 6, the cards and ports are fully backed up.
Amber Card or port on this card is not backed up by other MIO. Check the status of the other MIO/UMIO/MIO2. If it has failed or one or more of its ports are no longer active, the system can continue to function but redundancy is compromised.
Refer to Monitoring the System for information on determining the status of the MIO/UMIO/MIO2 and system software processes.
Blinking Amber Tasks or processes being migrated from the active MIO to the standby MIO. Refer to Monitoring the System for information on determining the status of the MIO/UMIO/MIO2 and system software processes.
None

Card is not receiving power.

OR

Card has failed.

Verify that the Run/Fail LED is green. If so, the card is receiving power and POST results are positive. If it is off, refer to MIO Run/Fail LED States for troubleshooting information on.

MIO Master LED States

The Master LED on the MIO/UMIO/MIO2 indicates whether the card is in Active or Standby mode.

The possible states for this LED are described in the following table. If the LED is not green, use the troubleshooting information also provided to diagnose the problem.
Table 5. MIO Master LED States
Color Description Troubleshooting
Green This card is the Active MIO.

None needed.

Blinking Green Tasks or processes being migrated from the active MIO to the standby MIO.

Refer to Monitoring the System for information on determining the status of the MIO/UMIO /MIO2and system software processes.

None

This card is the Standby MIO.

OR

Card has failed.

Verify that the Run/Fail LED is green. If so, the card is receiving power and POST results are positive. If it is off, refer to MIO Run/Fail LED States for troubleshooting information.
Refer to Monitoring the System for information on determining the status of he MIO/UMIO/MIO2 and system software processes.

MIO Busy LED States

The Busy LED on the MIO/UMIO/MIO2 indicates that the card is accessing the RAID solid state drives on the FSCs.

This LED is off when no file storage activity is occurring.

The possible states for this LED are described in the following table. If the LED is not green, use the troubleshooting information in the table to diagnose the problem.
Table 6. MIO Busy LED States
Color Description Troubleshooting
Green Files are being transferred to or accessed from the RAID configuration on the FSCs. None required.
None

No RAID activity.

OR

RAID configuration is unavailable.

Checking the LEDs on the FSC

MIO – Interface Link LED States

The Link LED associated with a 1000Base-T (management) or 10 Gigabit Ethernet port on an MIO/UMIO daughter card (subscriber traffic) indicates the status of the network link. This LED should be green for normal operation.

The possible states for this LED are described in the following table. If the LED is not green, use the troubleshooting information in the table to diagnose the problem.
Table 7. MIO – Interface Link LED States
Color Description Troubleshooting
Green Link is up

None needed.

NOTE: This LED will not indicate the presence of a network link until the interface parameters are set during the software configuration process.

None

No power to card.

OR

Link is down.

Verify that the Run/Fail LED is green. If so, the card is receiving power. If it is off, refer to MIO Run/Fail LED States for troubleshooting information.
Verify that the interface is cabled properly.
Verify that the device on which the interface is located is cabled and powered properly.

MIO – Interface Activity LED States

The Activity LED associated with a 1000Base-T (management) or 10 Gigabit Ethernet port on an MIO/UMIO/MIO2 daughter card (subscriber traffic) indicates the presence of traffic on the network link. This LED should be green when data is being transmitted or received over the interface.

The possible states for this LED are described in the following table. If the LED is not green, use the troubleshooting information in the table to diagnose the problem.
Table 8. MIO – Interface Activity LED States
Color Description Troubleshooting
Flashing Green Traffic is present on the link

None needed.

None No traffic is present on the link

None needed if there is no activity on the link. Prior to interface configuration, this is normal operation.

Checking the LEDs on the DPC

Each DPC/UDPC or /DPC2/UDPC2 is equipped with status LEDs as listed below:

  • Run/Fail

  • Active

  • Redundancy

Figure 3. DPC Status LEDs


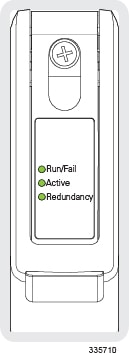
The possible states for all of the DPC/UDPC or /DPC2/UDPC2 LEDs are described in the sections that follow.

DPC Run/Fail LED States

The DPC/UDPC or /DPC2/UDPC2 Run/Fail LED indicates the overall status of the card. This LED should be green for normal operation.

The possible states for this LED are described in the following table. If the LED is not green, use the troubleshooting information in the table to diagnose the problem.
Table 9. DPC Run/Fail LED States
Color Description Troubleshooting
Green Card powered up with no errors detected. None needed.
Blinking Green Card is initializing and/or loading software. This is normal operation during boot-up.
Red Card powered up with error(s) detected. Errors were detected during the Power On Self Tests (POSTs). It is likely that the errors were logged to the system's command line interface during boot.
None Card is not receiving power. Verify that the LEDs on the PFUs are blue. If they are not, refer to Checking the LEDs on the PFU for troubleshooting information.
Verify that the power source is supplying ample voltage and current to the chassis.
Verify that the card is properly installed and licensed per the instructions in the ASR 5500 Installation Guide.
If all of the above suggestions have been verified, it is possible that the DPC/UDPC or /DPC2/UDPC2 is not functional. Please contact your service representative.

DPC Active LED States

The Active LED on the DDPC/UDPCPC or /DPC2/UDPC2 indicates that the software is loaded on the card and that the card is ready for operation. When the system first boots up, all installed DPC/UDPCs or /DPC2/UDPC2s are booted into standby mode. The system must then be configured as to which DPC/UDPCs or /DPC2/UDPC2s should serve as redundant components (remain in standby mode) and which should function as active components.

The possible states for this LED are described in the following table. If the LED is not green, use the troubleshooting information in the table to diagnose the problem.
Table 10. DPC Active LED States
Color Description Troubleshooting
Green Card is active. The first time power is applied to the system, all of the DPC/UDPCs or /DPC2/UDPC2s should be booted into the standby mode. Therefore, this LED should be off.
Blinking Green Tasks or processes are being migrated from an active DPC to a standby DPC. Verify that the Redundancy LED on a standby DPC/UDPC or /DPC2/UDPC2 is also blinking green. If so, there is an issue with the active DPC/UDPC or /DPC2/UDPC2 and it is transferring its processes.
Refer to Monitoring the System for information on determining the status of the DPC/UDPC or /DPC2/UDPC2 and system software processes and functionality.
None

Card is not receiving power.

OR

Card is in Standby Mode.

Verify that the Run/Fail LED is green. If so, the card is receiving power and POST results are positive. If it is off, refer to DPC Run/Fail LED States for troubleshooting information.
Check the state of the Redundancy LED. If it is green, the card is in standby mode. This is normal operation for the initial power-up. If needed, refer to the Configuring DPC Availability section of System Settings for information on making the card active.

DPC Redundancy LED States

The Redundancy LED on the DPC/UDPC or /DPC2/UDPC2 indicates that software is loaded on the card, but it is serving as a standby component. DPC/UDPCs or /DPC2/UDPC2s support n:1 redundancy; the Redundancy LED should be green on only one DPC/UDPC or /DPC2/UDPC2 for normal system operation.

The possible states for this LED are described in the following table. If the LED is not green, use the troubleshooting information in the table to diagnose the problem.
Table 11. DPC Redundancy LED States
Color Description Troubleshooting
Green Card is in standby mode. None needed. There is at least one DPC/UDPC or /DPC2/UDPC2 in Standby mode.
Amber Card is not backed up by a standby DPC. Check the status of the other DPC/UDPCs or /DPC2/UDPC2s. If one DPC/UDPC or /DPC2/UDPC2 has failed or has been removed from the chassis, the system can continue to function but redundancy is compromised.
Refer to Monitoring the System for information on determining the status of the DPC/UDPC or /DPC2/UDPC2 and system software processes.
Blinking Amber Tasks or processes being migrated from an active DPC to the standby DPC. Refer to Monitoring the System for information on determining the status of the DPC/UDPC or /DPC2/UDPC2 and system software processes.
None

Card is not receiving power.

OR

Card has failed.

Verify that the Run/Fail LED is green. If so, the card is receiving power and POST results are positive. If it is off, refer to DPC Run/Fail LED States for troubleshooting information.

Checking the LEDs on the FSC

Each FSC is equipped with the following LEDs as shown in the accompanying figure:

  • Run/Fail

  • Active

  • Redundancy

  • Drive 1 Activity

  • Drive 2 Activity

Figure 4. FSC Status LEDs


The possible states for all FSC LEDs are described in the sections that follow.

FSC Run/Fail LED States

The FSC Run/Fail LED indicates the overall status of the card. This LED should be green for normal operation.

The possible states for this LED are described in the following table. If the LED is not green, use the troubleshooting information in the table to diagnose the problem.
Table 12. FSC Run/Fail LED States
Color Description Troubleshooting
Green Card powered with no errors detected None needed.
Blinking Green Card is initializing and/or loading software This is normal operation during boot-up.
Red Card powered with error(s) detected Errors were detected during the Power On Self Tests (POSTs). It is likely that the errors were logged to the system's command line interface during boot.
None Card is not receiving power Verify that the LEDs on the PFUs are blue. If they are not, refer to Checking the LEDs on the PFU for troubleshooting information.
Verify that the power source is supplying ample voltage and current to the chassis.
Verify that the card is properly installed per the instructions in the ASR 5500 Installation Guide.
If all of the above suggestions have been verified, it is possible that the FSC is not functional. Please contact your service representative.

FSC Active LED States

The Active LED on the FSC indicates that the software is loaded on the card and that the card is ready for operation. When the system first boots up, all installed FSCs are booted into ready mode.

The possible states for this LED are described in the following table. If the LED is not green, use the troubleshooting information in the table to diagnose the problem.
Table 13. FSC Active LED States
Color Description Troubleshooting
Green Card is active.

The first time power is applied to the system, all of the FSCs should be booted into the ready mode. Therefore, this LED should be on.

Blinking Green Tasks or processes being migrated from an active FSC to a standby FSC. Verify that the Redundancy LED on a standby FSC is also blinking green. If so, there is an issue with the active FSC and it is transferring its processes.
Refer to Monitoring the System for information on determining the status of the FSC and system software processes and functionality.
None

Card is not receiving power.

OR

Card is in Standby Mode.

Verify that the Run/Fail LED is green. If so, the card is receiving power and POST results are positive. If it is off, refer to FSC Run/Fail LED States for troubleshooting information.
Check the state of the Redundancy LED. If it is green, the card is in standby mode.

FSC Redundancy LED States

The Redundancy LED on the FSC indicates that software is loaded on the card, but it is serving as a redundant component. FSC support n+1 redundancy; the Redundancy LED should be green on only one FSC for normal system operation.

The possible states for this LED are described in the following table. If the LED is not green, use the troubleshooting information in the table to diagnose the problem.
Table 14. FSC Redundancy LED States
Color Description Troubleshooting
Green Card is in redundant mode

None needed. There is at least one FSC in Standby mode.

Amber Card is not backed up by a standby FSC. Check the status of the other FSCs. If one FSC has failed or has been removed from the chassis, the system can continue to function but redundancy is compromised.
Refer to Monitoring the System for information on determining the status of the FSC and system software processes.
Blinking Amber Tasks or processes being migrated from an active FSC to the standby FSC.

Refer to Monitoring the System for information on determining the status of the FSC and system software processes.

None

Card is not receiving power.

OR

Card has failed.

Verify that the Run/Fail LED is green. If so, the card is receiving power and POST results are positive. If it is off, refer to FSC Run/Fail LED States for troubleshooting information.

FSC Drive n Activity LED States

The Drive 1 Activity and Drive 2 Activity LEDs on the FSC indicate that the RAID solid state drives (SSDs) are being accessed by the MIO. Drive 1 and Drive 2 on each FSC form a RAID 0 configuration.


Important


The FSC-400GB is equipped with a single 400 GB drive. Only the Drive 1 Activity LED will be active; the Drive 2 Activity LED will always be off (None).


The possible states for this LED are described in the following table. If the LED is not green, use the troubleshooting information also provided to diagnose the problem.
Table 15. FSC Driven Activity LED States
Color Description Troubleshooting
Green Files are being transferred to or accessed from the RAID configuration by the MIO. None required.
None

There is no RAID activity.

OR

RAID configuration is unavailable.

Checking the LEDs on the MIO Card

FSC-400GB is not equipped with a second SDD. Only the Drive 1 Activity LED will be active.

None Card is not receiving power Verify that the Run/Fail LED is green. If so, the card is receiving power and POST results are positive. If it is off, refer to FSC Run/Fail LED States for troubleshooting information.

Checking the LEDs on the SSC

Each SSC is equipped with the following LEDs as shown in the accompanying figure:

  • Run/Fail

  • Active

  • Redundancy

  • System Status

  • System Service

Figure 5. SSC Status LEDs


The possible states for all SSC LEDs are described in the sections that follow.

SSC Run/Fail LED States

The SSC Run/Fail LED indicates the overall status of the card. This LED should be green for normal operation.

The possible states for this LED are described in the following table. If the LED is not green, use the troubleshooting information in the table to diagnose the problem.
Table 16. SSC Run/Fail LED States
Color Description Troubleshooting
Green Card powered with no errors detected None needed.
Blinking Green Card is initializing and/or loading software This is normal operation during boot-up.
Red Card powered with error(s) detected Errors were detected during the Power On Self Tests (POSTs). It is likely that the errors were logged to the system's command line interface during boot.
None Card is not receiving power Verify that the LEDs on the PFUs are blue. If they are not, refer to Checking the LEDs on the PFU for troubleshooting information.
Verify that the power source is supplying ample voltage and current to the chassis.
Verify that the card is properly installed per the instructions in the ASR 5500 Installation Guide.
If all of the above suggestions have been verified, it is possible that the SSC is not functional. Please contact your service representative.

SSC Active LED States

The Active LED on the SSC indicates that the software is loaded on the card and that the card is ready for operation. When the system first boots up, both SSCs are booted into ready mode.

The possible states for this LED are described in the following table. If the LED is not green, use the troubleshooting information in the table to diagnose the problem.

Table 17. SSC Active LED States
Color Description Troubleshooting
Green Card is active.

The first time power is applied to the system, both SSCs should be booted into the ready mode. Therefore, this LED should be on.

Blinking Green Tasks or processes being migrated from an active FSC to a standby FSC. Verify that the Redundancy LED on a Standby SSC is also blinking green. If so, there is an issue with the active SSC and it is transferring its processes.
Refer to Monitoring the System for information on determining the status of the SSC and system software processes and functionality.
None

Card is not receiving power.

OR

Card is in Standby Mode.

Verify that the Run/Fail LED is green. If so, the card is receiving power and POST results are positive. If it is off, refer to the SSC Run/Fail LED States section for troubleshooting information.
Check the state of the Redundancy LED. If it is green, the card is in standby mode.

SSC Redundancy LED States

The Redundancy LED on the SSC indicates that software is loaded on the card, but it is serving as a standby component. SSC support 1:1 redundancy; the Redundancy LED should be green on the other SSC for normal system operation.

The possible states for this LED are described in the following table. If the LED is not green, use the troubleshooting information in the table to diagnose the problem.
Table 18. SSC Redundancy LED States
Color Description Troubleshooting
Green Card is in standby mode

None needed. The other SSC should be in Standby mode.

Amber Card is not backed up by the standby SSC. Check the status of the other SSC. If one it has failed or has been removed from the chassis, the system can continue to function but redundancy is compromised.
Refer to Monitoring the System for information on determining the status of the SSC and system software processes.
Blinking Amber Tasks or processes being migrated from the active SSC to the standby SSC. Refer to Monitoring the System for information on determining the status of the SSC and system software processes.
None

Card is not receiving power.

OR

Card has failed.

Verify that the Run/Fail LED is green. If so, the card is receiving power and POST results are positive. If it is off, refer to the SSC Run/Fail LED States section for troubleshooting information.

SSC System Status LED States

The System Status LED on the SSC indicates the that there is a loss of service somewhere in the system. If this LED is red, the system requires maintenance or service (for example, the system could not locate a a valid software image at boot-up, or a high temperature condition exists).

The possible states for this LED are described in the following table. If the LED is not green, use the troubleshooting information also provided to diagnose the problem.
Table 19. SSC System Status LED States 11
Color Description Troubleshooting
Green System is operating normally None required.
Red The system has experienced a loss of service. Refer to Monitoring the System for information on determining the status of system hardware and software processes.
None Card is not receiving power Verify that the Run/Fail LED is green. If so, the card is receiving power and POST results are positive. If it is off, refer to the SSC Run/Fail LED States section for troubleshooting information.

SSC System Service LED States

The System Service LED on the SSC illuminates amber to indicate that the system has experienced a hardware component failure.

This LED is off during normal operation.

The possible states for this LED are described in the following table. If the LED is not green, use the troubleshooting information in the table to diagnose the problem.
Table 20. SSC System Service LED States 12
Color Description Troubleshooting
Amber System requires maintenance (fan filter, temperature warning, PFU outage etc.). Monitoring the System for show commands, the outputs of which will assist in further determining the problem.
Refer to System Logs for information on how to view logs.
None

No component failures have been detected.

OR

Card is not receiving power.

No maintenance needed.

Testing System Alarm Outputs

The system provides the following two physical alarm mechanisms:
  • System Audible Alarm: Located on the SSC, the speaker is used to provide an audible indicator that a minor, major, or critical alarm has occurred.

  • CO Alarms Interface: Located on the SSC, this interface provides a DB-15 connector that enables three dry-contact relays (Form C) for the triggering of external audio and/or visual indicators. These indicators can be used to alert that either a minor, major, or critical alarm has occurred.

The operation of these alarms can be tested by issuing the following command:
[local]host_name# test alarm { audible | central-office [ critical | major | minor ] } 

When this command is executed, the specified alarm is activated for a period of 10 seconds. After this time, the alarm will return to its previous condition.

Taking Corrective Action

In the event that an issue was discovered with an installed application or line card, depending on the severity, it may be necessary to take corrective action.

The system provides several redundancy and fail-over mechanisms to address issues with application and line cards in order to minimize system downtime and data loss. These mechanisms are described in the sections that follow.

Switching MIOs

When the system boots up, the MIO/UMIO/MIO2 installed in chassis slot 5 will boot into the Active mode and begin booting other system components. The MIO/UMIO/MIO2 installed in chassis slot 6 will automatically be booted into Standby mode dictating that it will serve as a redundant component. The active MIO/UMIO/MIO2 automatically synchronizes currently running tasks or processes with the standby MIO/UMIO/MIO2.

In the event of a critical failure on the MIO/UMIO/MIO2 in slot 5, system control will be automatically switched to the standby MIO/UMIO/MIO2 in slot 6. This is a relatively seamless transition because the two are synchronized. The formerly active MIO will then enter the standby mode allowing it to be safely replaced or restored.

In the event that an issue arises that is not severe enough for the system to perform an automatic switchover, a manual switchover can be invoked by executing the following commands from the Exec mode prompt.

Procedure


Step 1

Initiate a manual MIO/UMIO/MIO2 switch over by entering the following command:

[local]host_name# card switch from <5 or 6> to <6 or 5>  

You will receive the following prompt:

Are You Sure? [Yes|No]: 

Step 2

Press Y to start the switchover.

Step 3

Verify that the switchover was successful by entering the show card table command at the Exec mode prompt:

Check the entry in the Oper State column next to the MIO/UMIO/MIO2 just switched. Its state should be Standby.


Busying Out a DPC

This busy-out command moves processes from the source DPC/UDPC or DPC2/UDPC2 to the destination DPC/UDPC or DPC2/UDPC2, or disables the DPC/UDPC or DPC2/UDPC2 from accepting any new calls. When busy-out is enabled, the DPC/UDPC or DPC2/UDPC2 stops receiving new calls but continues to process calls until they are completed. The command prompt is returned once the command is initiated. The busy-out procedure is completed in background.

Procedure


Step 1

Initiate a busy-out by entering the following command:

[local]host_name# card busy-out slot_number 

You will receive the following prompt:

Are You Sure? [Yes|No]: 

Step 2

Press Y to start the switchover.

Step 3

Verify that the busy-out was successful by entering the show card table command at the Exec mode prompt:

Check the entry in the Oper State column next to the DPC/UDPC or DPC2/UDPC2 just busied-out. Its state should be Standby.


Migrating a DPC

When the system boots up, all DPC/UDPCs or DPC2/UDPC2s enter the "standby" mode. The standby mode indicates that the card is available for use but is not configured for operation. Installed components can be made active through the software configuration process. Cards that are not configured to enter the "active" mode will remain in standby mode for use as redundant components.

In the event of the critical failure of a DPC/UDPC or DPC2/UDPC2, tasks will be automatically be migrated from the active card to a redundant card in standby mode.

In the event that an issue arises that is not severe enough for the system to perform an automatic migration, a manual migration can be initiated. Follow the instructions below to manually initiate a DPC/UDPC or DPC2/UDPC2 migration. These instructions assume you are at the root prompt for the Exec mode.

Procedure


Step 1

Initiate a DPC/UDPC or DPC2/UDPC2 migration by entering the following command:

[local]host_name# card migration from original_slot# to final_slot# 

You will receive the following prompt:

Are You Sure? [Yes|No]: 

Step 2

Press Y to start the migration.

Step 3

Verify that the migration was successful by entering the show card table command at the Exec mode prompt.

Check the entry in the Oper State column next to the packet processing card that was just migrated from. Its state should be Standby. The state of the packet processing card migrated to should be Active.

Use the show rct stats verbose command to review planned recovery (migration) statistics.


Halting Cards

Cards other than MIO/UMIOMIO2s that are in either the Active or Standby modes can be halted. Halting these cards places them into the "offline" mode. In this mode, the card is unusable for session processing as either an active or redundant component.

If a card in the active mode is halted, its tasks, processes, or network connections will be migrated or switched to a redundant component prior to entering the offline mode.

This section describes how to initiate a card halt and restore halted components.

Initiate a Card Halt


Important


Do not initiate a card halt for an active FSC if there are less than two active FSCs in the system. The system returns an error message if there are less than two active FSCs. There are similar restrictions when executing the card reboot or card upgrade commands on active FSCs. Refer to the Command Line Interface Reference for detailed information.


Follow the instructions below to manually initiate a card halt. These instructions assume you are at the root prompt for the Exec mode.

Procedure

Step 1

Initiate a manual card migration by entering the following command:

[local]host_name# card halt slot# 

slot# is the chassis slot number in which the card to be halted is installed. It can be any integer from 1 through 4, and 7 through 18. You will receive the following prompt:

Are You Sure? [Yes|No]: 

Step 2

Press Y to initiate the halt operation.

Step 3

Verify that the migration was successful by entering the show card table command at the Exec mode prompt.

Check the entry in the Oper State column next to the card that was just halted. Its state should be Offline. If the card was in active mode prior to the execution of this command, the state of the redundant component associated with it should now be Active.


Restore a Previously Halted Card

Follow the instructions below to restore a card that was previously halted. These instructions assume you are at the root prompt for the Exec mode.

Procedure

Step 1

Reboot the card to be restored by entering the following command.

[local]host_name# card reboot slot# -force 

You will receive the following prompt:

Are You Sure? [Yes|No]: 

Step 2

Press Y to start the reboot of the card.

Step 3

Verify that the migration was successful by entering the show card table command at the prompt.

Check the entry in the Oper State column next to the card that was just restored. Its state should be the state of that it was in before it was halted.


Verifying Network Connectivity

There are multiple commands supported by the system to verify and/or troubleshoot network connectivity. Note that network connectivity can only be tested once system interfaces and ports have been configured and bound.

The commands specified in this section should be issued on a context-by-context basis. Contexts act like virtual private networks (VPNs) that operate independently of other contexts. Ports, interfaces, and routes configured in one context cannot be tested from another context without additional configuration.

To switch between contexts enter the following command at the root prompt for the Exec mode:
[local]host_name# context context_name 
context_name is the name of the context to which you wish to switch. The following prompt appears:
[context_name]host_name# 

Using the ping or ping6 Command

The ping or ping6 command verifies the system's ability to communicate with a remote node in the network by passing data packets between and measuring the response. This command is useful in verifying network routing and if a remote node is able to respond at the IP layer.

Syntax

The ping command has the following syntax:

ping host_ipv4_address [ count num_packets ] [ flood ] [ pattern packet_pattern ] [ size octet_count ] [ src { src_host_name | src_host_ipv4_address } ] [ vrf vrf_nam ] 
ping6 host_ipv6_address [ count num_packets ] [ flood ][ pattern packet_pattern ] [ size octet_count ] [ src { src_host_name | src_host_ipv6_address } ] [ vrf vrf_nam ] 

For complete information on the above commands, see the Exec Mode Commands chapter of the Command Line Interface Reference.

The following displays a sample of a successful ping (IPV4) response.

PING 209.165.200.227 (209.165.200.227): 56 data bytes 
64 bytes from 209.165.200.227: icmp_seq=0 ttl=255 time=0.4 ms 
64 bytes from 209.165.200.227: icmp_seq=1 ttl=255 time=0.2 ms 
64 bytes from 209.165.200.227: icmp_seq=2 ttl=255 time=0.2 ms 
64 bytes from 209.165.200.227: icmp_seq=3 ttl=255 time=0.2 ms 
64 bytes from 209.165.200.227: icmp_seq=4 ttl=255 time=0.2 ms 
--- 209.165.200.227 ping statistics --- 
5 packets transmitted, 5 packets received, 0% packet loss 
round-trip min/avg/max = 0.2/0.2/0.4 ms 

Troubleshooting

If no response is received from the target follow these troubleshooting procedures:

  • Verify that the correct IP address was entered.

  • Attempt to ping a different device on the same network. If the ping was successful then it is likely that your system configuration is correct. Verify that the device you are attempting to ping is powered and functioning properly.

  • Verify the port is operational.

  • Verify that the configuration of the ports and interfaces within the context are correct.

  • If the configuration is correct and you have access to the device that you're attempting to ping, ping the system from that device.

  • If there is still no response, it is likely that the packets are getting discarded by a network device. Use the traceroute or traceroute6 and show ip static-route commands discussed in this chapter to further troubleshoot the issue.

Using the traceroute or traceroute6 Command

The traceroute or traceroute6 command collects information on the route data will take to a specified host. This is a useful troubleshooting command that can be used to identify the source of significant packet delays or packet loss on the network. This command can also be used to identify bottle necks in the routing of data over the network.

traceroute – IPv4

The traceroute command has the following syntax:

traceroute { host_name | host_ipv4_address } [ count packets ] [ df ]  [ maxttl max_ttl ] [ minttl min_ttl ] [ port port_number ] [ size octet_count ] [ src { src_host_name | src_host_ipv4_address }  ]  [ timeout seconds ] [ vrf vrf_nam ] 

For complete information on the above command, see the Exec Mode Commands chapter of the Command Line Interface Reference.

The following displays a sample output.

traceroute to 209.165.200.227 (209.165.200.227), 30 hops max, 40 byte packets 
 1  209.165.200.227 (209.165.200.227)  0.446 ms  0.235 ms  0.178 ms 

traceroute6 – IPv6

The traceroute6 command has the following syntax:

traceroute6 { host_name | host_ipv6_address } [ count packets ]  [ maxttl max_ttl ] [ port port_number ] [ size octet_count ] [ src { src_host_name | src_host_ipv6_address }  ]  [ timeout seconds ] [ vrf vrf_nam ] 

For complete information on the above commands, see the Exec Mode Commands chapter of the Command Line Interface Reference.

The following displays a sample output.

traceroute6 to 2001:4A2B::1f3F (2001:4A2B::1f3F), 30 hops max, 40 byte packets 
 1  2001:4A2B::1f3F (2001:4A2B::1f3F)  0.446 ms  0.235 ms 0.178 ms 

Viewing IP Routes

The system provides a mechanism for viewing route information to a specific node or for an entire context. This information can be used to verify network connectivity and to ensure the efficiency of the network connection. The command has the following syntax:

show ip route [ route_ip_address ] 
show ipv6 route [ route_ipv6_address ] ] 

For complete information on the above commands, see the Exec Mode show Commands chapter of the Command Line Interface Reference.

If no keywords are specified, all IP routes within the context's routing table are displayed.

The following displays a sample of this command's output showing a context IPv4 routing table.

"*" indicates the Best or Used route. 
  Destination     Nexthop     Protocol    Prec    Cost    Interface 
*0.0.0.0/0        10.0.4.1    static      0       0       SPIO1 
*10.0.4.0/24      0.0.0.0     kernel      0       0       SPIO1 
*10.0.4.0/32      0.0.0.0     kernel      0       0       SPIO1 
*10.0.4.3/32      0.0.0.0     kernel      0       0       SPIO1 
*10.0.4.255/32    0.0.0.0     kernel      0       0       SPIO1 

Viewing the Address Resolution Protocol Table

The system provides a mechanism for viewing Address Resolution Protocol (ARP) table information to a specific node or for an entire context. This information can be used to verify that when the system sends an ARP packet, it receives valid responses from other network nodes.

[local]host_name# show ip arp [ arp_ip_address ] 

arp_ip_address specifies a specific network node for which to display ARP information. The address can be entered in IPv4 dotted-decimal or IPv6 colon-separated-hexadecimal notation. If this keyword is not specified, all entries within the context's ARP table are displayed.


Important


Restarting the VPN Manager removes all interfaces from the kernel which in turn removes all ARP entries. However, the NPU still retains all of the ARP entries so that there is no traffic disruption. From a user point of view, show ip arp is broken since this command gathers information from the kernel and not the NPU.


The following displays a sample of this command's output showing a context's ARP table.

Flags codes: 
C - Completed, M - Permanent, P - Published, ! - Not answered 
T - has requested trailers 
Address         Link Type    Link Address          Flags    Mask Interface 
10.0.4.240      ether        00:05:47:02:20:20     C        MIO1 
10.0.4.7        ether        00:05:47:02:03:36     C        MIO1 
10.0.4.1        ether        00:01:30:F2:7F:00     C        MIO1 

Using the System Diagnostic Utilities

The system provides protocol monitor and test utilities that are useful when troubleshooting or verifying configurations. The information generated by these utilities can help identify the root cause of a software or network configuration issue.

This section describes how to use these utilities.


Important


Only an administrator with Operator or higher privilege can run the diagnostic utilities described in this section.


Using the Monitor Utility

For troubleshooting purposes, the system provides a protocol monitoring utility. This tool displays protocol information for a particular subscriber session or for every session being processed.


Caution


The monitor tool may cause session processing delays and/or data loss. Therefore, it should be used only when troubleshooting.


Using the Protocol Monitor

The protocol monitor displays information for every session that is currently being processed. Depending on the number of protocols monitored, and the number of sessions in progress, a significant amount of data is generated. It is highly recommended that logging be enabled on your terminal client in order to capture all of the information that is generated.

Refer also to Packet Capture (PCAP) Trace to enable PCAP functionality for the monitor protocol and monitor subscriber commands.

Follow the instructions below to invoke and configure the protocol monitoring tool.

Procedure


Step 1

Invoke the protocol monitor from the Exec mode by entering the monitor protocol command.

[local]host_name# monitor protocol 
An output listing all the currently available protocols, each with an assigned number, is displayed.

Step 2

Choose the protocol that you wish to monitor by entering the associated number at the Select: prompt. A right arrow ( > ) appears next to the protocol you selected.

Step 3

Repeat step 2 as needed to choose multiple protocols.

Step 4

Press B to begin the protocol monitor.

WARNING!!! You have selected options that can DISRUPT USER SERVICE 
Existing CALLS MAY BE DROPPED and/or new CALLS MAY FAIL!!! 
(Under heavy call load, some debugging output may not be displayed) 
Proceed? - Select (Y)es or (N)o 

Step 5

Enter Y to proceed with the monitor or N to go back to the previous menu.

C - Control Events    (ON ) 
D - Data Events               (ON ) 
E - EventID Info              (ON ) 
H - Display ethernet          (ON ) 
I - Inbound Events            (ON ) 
O - Outbound Events           (ON ) 
S - Sender Info               (OFF) 
T - Timestamps                (ON ) 
X - PDU Hexdump               (OFF) 
A - PDU Hex/Ascii             (OFF) 
+/- Verbosity Level           (    1) 
L - Limit Context             (OFF) 
M - Match Newcalls            (ON ) 
R - RADIUS Dict               (no-override) 
G - GTPP Dict                 (no-override) 
Y - Multi-Call Trace          ((OFF)) 
      (Q)uit,      <ESC> Prev Menu,      <SPACE> Pause,      <ENTER> Re-Display Options 

Step 6

Configure the amount of information that is displayed by the monitor. To enable or disable options, enter the letter associated with that option (C, D, E, etc.). To increase or decrease the verbosity, use the plus ( + ) or minus ( - ) keys.

The current state, ON (enabled) or OFF (disabled), is shown to the right of each option.

Step 7

Press the Enter key to refresh the screen and begin monitoring.


The monitor remains active until disabled. To quit the protocol monitor and return to the prompt, press q.

Using the Protocol Monitor for a Specific Subscriber

The protocol monitor can be used to display information for a specific subscriber session that is currently being processed. Depending on the number of protocols monitored, and the number of sessions in progress, a significant amount of data is generated. It is highly recommended that logging be enabled on your terminal client in order to capture all of the information that is generated.

Follow the instructions in this section to invoke and configure the protocol monitoring tool for a specific subscriber session.

Procedure

Step 1

To invoke the session-specific protocol monitor from the Exec mode enter the monitor subscriber command.

[local]host_name# monitor subscriber { callid | imei | imsi | ipaddr | ipv6addr | msid | msisdn | next-call | pcf | peer-fa | peer-lac | sgsn-address | type | username } 

Step 2

Specify the method the monitor should use by entering the appropriate keyword.

Step 3

Select other options and/or enter the appropriate information for the selected keyword.

If no session matching the specified criteria was being processed when the monitor was invoked, a screen of available monitoring options appears.

Step 4

Configure the amount of information that is displayed by the monitor. To enable or disable options, enter the letter or 2-digit number associated with that option (C, D, E, 11, 12, etc.). To increase or decrease the verbosity, use the plus ( + ) or minus ( - ) keys.

The current state, ON (enabled) or OFF (disabled), is shown to the right of each option.

Option Y for performing multi-call traces is only supported for use with the GGSN.

Step 5

Repeat step 6 as needed to enable or disable multiple protocols.

Step 6

Press Enter to refresh the screen and begin monitoring.

The following displays a portion of a sample of the monitor's output for a subscriber named user2@aaa. The default protocols were monitored.

--------------------------------------------------------------------------- 
Incoming Call: 
--------------------------------------------------------------------------- 
    MSID: 0000012345 Callid: 002dc6c2 
    Username: user2@aaa SessionType: unknown 
    Status: Active Service Name: xxx1 
    Src Context: source Dest Context: 
--------------------------------------------------------------------------- 
 
<<<<OUTBOUND 10:02:35:415 Eventid:25001(0) 
PPP Tx PDU (9) 
PAP 9: Auth-Ack(1), Msg= 
 
<<<<OUTBOUND 10:02:35:416 Eventid:25001(0) 
PPP Tx PDU (14) 
IPCP 14: Conf-Req(1), IP-Addr=192.168.250.70 
 
<<<<OUTBOUND 10:02:35:416 Eventid:25001(0) 
PPP Tx PDU (27) 
CCP 27: Conf-Req(1), MPPC, Stac-LZS, Deflate, MVRCA 
 
INBOUND>>>>> 10:02:35:517 Eventid:25000(0) 
PPP Rx PDU (30) 
IPCP 30: Conf-Req(1), IP-Comp VJ-Comp, IP-Addr=0.0.0.0, Pri-DNS=0.0.0.0, 
Sec-DNS=0.0.0.0 
 
<<<<OUTBOUND 10:02:35:517 Eventid:25001(0) 
PPP Tx PDU (26) 
IPCP 26: Conf-Rej(1), IP-Comp VJ-Comp, Pri-DNS=0.0.0.0, Sec-DNS=0.0.0.0 
 
INBOUND>>>>> 10:02:35:517 Eventid:25000(0) 
PPP Rx PDU (12) 
IPCP 12: Conf-Ack(1), IP-Addr=192.168.250.70 
 
INBOUND>>>>> 10:02:35:518 Eventid:25000(0) 
PPP Rx PDU (31) 
LCP 31: Prot-Rej(1), Rejected-Protocol=CCP (0x80fd) 
 
INBOUND>>>>> 10:02:35:518 Eventid:25000(0) 
PPP Rx PDU (12) 
IPCP 12: Conf-Req(2), IP-Addr=0.0.0.0 
 
<<<<OUTBOUND 10:02:35:518 Eventid:25001(0) 
PPP Tx PDU (14) 
IPCP 14: Conf-Nak(2), IP-Addr=192.168.250.87 
 
INBOUND>>>>> 10:02:35:519 Eventid:25000(0) 
PPP Rx PDU (12) 
IPCP 12: Conf-Req(3), IP-Addr=192.168.250.87 
 

The monitor remains active until disabled. To quit the protocol monitor and return to the prompt, press q.


Generating an SSD

An SSD is an instance of the output when the Exec mode show support details command is run. It displays a comprehensive list of system information that is useful for troubleshooting purposes. In most cases, the output of this command is requested by the Technical Assistance Center (TAC).

An SSD output .tar file can redirected to a local or remote location (URL).

The .tar file includes:
  • support_summary - An ASCII text file that contains the support detail information.

  • information.minicores.tar - A .tar file that contains any minicore files found on the system. Minicore files contain memory core dumps that are captured during some events. These core dumps provide specific memory locations and other information about the event. This information is useful to the technical support team in identifying where and when an event occurred along with its probably cause.

The show support details command includes information that is not otherwise accessible to users but that is helpful in the swift resolution of issues by TAC.


Important


Platforms with large configuration files can take up to 30 minutes to complete an SSD. Executing the show support details command consumes system resources and may reduce traffic throughput.


If an SSD is in progress when the operator enters the show support details command, StarOS responds with a warning message stating that an SSD is already in progress and the user should try again later. The operator is restricted to running only one SSD instance at a time.

There are optional keywords to the show support details command that can target the SSD to only report specific type of information. These keywords can reduce the amount of time required to generate the SSD/

For additional information about the show support details command, see the Exec Mode show Commands (Q-S) chapter in the Command Line Interface Reference.

Configuring and Using the Support Data Collector

The task of collecting the support data is performed by a background CLI task called the record collector. The administrator configures the Support Data Collector (SDC) via the CLI with the commands to be executed on a periodic basis. The record collector always runs in the background and checks if there are records to be collected.

When it is time to collect support data, the scheduler executes the configured sequence of CLI commands and stores the results in a gunzipped (.gz) file on the hard-disk. This file is called an SDR (Support Data Record), and represents a snapshot of the overall state of the system at that time.

Technical Assistance Center (TAC) personnel and local administrators can review the SDRs on-line or by transferring them off the system. They may also wish to investigate the collector state information.

Refer to the Support Data Collector chapter for a complete description of SDC functionality.

Hypervisor Initiated Forced Reboot

The hypervisor supports a virtual watchdog device. If VPC stops servicing this watchdog, the hypervisor forces a reboot of the VM. See the table below.

Table 21. Hypervisor Forced Reboot Conditions
Condition Reboot Method Recovery Notes
Critical task failure Hypervisor watchdog Hypervisor reboots VM StarOS stops servicing the watchdog.
Kernel hang/crash Kernel or hypervisor watchdog Hypervisor reboots VM
Host failure Hypervisor HA (High Availability) Hypervisor management system invokes HA, assigns VM to another host and restarts it Example: VMware HA cluster

Under KVM, a virtual watchdog device can be provided using the --watchdog i6300esb command line arguments. VMware provides a proprietary watchdog mechanism.