General Troubleshooting

This chapter provides procedures for troubleshooting the most common problems encountered when operating the NCS 1010 chassis.

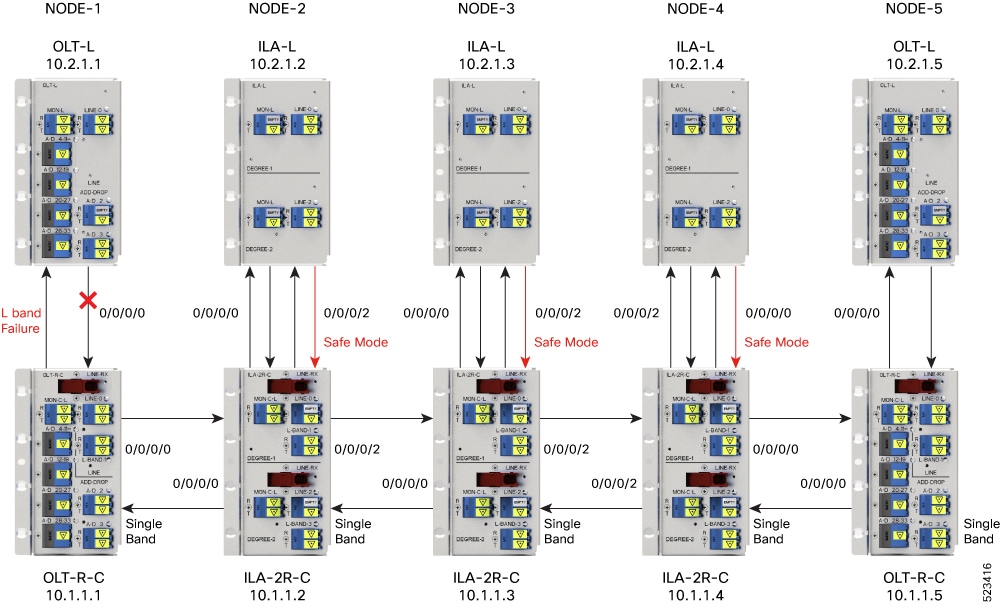
Troubleshooting L Band Failure on a C+L Band Network

In this section, we will troubleshoot L band failure due to connectivity failure between OLT-C and OLT-L nodes. To troubleshoot L-band failure on a C+L band network, start by running the following commands on the manager nodes:

Figure 1. Example of L-band Failure

Procedure


Step 1

Run the show olc band-status command on node 10.2.1.1.

Example:

The following command example shows the status of all the L-band nodes as FAILED which indicates that the issue is between the L-band devices of nodes 10.2.1.1 and 10.2.1.2.

RP/0/RP0/CPU0#show olc band-status 
Fri Dec 16 03:02:07.304 UTC
 
Controller              : Ots0/0/0/0
Self-Band               : C-Band
BFR status              : Running
 
Node RID                : 10.2.1.1
Partner IP address      : 192.0.2.2
Partner Controller      : Ots0/0/0/0
Partner link status     : UP
C-Band status           : ACTIVE
C-Band PSD              : Single Band        
L-Band status        : FAILED
L-Band PSD              : NA
 
Node RID                : 10.2.1.2

Partner IP address      : 198.51.100.2
Partner Controller      : Ots0/0/0/2
Partner link status     : UP
C-Band status           : ACTIVE
C-Band PSD              : Single Band
L-Band status        : FAILED
L-Band PSD              : NA
 
Node RID                : 10.2.1.3

Partner IP address      : 203.0.113.2
Partner Controller      : Ots0/0/0/2
Partner link status     : UP
C-Band status           : ACTIVE
C-Band PSD              : Single Band
L-Band status           : FAILED
L-Band PSD              : NA
 
Node RID                : 10.2.1.4

Partner IP address      : 209.165.200.226
Partner Controller      : Ots0/0/0/0
Partner link status     : UP
C-Band status           : ACTIVE
C-Band PSD              : Single Band
L-Band status        : FAILED
L-Band PSD           : NA


Node RID                : 10.2.1.5

Partner IP address      : 209.165.201.2
Partner Controller      : Ots0/0/0/0
Partner link status     : UP
C-Band status           : ACTIVE
C-Band PSD              : Single Band
L-Band status           : FAILED
L-Band PSD              : NA

All the network failure conditions might not reflect in the show olc band-status command output. Proceed to the next step to troubleshoot further.

Based on the above output, it appears that all of the C band nodes are currently active, indicating that the span has not been impacted.

Step 2

Run the show olc apc command on node 10.2.1.1.

Example:

The following example shows the APC status as BLOCKED with the Blocked Reason as PARTIAL-TOPOLOGY. As the APC manager discovers only node 10.2.1.1 and the rest nodes are not discovered. This clearly indicates that the neighbour node of 10.2.1.1 is not reachable. This indicates hence connectivity failure is between the OLT-C node 10.1.1.1 and OLT-L node 10.1.1.2.

RP/0/RP0/CPU0:P1BL_DT_07#show olc apc
Mon Dec 26 09:32:23.624 UTC

Controller      : Ots0/0/0/0
APC Status      : BLOCKED
Blocked Reason  : [ PARTIAL-TOPOLOGY  NODE-BLOCKED ]

Node RID        : 10.2.1.1
Internal State  : BLOCKED
Blocked Reason  : [ AMPLI-SHUT ]

Step 3

Run the show alarms brief system active command.

Example:

The following example shows the Loss Of Continuity alarm which confirms the fiber failure between the the OLT-L node 10.2.1.1 and ILA-L node 10.2.1.2.

RP/0/RP0/CPU0:P1BL_DT_07#show alarms brief system active
                                                                                                                                                                                                             
0/0/NXR0        Minor        Software         12/26/2022 09:27:47 UTC    Ots0/0/0/0 - APC Partial topology                                                                                                                                                                                                                         
0/0             Major        Ethernet         12/26/2022 09:27:47 UTC    GigabitEthernet0/0/0/0 - Loss of Synchronization The Data Interface                                                                                                                                                                                               
0/0/NXR0        Minor        Software         12/26/2022 09:32:15 UTC    Ots0/0/0/0 - APC blocked                                                                                                                                                                                                                                    
0/0             Critical     Controller       12/26/2022 09:32:16 UTC    Ots0/0/0/0 - Loss Of Continuity                                                                                                                                                                                                                           
0/0             Not Alarmed  Controller       12/26/2022 09:32:16 UTC    Ots0/0/0/0 - Egress Amplifier OFF for Safety Reasons    

Hence, from steps 2 and 3 outputs, we can conclude that the connectivity failure is between the OLT-L node10.2.1.1 and ILA-L node 10.2.1.2, and the Loss Of Continuity alarm confirms the fiber failure between the nodes 10.2.1.1 and 10.2.1.2.

Troubleshooting C Band Failure on a C+L Band Network

In this section, we will troubleshoot C band failure due to amplifier shutdown or failure. To troubleshoot C-band failure on a C+L band network, start by running the following commands on the manager nodes in the same order:

Figure 2. Example of C-band Failure on a C+L Band Network

Procedure


Step 1

Run the show olc band-status command on node 10.1.1.1.

Example:

The following command example shows the status of all the C-band nodes as FAILED which indicates that the issue is between the C-band devices of nodes 10.1.1.1 and 10.1.1.2.

RP/0/RP0/CPU0:#sh olc band-status 
Tue Feb  7 13:37:38.618 UTC
 
Controller              : Ots0/0/0/0
Self-Band               : C-Band
BFR status              : Running
 
Node RID                : 10.1.1.1
Partner IP address      : 192.0.2.1
Partner Controller      : Ots0/0/0/0
Partner link status     : UP
C-Band status           : FAILED
C-Band PSD              : NA
L-Band status           : ACTIVE
L-Band PSD              : Single Band
 
Node RID                : 10.1.1.2

Partner IP address      : 192.0.2.2
Partner Controller      : Ots0/0/0/2
Partner link status     : UP
C-Band status           : FAILED
C-Band PSD              : NA
L-Band status           : ACTIVE
L-Band PSD              : Single Band
 
Node RID                : 10.1.1.3

Partner IP address      : 192.0.2.3
Partner Controller      : Ots0/0/0/2
Partner link status     : UP
C-Band status           : FAILED
C-Band PSD              : NA
L-Band status           : ACTIVE
L-Band PSD              : Single Band
 
Node RID                : 10.1.1.4
Partner IP address      : 192.0.2.4
Partner Controller      : Ots0/0/0/0
Partner link status     : UP
C-Band status           : FAILED
C-Band PSD              : NA
L-Band status           : ACTIVE
L-Band PSD              : Single Band
 
Node RID                : 10.1.1.5

Partner IP address      : 192.0.2.5
Partner Controller      : Ots0/0/0/0
Partner link status     : UP
C-Band status           : FAILED
C-Band PSD              : NA
L-Band status           : ACTIVE
L-Band PSD              : Single Band

All the network failure conditions might not reflect in the show olc band-status command output. Proceed to the next step to troubleshoot further.

Step 2

Run the show olc apc command on node 10.1.1.1.

Example:

The following command output shows APC status of Manager node as NODE-BLOCKED. As the APC manager shows the Blocked Reason of the agent node 10.1.1.1 as AMPLI-SHUT, it clearly indicates that amplifier is set to OFF state between the manager node 10.1.1.1 and the agent node 10.1.1.2.

RP/0/RP0/CPU0:# show olc apc      
Tue Feb  7 13:37:40.146 UTC
 
Controller      : Ots0/0/0/0
APC Status      : BLOCKED
Blocked Reason  : [ NODE-BLOCKED ]
 
Node RID        : 10.1.1.1
Internal State  : BLOCKED
Blocked Reason  : [ AMPLI-SHUT ]
 
Node RID        : 10.1.1.2
Internal State  : BLOCKED
Blocked Reason  : [ BAND-FAILURE ]
 
Node RID        : 10.1.1.3
Internal State  : BLOCKED
Blocked Reason  : [ BAND-FAILURE ]
 
Node RID        : 10.1.1.4
Internal State  : BLOCKED
Blocked Reason  : [ BAND-FAILURE ]
 
Node RID        : 10.1.1.5
Internal State  : BLOCKED
Blocked Reason  : [ AMPLI-SHUT ]

Step 3

Run the show alarms brief system active command.

Example:

The following example shows APC output as BLOCKED but without any partial topology alarm which indicates that the span is intact.

RP/0/RP0/CPU0:#show alarms b s a
                                                                                                                                                                                         
0/0/NXR0        Minor        Software         02/07/2023 13:37:16 UTC    Ots0/0/0/0 - APC blocked     

Based on the analysis of steps 2 and 3 we can conclude that the amplifier between the manager node 10.1.1.1 and the agent node 10.1.1.2 is shut down which has caused the C-band 10.1.1.1 to fail.

Troubleshooting Span Failure on a C+L Band Network

To troubleshoot span failure on a C+L band network, start by running the following commands on the manager nodes in the same order:

Figure 3. Example of Span Failure

Procedure


Step 1

Run the show olc band-status command on node 10.1.1.1.

Example:

The following command output shows that the C and L-band devices from the nodes 10.1.1.2 to 10.1.1.5 are FAILED, there is a possibility of span failure.

RP/0/RP0/CPU0:#sh olc band-status 
Tue Feb  7 13:55:21.265 UTC
 
Controller              : Ots0/0/0/0
Self-Band               : C-Band
BFR status              : Running
 
Node RID                : 10.1.1.1
Partner IP address      : 192.0.2.2
Partner Controller      : Ots0/0/0/0
Partner link status     : UP
C-Band status           : ACTIVE
C-Band PSD              : Dual Band
L-Band status           : ACTIVE
L-Band PSD              : Dual Band
 
Node RID                : 10.1.1.2
Partner IP address      : 198.51.100.2
Partner Controller      : Ots0/0/0/2
Partner link status     : UP
C-Band status           : FAILED
C-Band PSD              : NA
L-Band status           : FAILED
L-Band PSD              : NA
 
Node RID                : 10.1.1.3

Partner IP address      : 203.0.113.2
Partner Controller      : Ots0/0/0/2
Partner link status     : NA
C-Band status           : FAILED
C-Band PSD              : NA
L-Band status           : FAILED
L-Band PSD              : NA
 
Node RID                : 10.1.1.4

Partner IP address      : 209.165.200.226
Partner Controller      : Ots0/0/0/0
Partner link status     : NA
C-Band status           : FAILED
C-Band PSD              : NA
L-Band status           : FAILED
L-Band PSD              : NA
 
Node RID                : 10.1.1.5
Partner IP address      : 209.165.201.2
Partner Controller      : Ots0/0/0/0
Partner link status     : NA
C-Band status           : FAILED
L-Band status           : FAILED

All the network failure conditions might not reflect in the show olc band-status command output. Proceed to the next step to troubleshoot further.

Step 2

Run the show olc apc command on node 10.1.1.1.

Example:

The following command output shows the APC status as BLOCKED with the reason as PARTIAL-TOPOLOGY on both C and L-band OLT devices. This indicates that there is a span failure.

RP/0/RP0/CPU0:# show olc apc
 
Controller      : Ots0/0/0/0
APC Status      : BLOCKED
Blocked Reason  : [ PARTIAL-TOPOLOGY  NODE-BLOCKED ]
 
Node RID        : 10.1.1.1
Internal State  : IDLE
 
Node RID        : 10.1.1.2
Internal State  : BLOCKED
Blocked Reason  : [ AMPLI-SHUT ]

Step 3

Run the show alarms brief system active command.

Example:

The following example shows the Loss Of Signal alarm which confirms the span failure.

RRP/0/RP0/CPU0:3#sh alarms breif system active
                
0/0/NXR0        Minor        Software         02/07/2023 13:52:44 UTC    Ots0/0/0/0 - APC Partial topology

0/0/NXR0        Minor        Software         02/07/2023 14:01:39 UTC    Ots0/0/0/0 - APC blocked                                                                                                                                                                                                                       
0/0             Critical     Controller       02/07/2023 13:55:00 UTC    Ots0/0/0/0 - Loss of Signal - Payload   

Hence, from steps 2 and 3 outputs, we can conclude that the PARTIAL-TOPOLOGY status on the OLT devices and the Loss Of Signal alarm confirmed the span failure.

Troubleshooting RP or LC Warm Reload on a C+L Band Network

On a C+L band network, RP or LC warm reload on a C or L band device might affect the partner band connectivity. In this case, traffic is not impacted. To troubleshoot a RP or LC warm reload on a C+L band network, following these steps:

Figure 4. Example RP or LC Warm Reload Troubleshooting on C+L Band Network

Procedure


Step 1

Run the show olc band-status command on node 10.1.1.1.

Example:

The following example shows the Partner link status at node 10.1.1.3 is DOWN. Partner link status can be down due to communication failure between C and L-band devices at the node which can be due to RP reload, power cycle event or LC cold reload.

RP/0/RP0/CPU0:#sh olc band-status 
Tue Feb  7 14:14:40.933 UTC
 
Controller              : Ots0/0/0/0
Self-Band               : C-Band
BFR status              : Running
 
Node RID                : 10.1.1.1

Partner IP address      : 198.51.100.2
Partner Controller      : Ots0/0/0/0
Partner link status     : UP
C-Band status           : ACTIVE
C-Band PSD              : Dual Band
L-Band status           : ACTIVE
L-Band PSD              : Dual Band
 
Node RID                : 10.1.1.2
Partner IP address      : 198.51.100.1
Partner Controller      : Ots0/0/0/2
Partner link status     : UP
C-Band status           : ACTIVE
C-Band PSD              : Dual Band
L-Band status           : ACTIVE
L-Band PSD              : Dual Band
 
Node RID                : 10.1.1.3
Partner IP address      : 203.0.113.1
Partner Controller      : Ots0/0/0/2
Partner link status     : DOWN
C-Band status           : ACTIVE
C-Band PSD              : Dual Band
L-Band status           : ACTIVE
L-Band PSD              : Dual Band
 
Node RID                : 10.1.1.4

Partner IP address      : 209.165.200.225
Partner Controller      : Ots0/0/0/0
Partner link status     : UP
C-Band status           : ACTIVE
C-Band PSD              : Dual Band
L-Band status           : ACTIVE
L-Band PSD              : Dual Band
 
Node RID                : 10.1.1.5

Partner IP address      : 209.165.201.1
Partner Controller      : Ots0/0/0/0
Partner link status     : UP
C-Band status           : ACTIVE
L-Band status           : ACTIVE

All the network failure conditions might not reflect in the show olc band-status command output. Proceed to the next step to troubleshoot further.

To investigate further, run the command in step 2.

Step 2

Run the show olc apc command on node 10.1.1.1 and 10.2.1.1.

Example:

The following command example on node 10.1.1.1 shows APC status on OLT-C device as IDLE as the APC manager discovers all the C-band nodes. This clearly indicates all the C-Band nodes are active.

RP/0/RP0/CPU0:#show olc apc
 
Controller      : Ots0/0/0/0
APC Status      : IDLE
 
Node RID        : 10.1.1.1
Internal State  : IDLE
 
Node RID        : 10.1.1.2
Internal State  : IDLE
 
Node RID        : 10.1.1.3
Internal State  : IDLE
 
Node RID        : 10.1.1.4
Internal State  : IDLE
 
Node RID        : 10.1.1.5
Internal State  : IDLE

Example:

The following command example on 10.2.1.1 shows APC manager discovers only nodes 10.2.1.1 and 10.2.1.2. This indicates that the L-Band device 10.2.1.3 is not reachable to the manager node 10.2.1.1.

RP/0/RP0/CPU0:#show olc apc
Tue Feb  7 14:16:46.264 UTC
 
Controller      : Ots0/0/0/0
APC Status      : BLOCKED
Blocked Reason  : [ PARTIAL-TOPOLOGY ]
 
Node RID        : 10.2.1.1
Internal State  : IDLE
 
Node RID        : 10.2.1.2
Internal State  : IDLE

Step 3

Run the show alarms brief system active command on 10.2.1.1.

Example:

The following command example shows the Node is unpaired from band partner node alarm which confirms connection between node 10.2.1.3 is not paired with 10.1.1.3.

RP/0/RP0/CPU0:P1BL_DT_07#show alarms brief system active
                                                                                                                                                                                                             
RP/0/RP0/CPU0:P1BL_DT_07#show alarms brief system active     0/0/NXR0        NotAlarmed   Software         02/07/2023 14:13:01 UTC    Node is unpaired from band partner node

The analysis of steps 2 and 3 confirm that node 10.2.1.3 is not available due to RP or LC warm reload.

Troubleshooting Client-Side Failure

Problem

This problem occurs when there is a signal payload loss in the following conditions:

  • If the fiber cut occurs at the client-side in the direction from the client to the NCS1010, the LOS-P alarm is raised at the AD port controller OTS.

  • If the fiber cut occurs at the client-side in the direction from the NCS1010 to the client, the LOS-P alarm is raised at the Passive device controller OMS.

Topology and Components

To build this topology, you need the following hardware:

  • Cisco NCS 1010 devices

  • NCS1K-MD32E-C modules

  • NCS1K-MD32O-C modules

  • NCS1K-BRK-24 modules

  • QDD-400G-ZR-S transceiver

The following figure displays client-side failure due to fiber cut:

Figure 5. Fiber Cut at the AD Port OTS Controller and OMS Controller

Example 1

The following example shows how to determine LOS-P failure at the AD port controller OTS:

RP/0/RP0/CPU0:ios#show controllers ots0/0/0/3
Tue Mar 28 15:58:12.210 UTC

Controller State: Down 

Transport Admin State: Automatic In Service 

LED State: Red 

         Alarm Status:
         -------------
         Detected Alarms: 
                 RX-LOS-P    

         Alarm Statistics:
         -----------------
         RX-LOS-P = 2          
         RX-LOC = 0          
         TX-POWER-FAIL-LOW = 0          
         INGRESS-AUTO-LASER-SHUT = 0          
         INGRESS-AUTO-POW-RED = 0          
         INGRESS-AMPLI-GAIN-LOW = 0          
         INGRESS-AMPLI-GAIN-HIGH = 0          
         EGRESS-AUTO-LASER-SHUT = 0          
         EGRESS-AUTO-POW-RED = 0          
         EGRESS-AMPLI-GAIN-LOW = 0          
         EGRESS-AMPLI-GAIN-HIGH = 0          
         HIGH-TX-BR-PWR = 0          
         HIGH-RX-BR-PWR = 0          
         SPAN-TOO-SHORT-TX = 0          
         SPAN-TOO-SHORT-RX = 0          

         Parameter Statistics:
         ---------------------
         Total Rx Power = -50.00 dBm 
         Total Tx Power = -50.00 dBm 
         Ingress Ampli Mode = Gain
         Ingress Ampli Gain = 0.0 dB
         Ingress Ampli Tilt = 0.0 dB


         Configured Parameters:
         -------------
         Ingress Ampli Mode = Gain
         Ingress Ampli Gain = 16.0 dB 
         Ingress Ampli Power = -3.0 dBm
         Ingress Ampli Tilt = 0.0 dB
         Rx Low Threshold = -3276.8 dBm 
         Tx Low Threshold = -3276.8 dBm

Example 2

The following example shows how to determine LOS-P failure at the passive device controller OMS:

RP/0/RP0/CPU0:P2A_DT_07#sh controllers oms 0/1/0/8
Tue Mar 28 16:00:33.685 UTC

Controller State: Down 

Transport Admin State: Automatic In Service 

LED State: Red 

         Alarm Status:
         -------------
         Detected Alarms: 
                 RX-LOS-P    

         Alarm Statistics:
         -----------------
         RX-LOS-P = 1          
         TX-POWER-FAIL-LOW = 0          

         Parameter Statistics:
         ---------------------
         Tx Power = -50.00 dBm 
         Rx Power = -50.00 dBm

Solution

See RX-LOS-P to resolve this alarm.

Troubleshooting Line Port SPAN Failure

Problem

This problem occurs when there is a loss of fiber connection at the Line port due to fiber cut. As a result, the LOC alarm is raised at the Line OTS controller.

Topology and Components

To build this point-to-point topology, you need the following hardware:

  • Cisco NCS1010 devices

  • NCS1K-MD32E-C modules

  • NCS1K-MD32O-C modules

  • QDD-400G-ZR-S transceiver

The following figure shows loss of fiber connection continuity at the Line port:

Figure 6. Fiber Cut at the Line OTS Controller

Example 1

The following example shows how to determine a span failure.

RP/0/RP0/CPU0:ios#show controllers ots0/0/0/0
Tue Mar 28 15:48:31.486 UTC

Controller State: Down 

Transport Admin State: In Service 

LED State: Red 

         Alarm Status:
         -------------
         Detected Alarms: 
                 RX-LOS-P    
                 RX-LOC    
                 EGRESS-AUTO-LASER-SHUT    

         Alarm Statistics:
         -----------------
         RX-LOS-P = 2          
         RX-LOC = 2          
         TX-POWER-FAIL-LOW = 3          
         INGRESS-AUTO-LASER-SHUT = 0          
         INGRESS-AUTO-POW-RED = 0          
         INGRESS-AMPLI-GAIN-LOW = 0          
         INGRESS-AMPLI-GAIN-HIGH = 0          
         EGRESS-AUTO-LASER-SHUT = 2          
         EGRESS-AUTO-POW-RED = 0          
         EGRESS-AMPLI-GAIN-LOW = 0          
         EGRESS-AMPLI-GAIN-HIGH = 0          
         HIGH-TX-BR-PWR = 0          
         HIGH-RX-BR-PWR = 0          
         SPAN-TOO-SHORT-TX = 0          
         SPAN-TOO-SHORT-RX = 0          

         Parameter Statistics:
         ---------------------
         Total Rx Power(C+L) = 10.69 dBm
         Total Tx Power(C+L) = 19.50 dBm
         Total Rx Power = -50.00 dBm 
         Total Tx Power = -50.00 dBm 
         Rx Signal Power = -50.00 dBm 
         Tx Signal Power = -50.00 dBm 
         BR Power = -90.00 dBm 
         Tx Voa Attenuation = 15.0 dB 
         Ingress Ampli Mode = Gain
         Ingress Ampli Gain = 0.0 dB
         Ingress Ampli Tilt = 0.0 dB
         Ingress Ampli Gain Range = Normal 
         Ingress Ampli Safety Control mode = auto 
         Ingress Ampli OSRI = OFF 
         Ingress Ampli Force Apr = OFF 
         Egress Ampli Mode = Gain
         Egress Ampli Gain = 0.0 dB
         Egress Ampli Tilt = 0.0 dB
         Egress Ampli Safety Control mode = auto 
         Egress Ampli OSRI = OFF 
         Egress Ampli Force APR = OFF 
         Egress Ampli BR = ENABLE 

         Configured Parameters:
         -------------
         Tx Voa Attenuation = 15.0 dB 
         Ingress Ampli Mode = Gain
         Ingress Ampli Gain = 12.0 dB 
         Ingress Ampli Power = -1.0 dBm
         Ingress Ampli Tilt = 0.0 dB
         Ingress Ampli Gain Range = Normal 
         Ingress Ampli Safety Control mode = auto 
         Ingress Ampli OSRI = OFF 
         Ingress Ampli Force Apr = OFF 
         Egress Ampli Mode = Gain
         Egress Ampli Gain = 16.0 dB 
         Egress Ampli Power = 5.0 dBm
         Egress Ampli Tilt = 0.0 dB
         Egress Ampli Safety Control mode = auto 
         Egress Ampli OSRI = OFF 
         Egress Ampli Force APR = OFF 
         Egress Ampli BR = ENABLE 
         BR High Threshold = -17.0 dBm 
         Rx Low Threshold = -3276.8 dBm 
         Tx Low Threshold = -3276.8 dBm

Solution

See RX-LOC Alarm to resolve this problem.

Troubleshooting Express Connection Failure Between Two Passive Devices

Problem

This problem occurs when there is a signal payload loss in the express connections between two passive devices due to a fiber cut. As a result, the LOS-P alarm is raised at the passive device controller OCH.

Topology and Component

To build this topology, you need the following hardware.

  • Cisco NCS 1010 devices

  • NCS1K-MD32E-C modules

  • NCS1K-MD32O-C modules

  • NCS1K-BRK-8 modules

  • NCS1K-BRK-24 modules

  • Cisco 8201 routers

  • QDD-400G-ZR-S transceivers

  • CFP2-400G-DCO transceivers

  • Cisco NCS 1004 devices

  • NCS1K4-2-QDD-C-K9 line card

  • LC/LC cables

  • MPO cables

The following figure displays the fiber cut between two passive devices:

Figure 7. Fiber Cut Between Two Passive Devices

Example 1

The following example shows how to determine the fiber cut between two passive devices:

RP/0/RP0/CPU0:OLT-C-SITE-2#sh controllers och 0/3/0/0 
Wed Apr 12 10:25:27.139 IST

 Controller State: Down 

 Transport Admin State: In Service 

 LED State: Red 

         Alarm Status:
         -------------
         Detected Alarms: 
                 RX-LOS-P    

         Alarm Statistics:
         -----------------
         RX-LOS-P = 1          
         TX-POWER-FAIL-LOW = 0          

         Parameter Statistics:
         ---------------------
         Tx Power = 13.09 dBm 
         Rx Power = -50.00 dBm  

Note


The slot number 3 in the preceding show controller command is the USB cable port number to which BRK8 is connected (This USB number is derived from the show platform output).


Solution

See RX-LOS-P to resolve this alarm.

Troubleshooting Power Oscillation in the Network

Problem

This problem occurs when there is a power oscillation in the network.

Example 1

The following example shows the power fluctuation in the network:

RP/0/RP0/CPU0:ios#show controllers ots0/0/0/0 pm current 30-sec optics 1 
Tue Mar 28 16:02:22.332 UTC

Optics in the current interval [16:02:00 - 16:02:22 Tue Mar 28 2023]

Optics current bucket type : Valid
              MIN        AVG      MAX      Operational    Configured      TCA   Operational     Configured     TCA
                                          Threshold(min)  Threshold(min) (min) Threshold(max)   Threshold(max) (max)
OPT[dBm]      : -50.00   -7.32    6.10     -20.00            NA              NO   40.00            NA              NO   
OPR[dBm]      : -50.00   -50.00   -50.00   -30.00            NA              NO   18.00            NA              NO   
OPT(C+L)[dBm] : 19.50    19.51    19.70    -20.00            NA              NO   60.85            NA              NO   
OPR(C+L)[dBm] : 10.60    10.64    10.70    -30.00            NA              NO   36.00            NA              NO   
OPT(S)[dBm]   : -50.00   -50.00   -50.00   -5.00             NA              NO   28.00            NA              NO   
OPR(S)[dBm]   : -50.00   -50.00   -50.00   -30.00            NA              NO   18.00            NA              NO  
 OPBR[dBm]    : -50.00   -50.00   -50.00   -30.00            NA              NO   -14.09           NA              NO   
EAGN[dB]      : 0.00     0.00     0.00     16.00             NA              NO   31.00            NA              NO   
EATL[dB]      : 0.00     0.00     0.00     -5.00             NA              NO   5.00             NA              NO   
IAGN[dB]      : 0.00     0.00     0.00     12.00             NA              NO   25.00            NA              NO   
IATL[dB]      : 0.00     0.00     0.00     -5.00             NA              NO   5.00             NA              NO   

Last clearing of "show controllers OPTICS" counters never

Solution

You need to monitor the performance monitor statistics of the corresponding OTS and OTS-OCH controllers to determine where the power oscillation occurs in the network. Check for the transient alarms on the node, such as RX-LOC and RX-LOS-P. See RX-LOS-P and RX-LOC Alarm to resolve this problem.