Topology
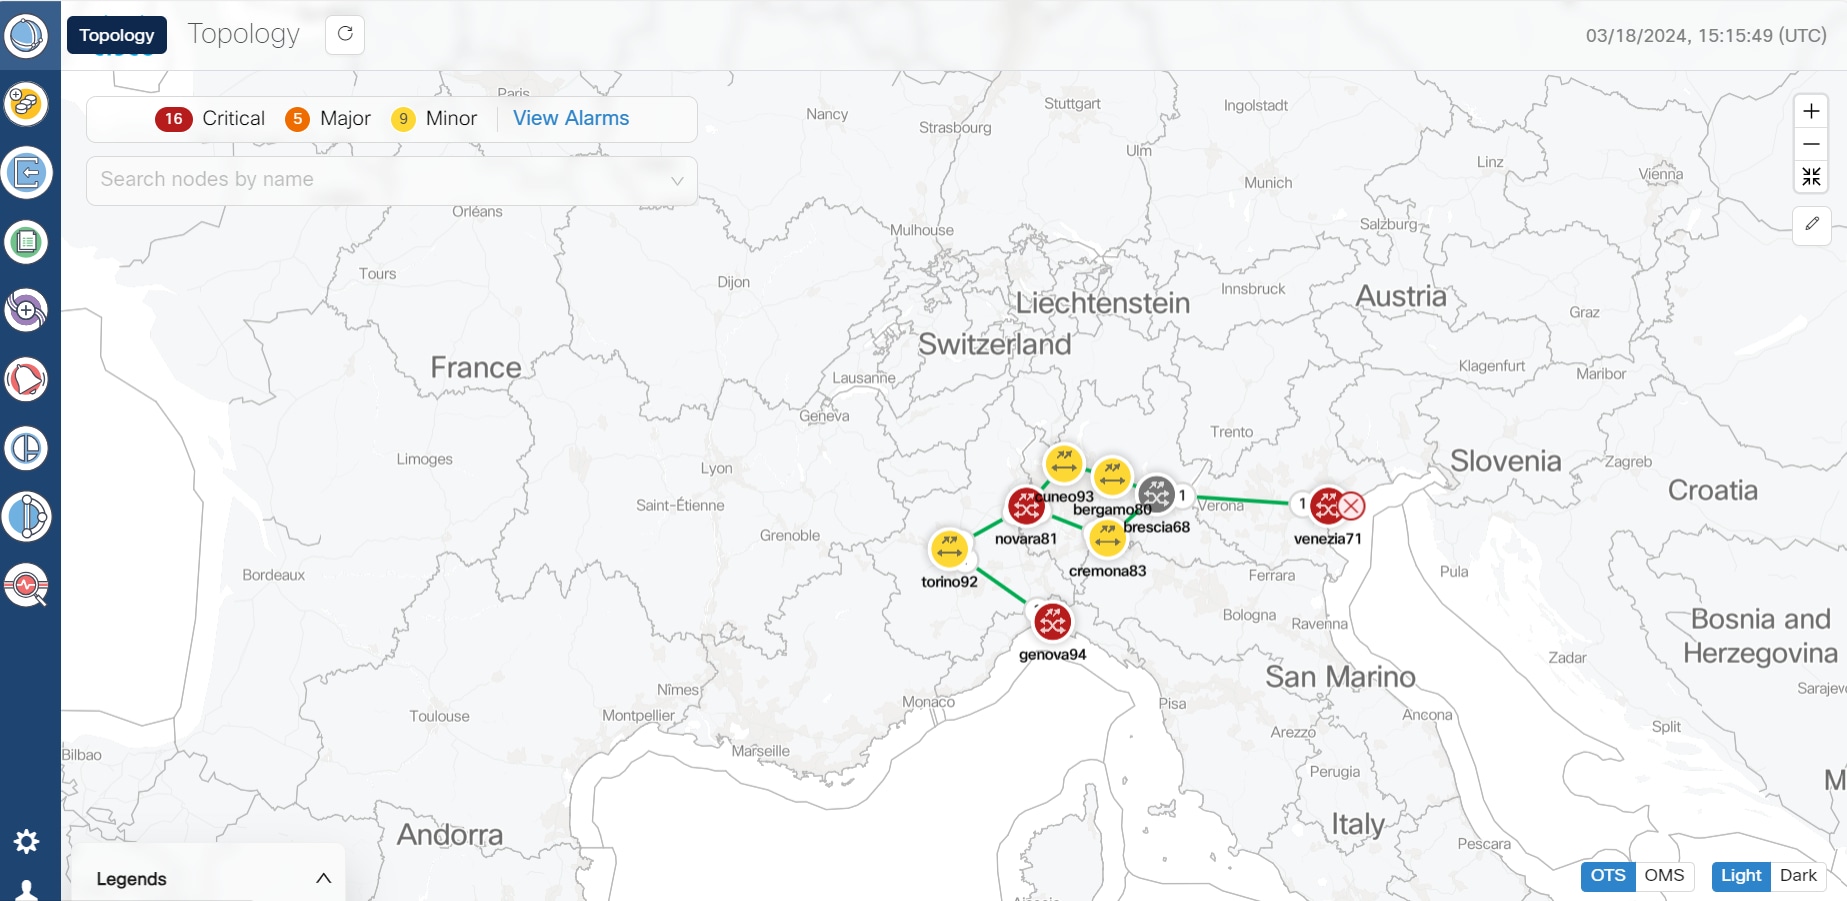
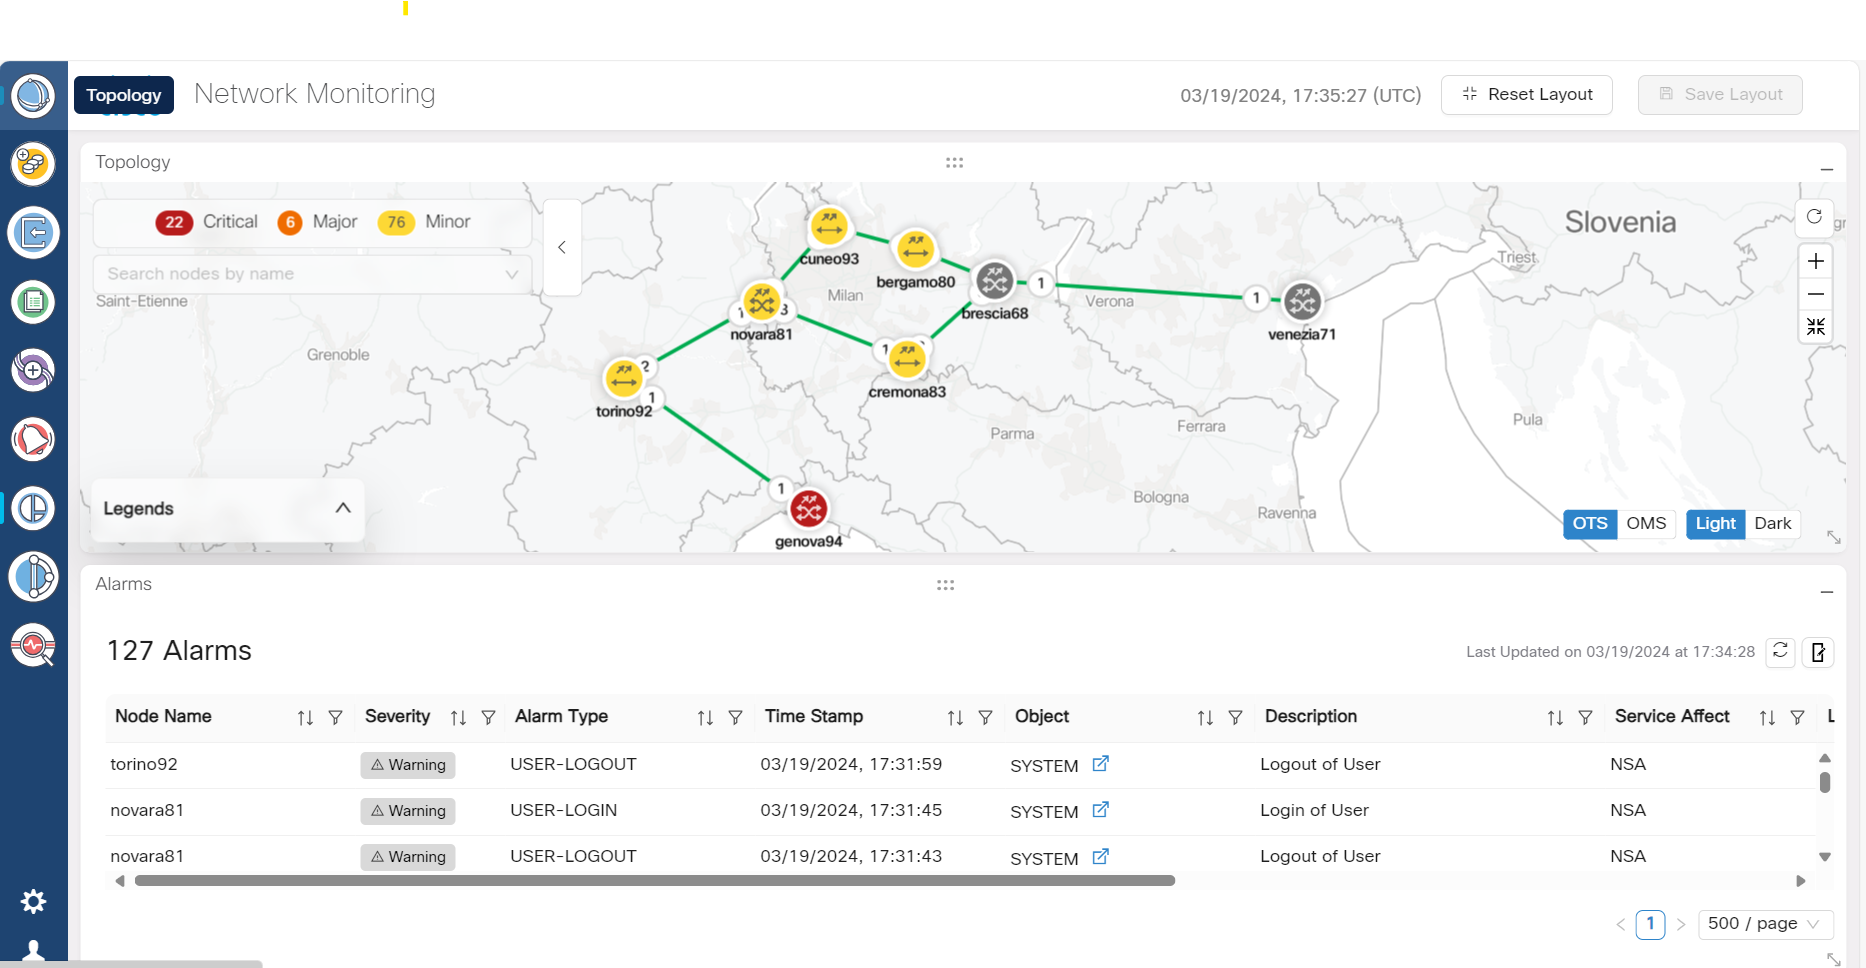
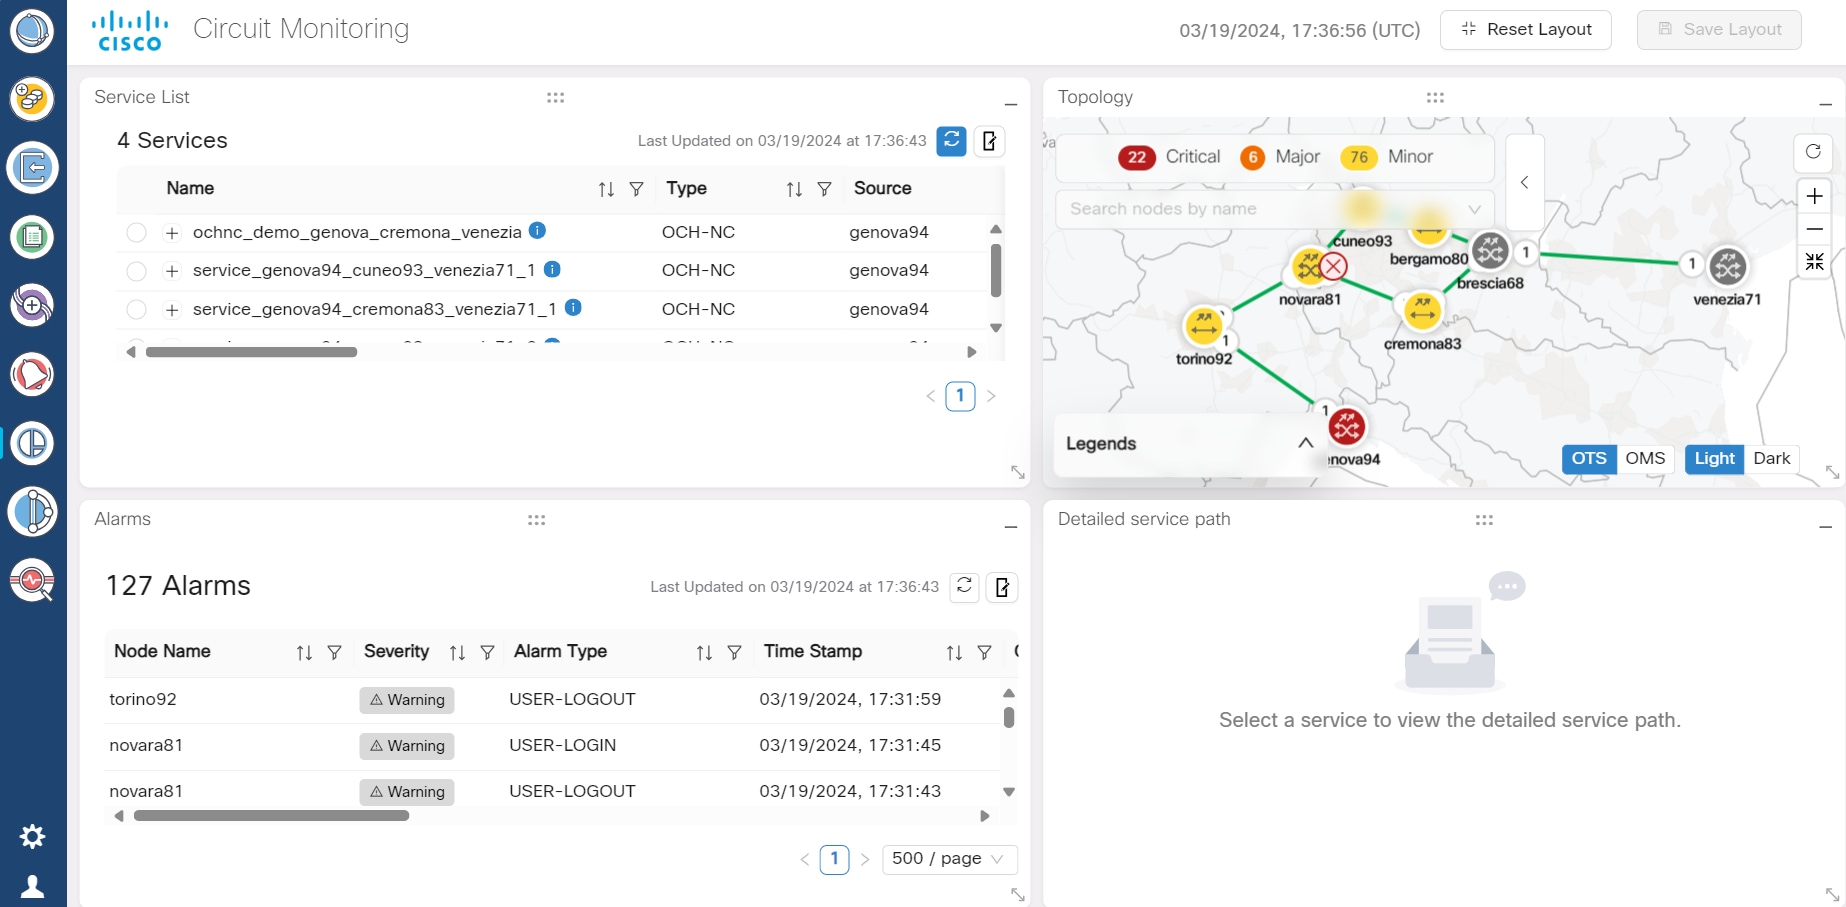
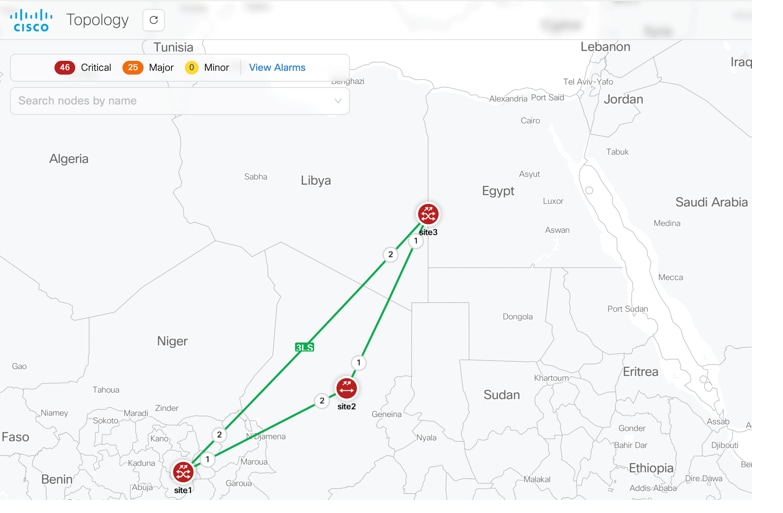
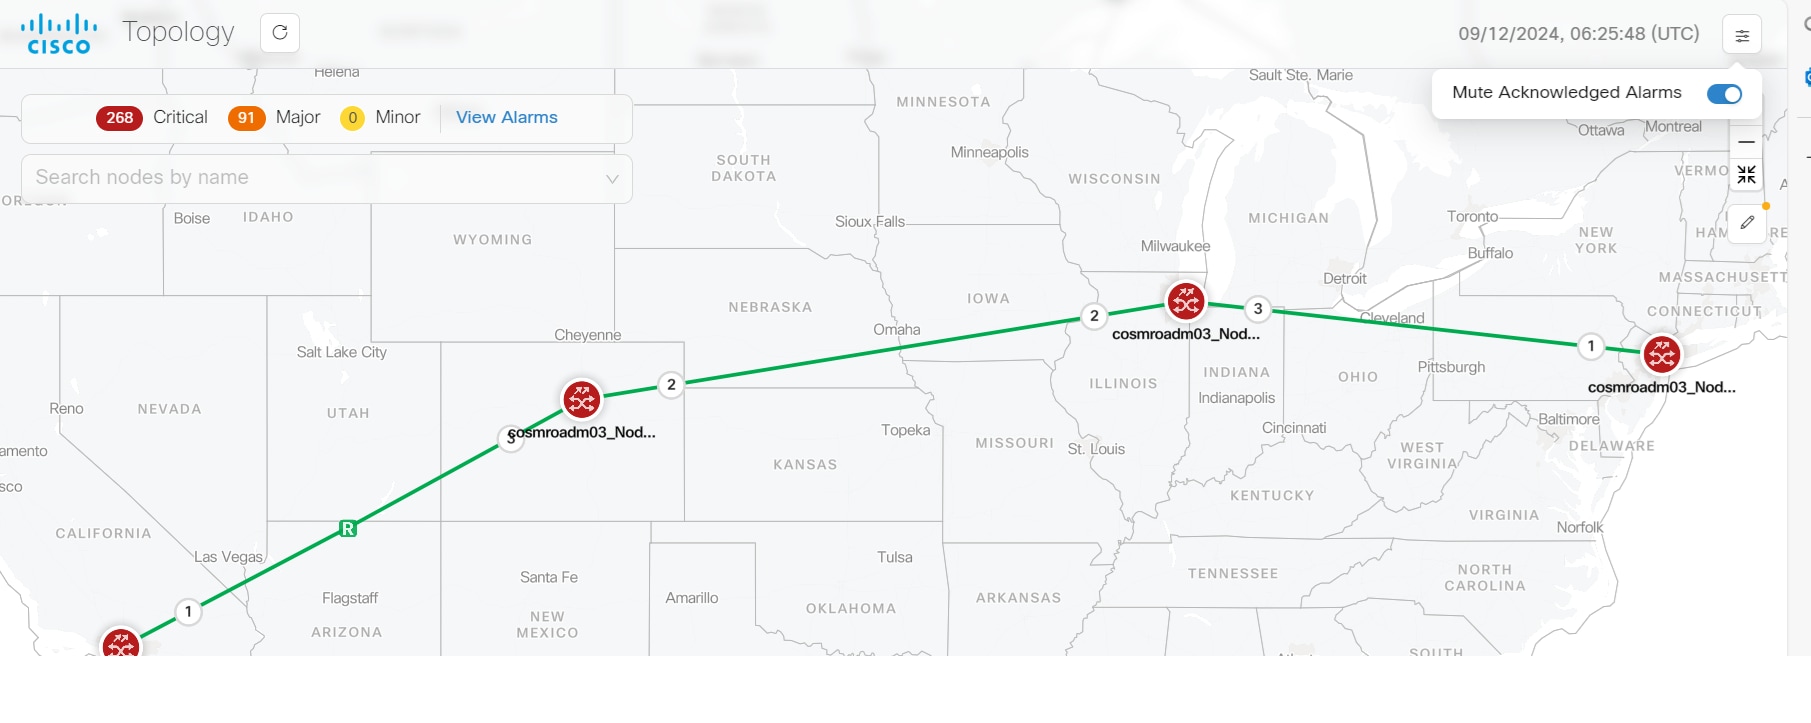
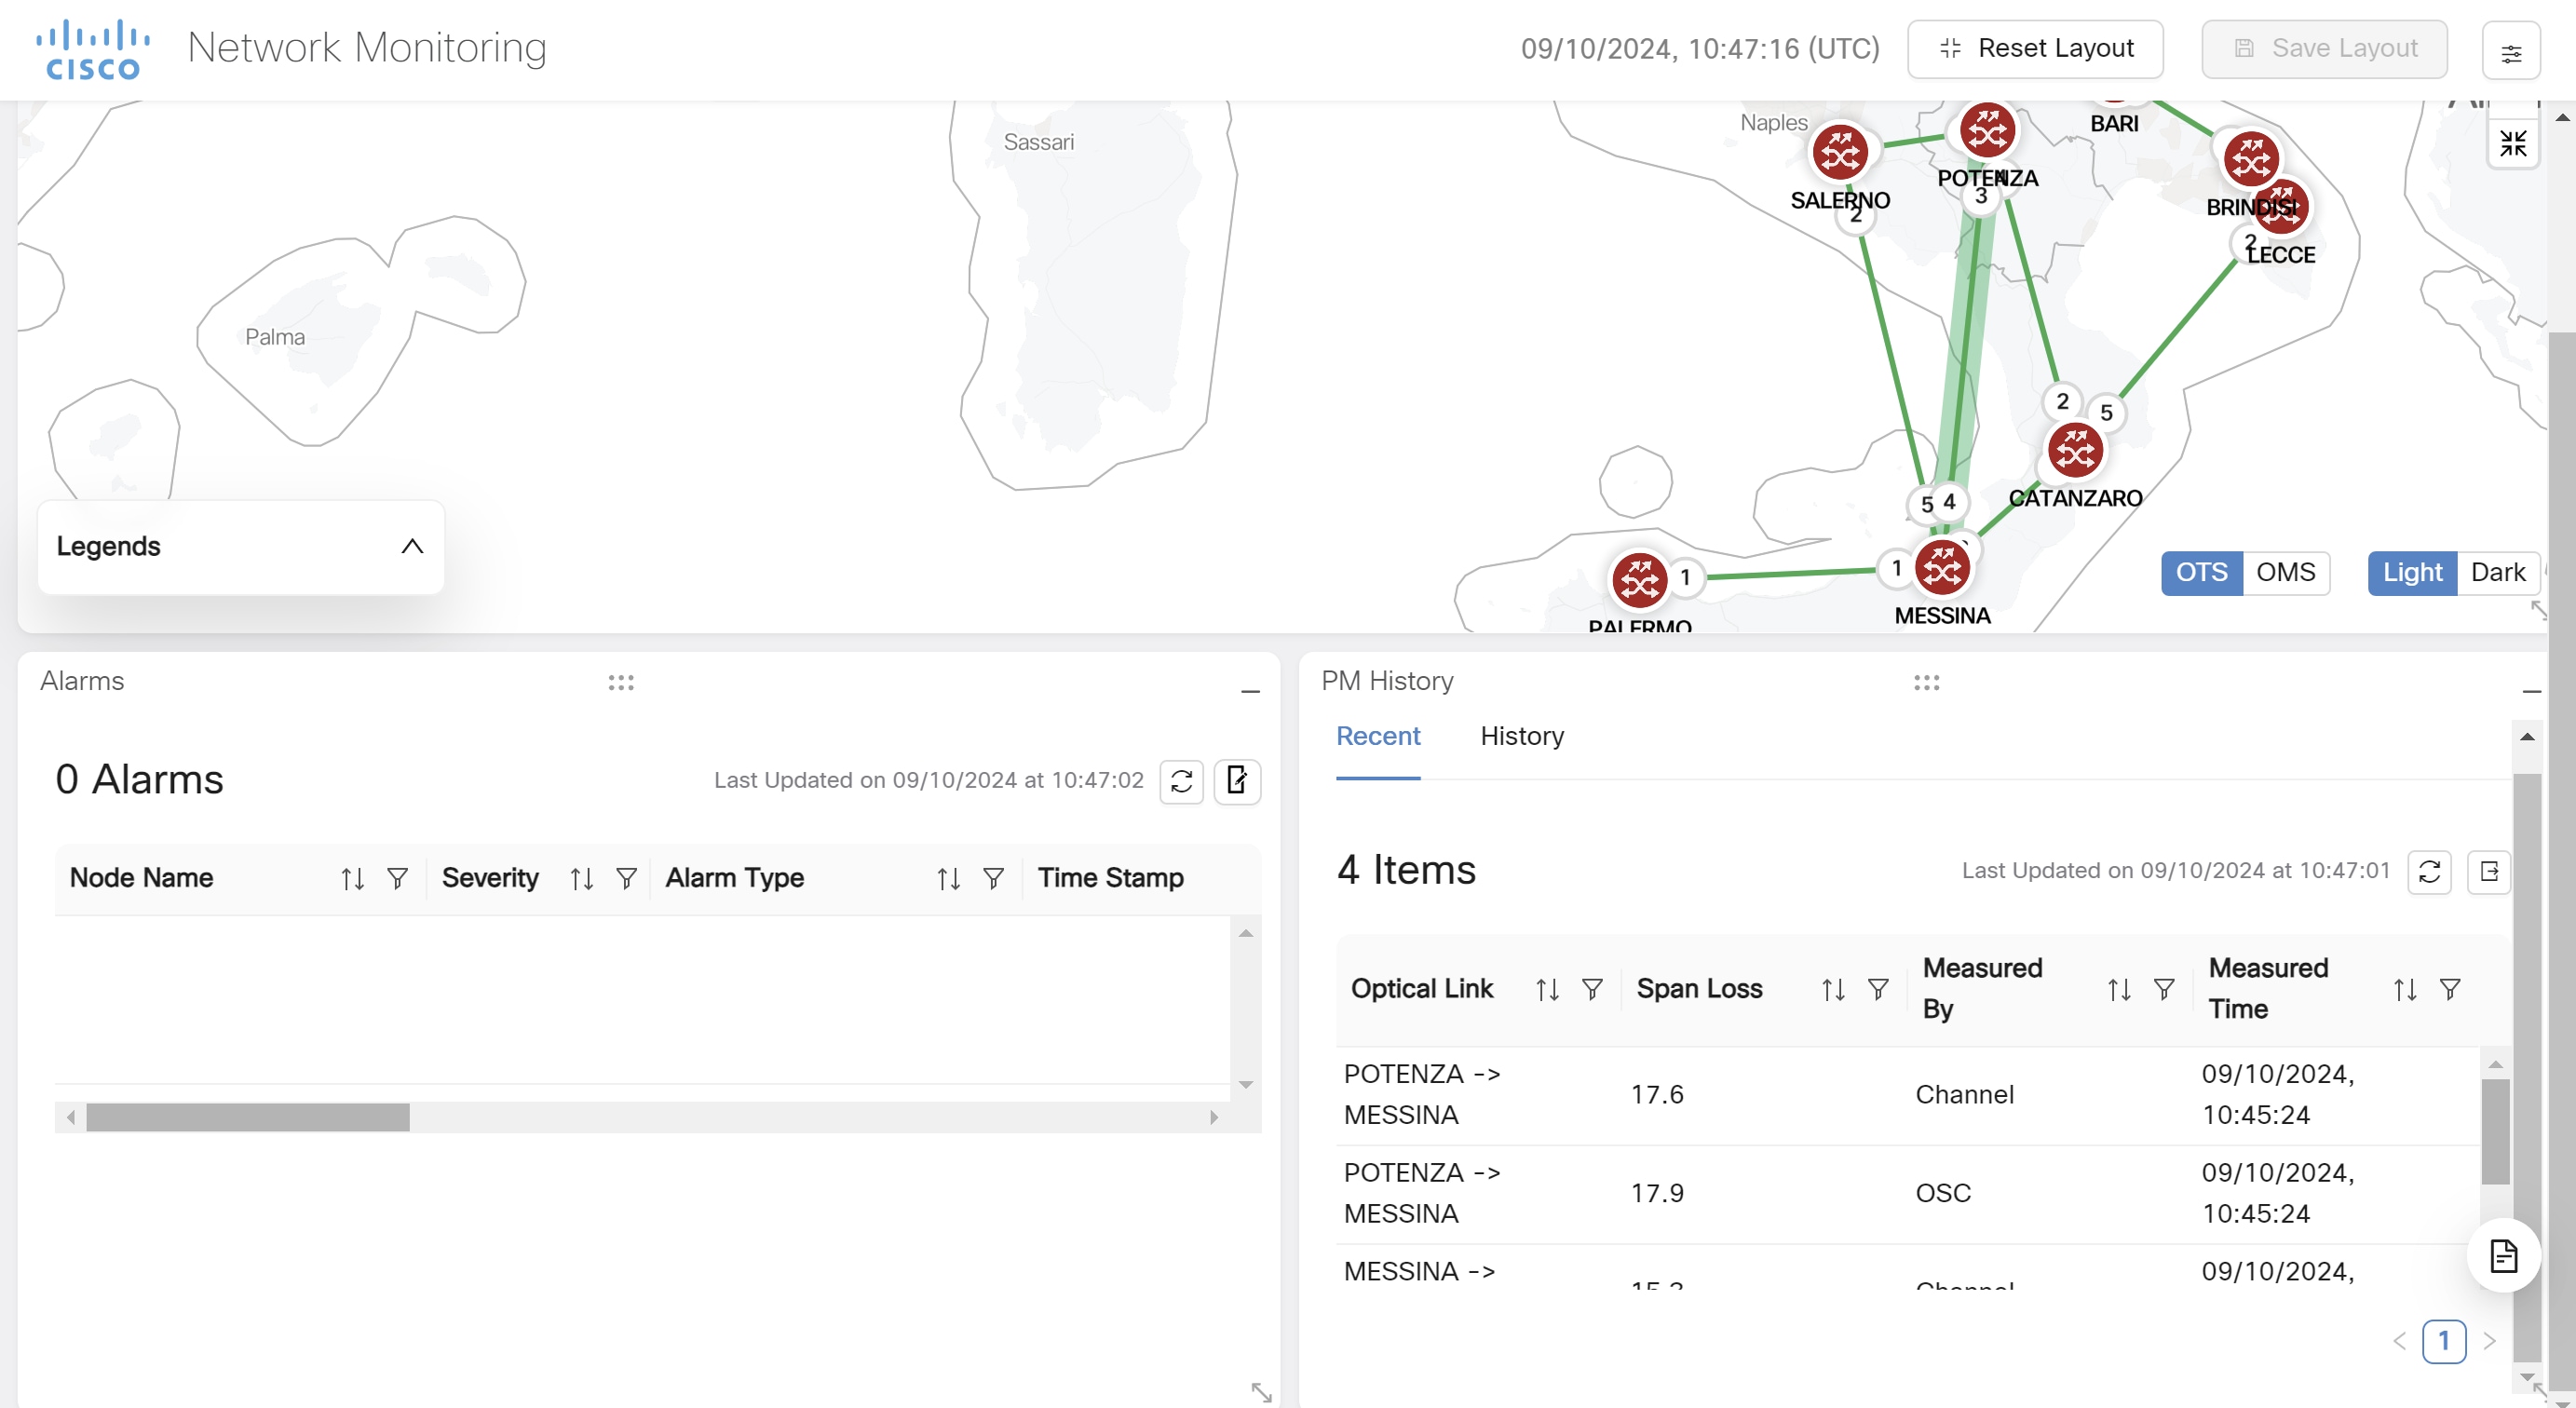
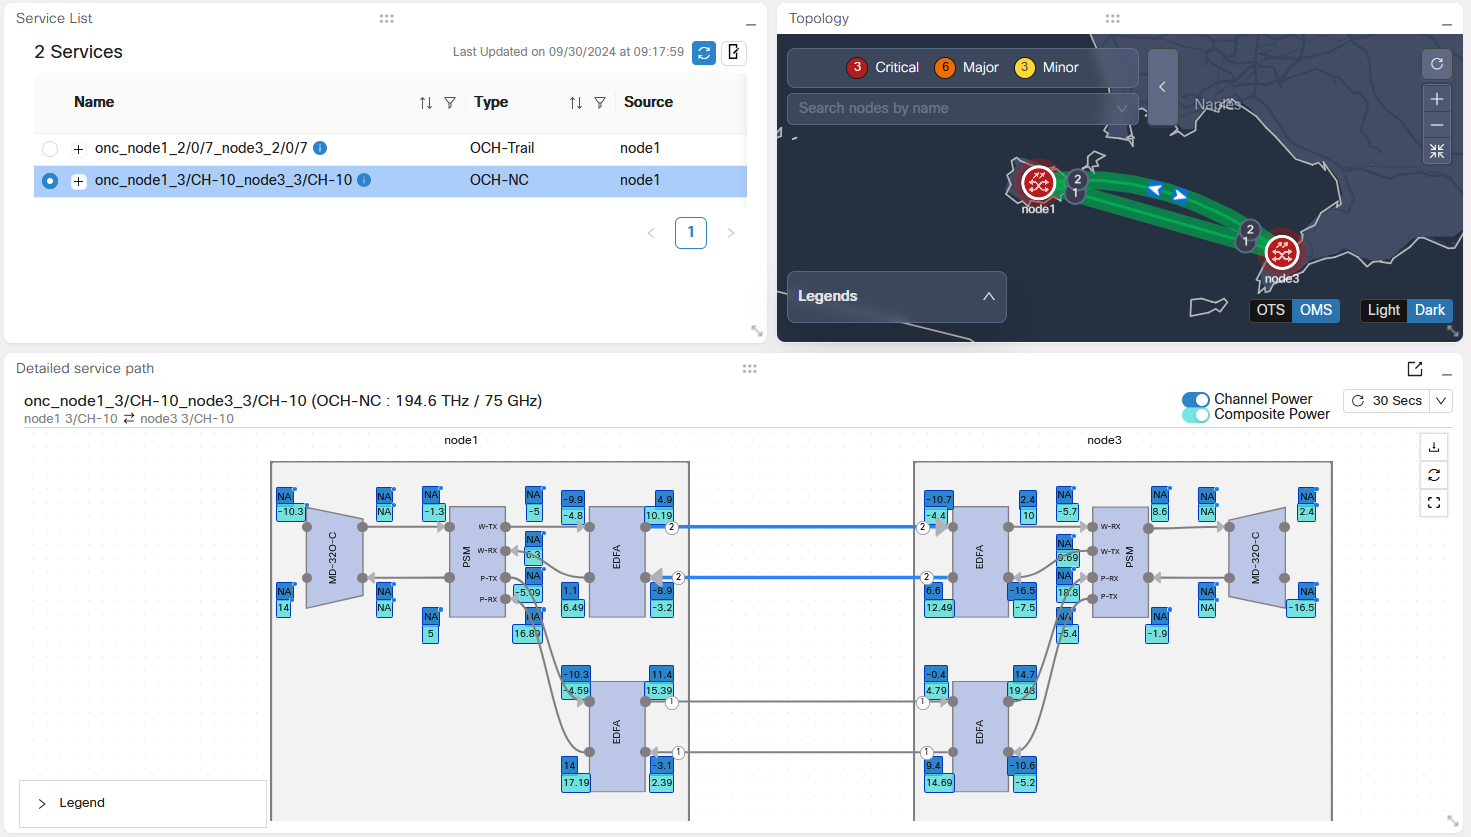
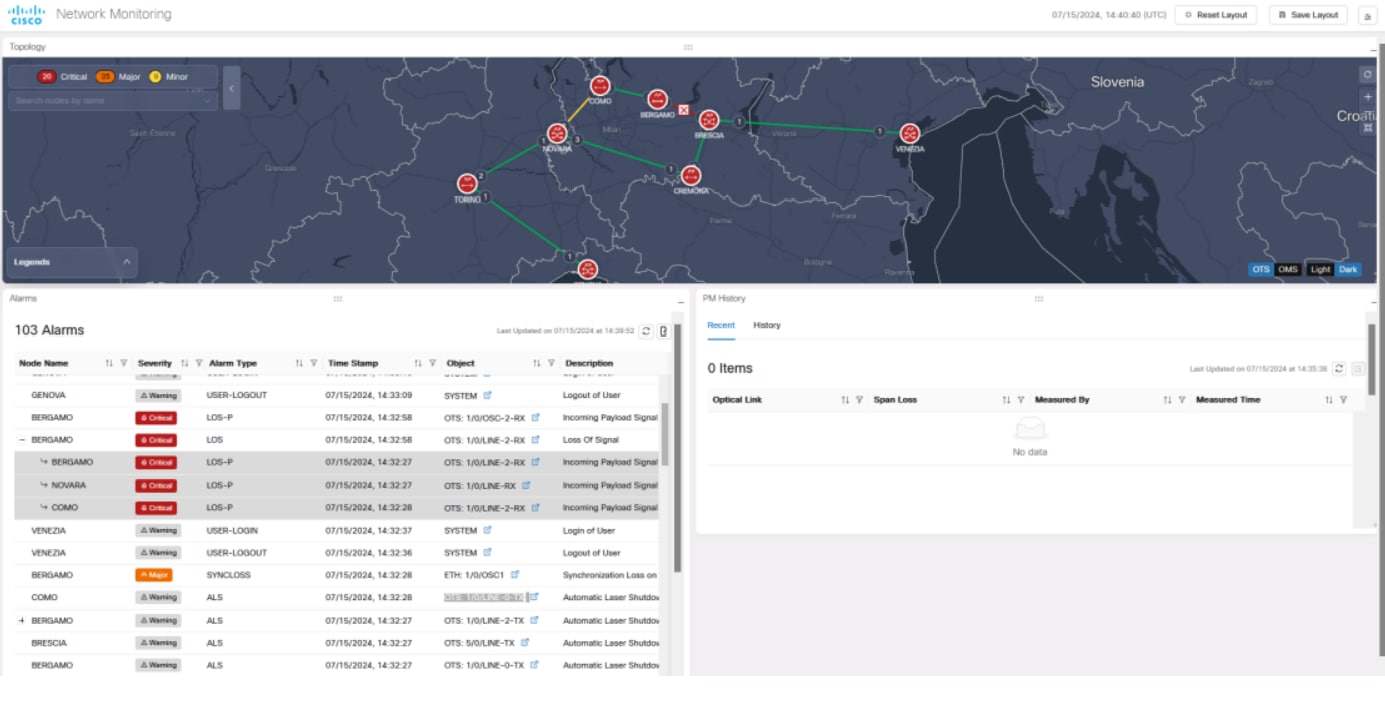
Topology displays the network along with the nodes and the associated network links on a map. You can toggle between the Light and Dark modes to view this screen. You can zoom in zoom out the entire screen to view the network and its components. You can select the OTS or OMS layers as options in the display. The OTS option is used to show all fiber span between all type of nodes, OLT or ILA. The OMS option is used to display only the ROADMs and the links between the ROADMs in the given network.
The Topology screen is an interactive screen which allows you to click on each node to fetch its information. The links between the nodes are the fiber links connecting each node. You can click on each fiber link to fetch its information when the OTS view is enabled. There can be multiple links connecting each node at any given point in time.
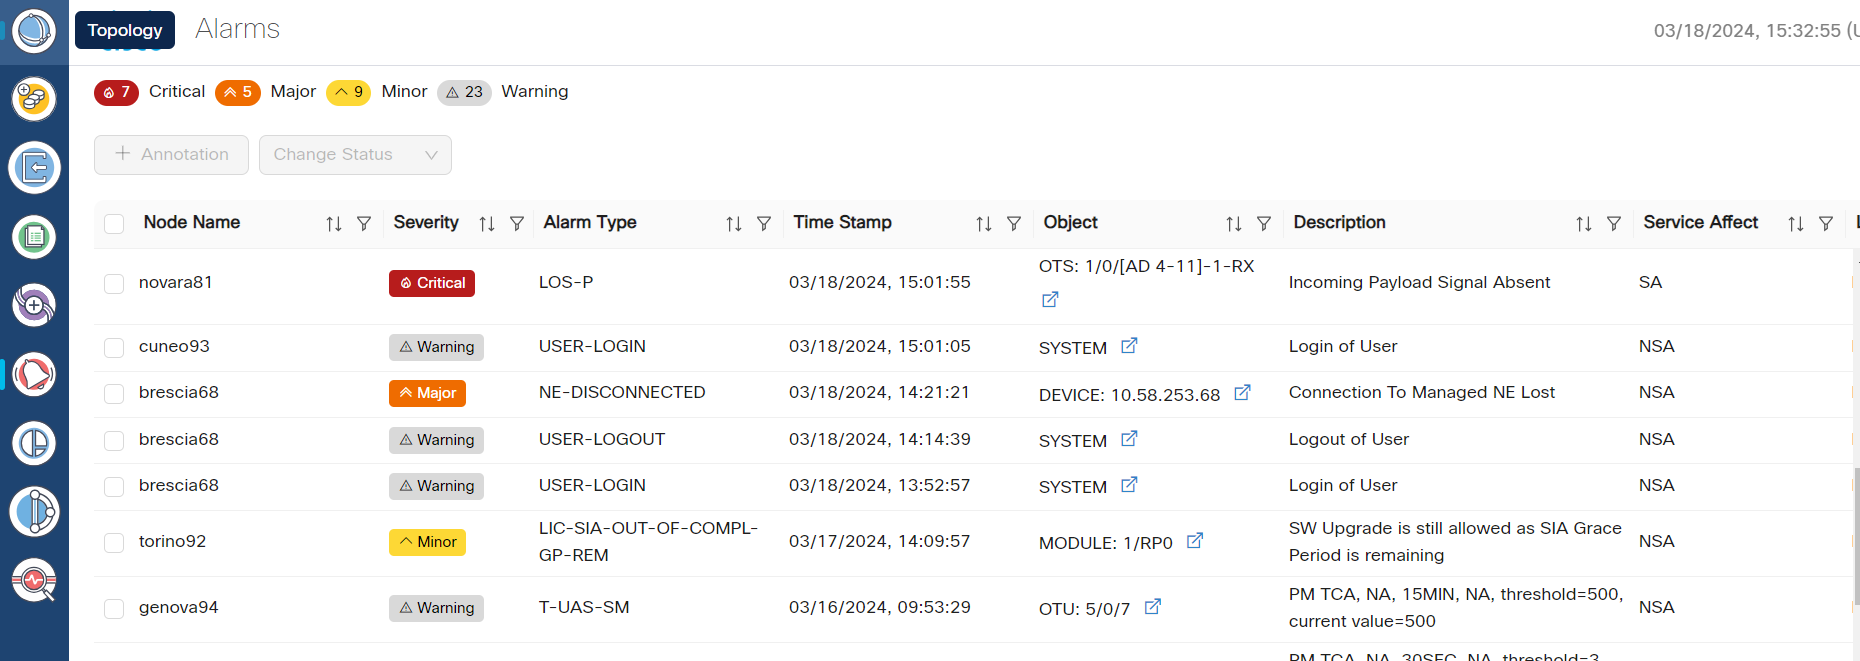
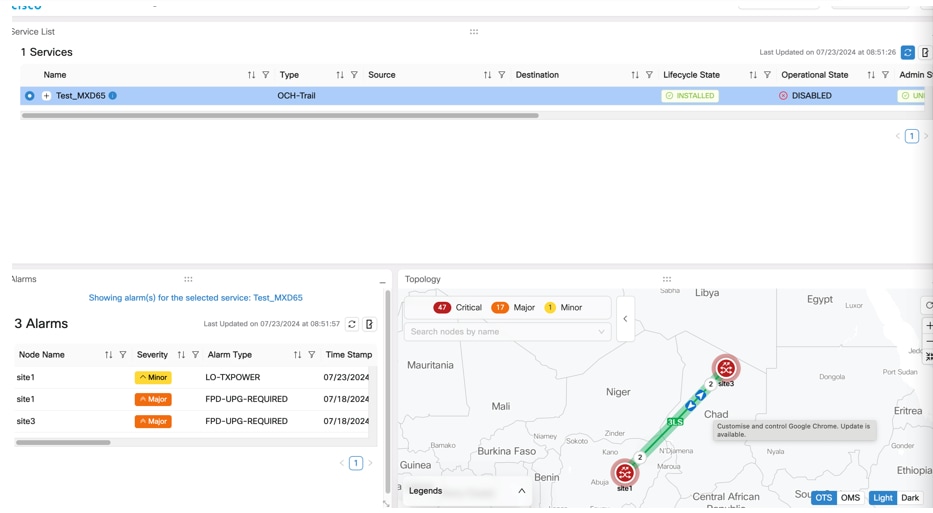
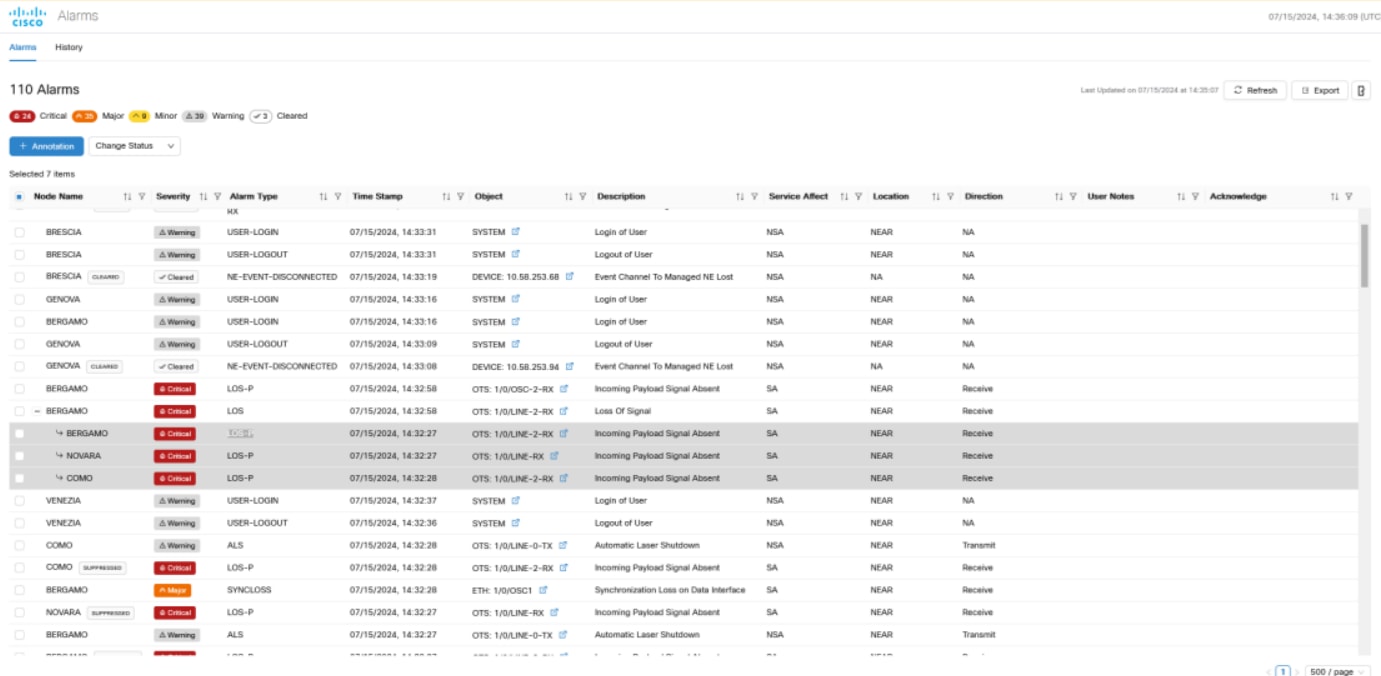
On the top of this screen, there is a panel for displaying the different alarm types and the count of each type of alarm that are part of the network. The alarm types are color coded based on the types of severity as seen in the table below.
|
Alarm Type |
Description |
|---|---|
| RED |
Critical alarms are displayed in red color. |
| ORANGE |
Major alarms are displayed in orange color. |
| YELLOW |
Minor alarms are displayed in yellow color. |
 Note |
Alarm severity type for any warning will appear as Warning and for cleared alarms they severity is displayed as Cleared. |
Note |
|
You can get the node name along with the COSM site name it belongs to and its current state by hovering over each node in the Topology map anytime. Right click on any node in the map to select Resync, View in Node UI and View Alarms options.
|
Options |
Description |
|---|---|
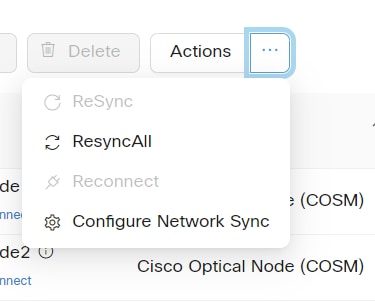
| Resync |
Resync starts the resync of the selected node. |
| View in Node UI |
This option takes you to the COSM site from where you can view the node details. |
| View Alarms |
This option opens the Alarms application in a new tab, from where you can view all the alarms details. |
You can also view the information related to the different nodes, links, and the states of each node in the network at any point in time by clicking the Legends option. To select any node in the network, use the drop-down box to select the node.
The EDIT icon allows you to dynamically move any node to any geo location on the screen. You can click on the RESET or SAVE button to reset or save the network status that is being displayed in the Topology screen anytime. Use the CENTER icon to position the map in the center.
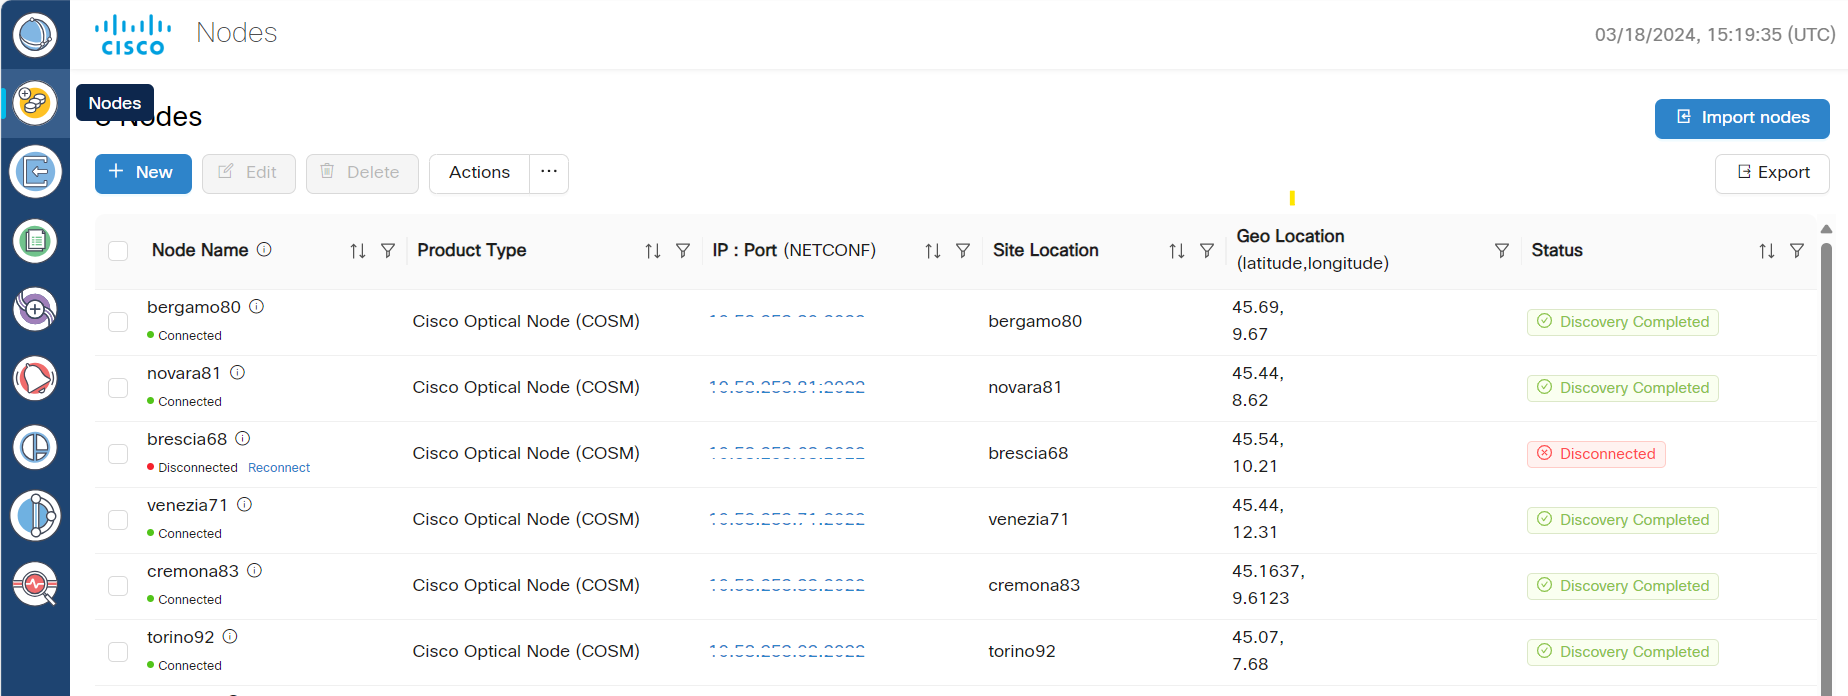
The disconnected nodes are displayed with a cross mark. To cross launch to other related pages use the options appearing when you right click from anywhere on the map. You can click on the REFRESH button to refresh the Topology screen with the current status anytime.
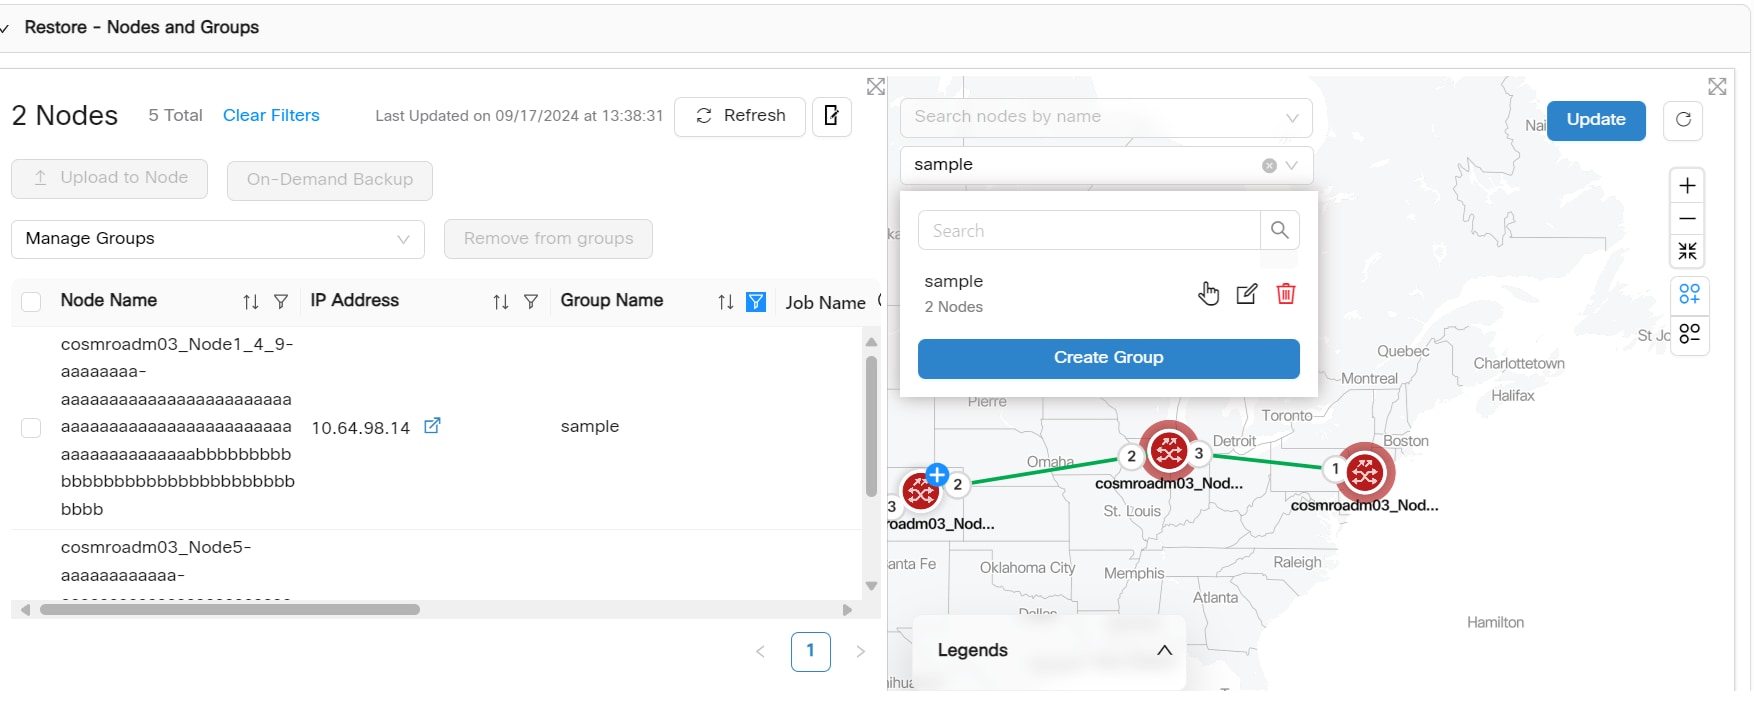
Use the Search nodes by name option to search for nodes in the topology network. This will fetch and locate the exact node in the map.
Note |
|
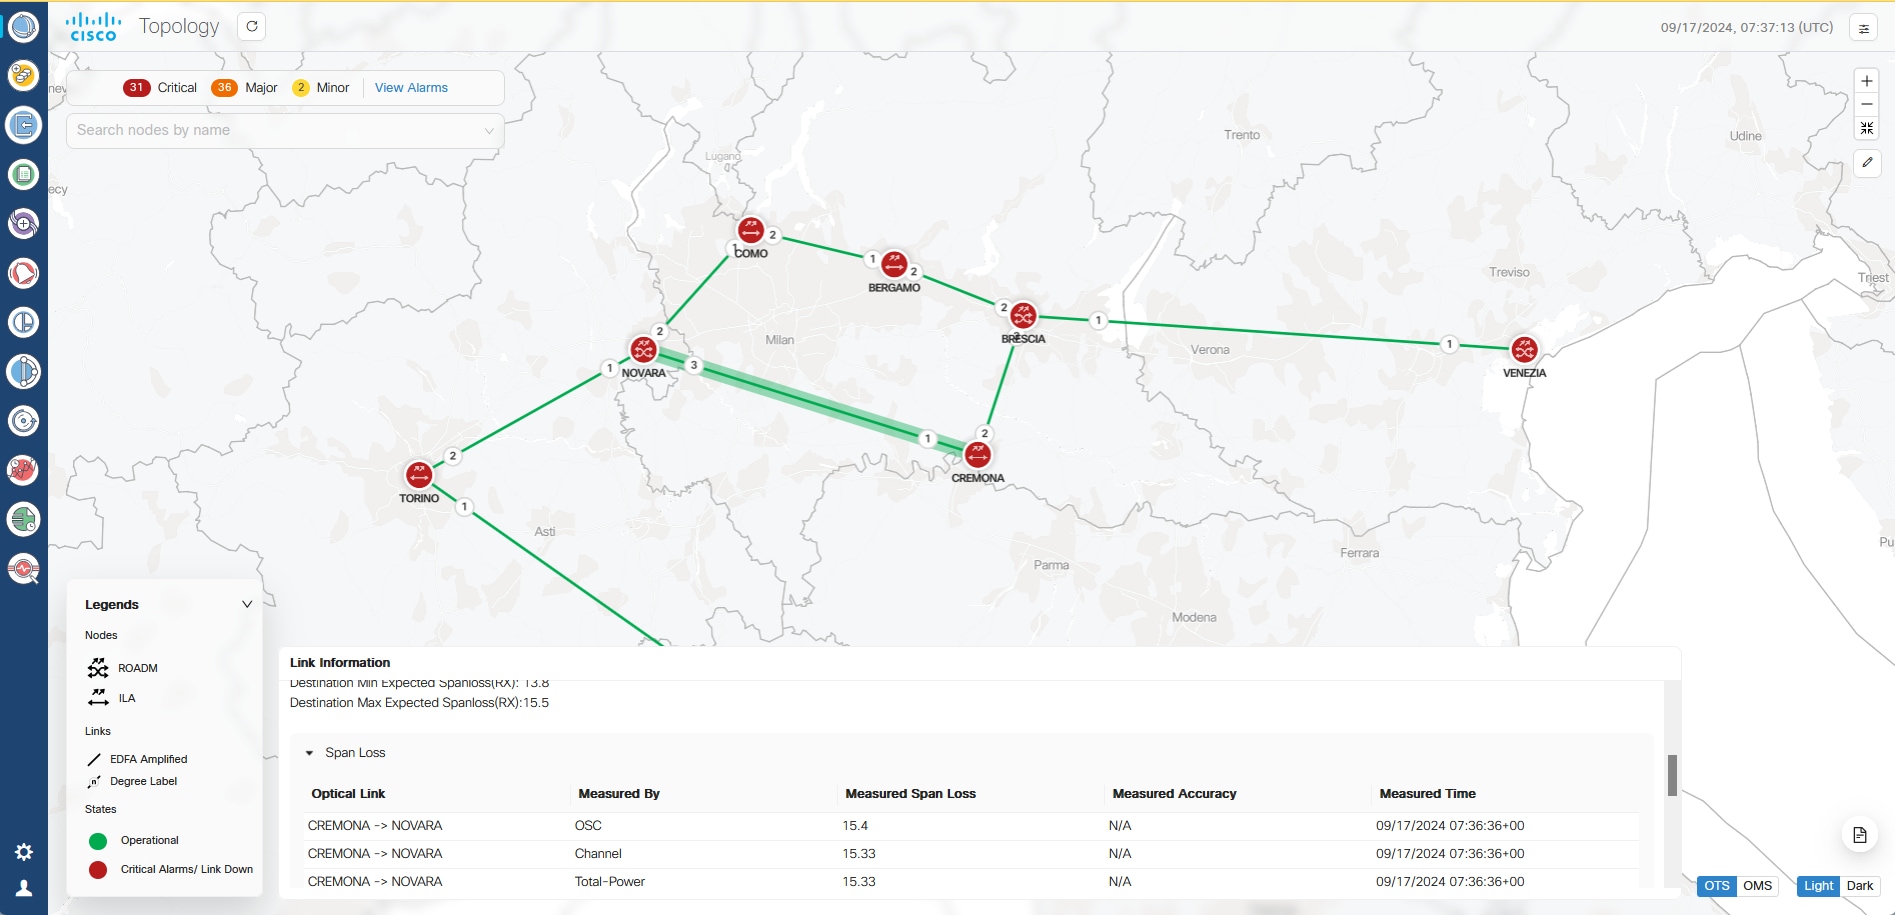
From Cisco Optical Network Controller 24.3.1 release onwards, fiber information and span loss details are added newly to the Topology live PM tool tip. When you click on the fiber sapn link in the map, you will see the following details appearing in the tool tip information:
-
Fiber Type: The type of fiber link.
-
Length: The length of the fiber link.
-
Source Min Expected Spanloss: Source node's minimum expected span loss value.
-
Source Max Expected Spanloss: Source node's maximum expected span loss value.
-
Destination Min Expected Spanloss: Destination node's minimum expected span loss value.
-
Destination Max Expected Spanloss: Destination node's maximum expected span loss value.
-
Span Loss: Span loss table.
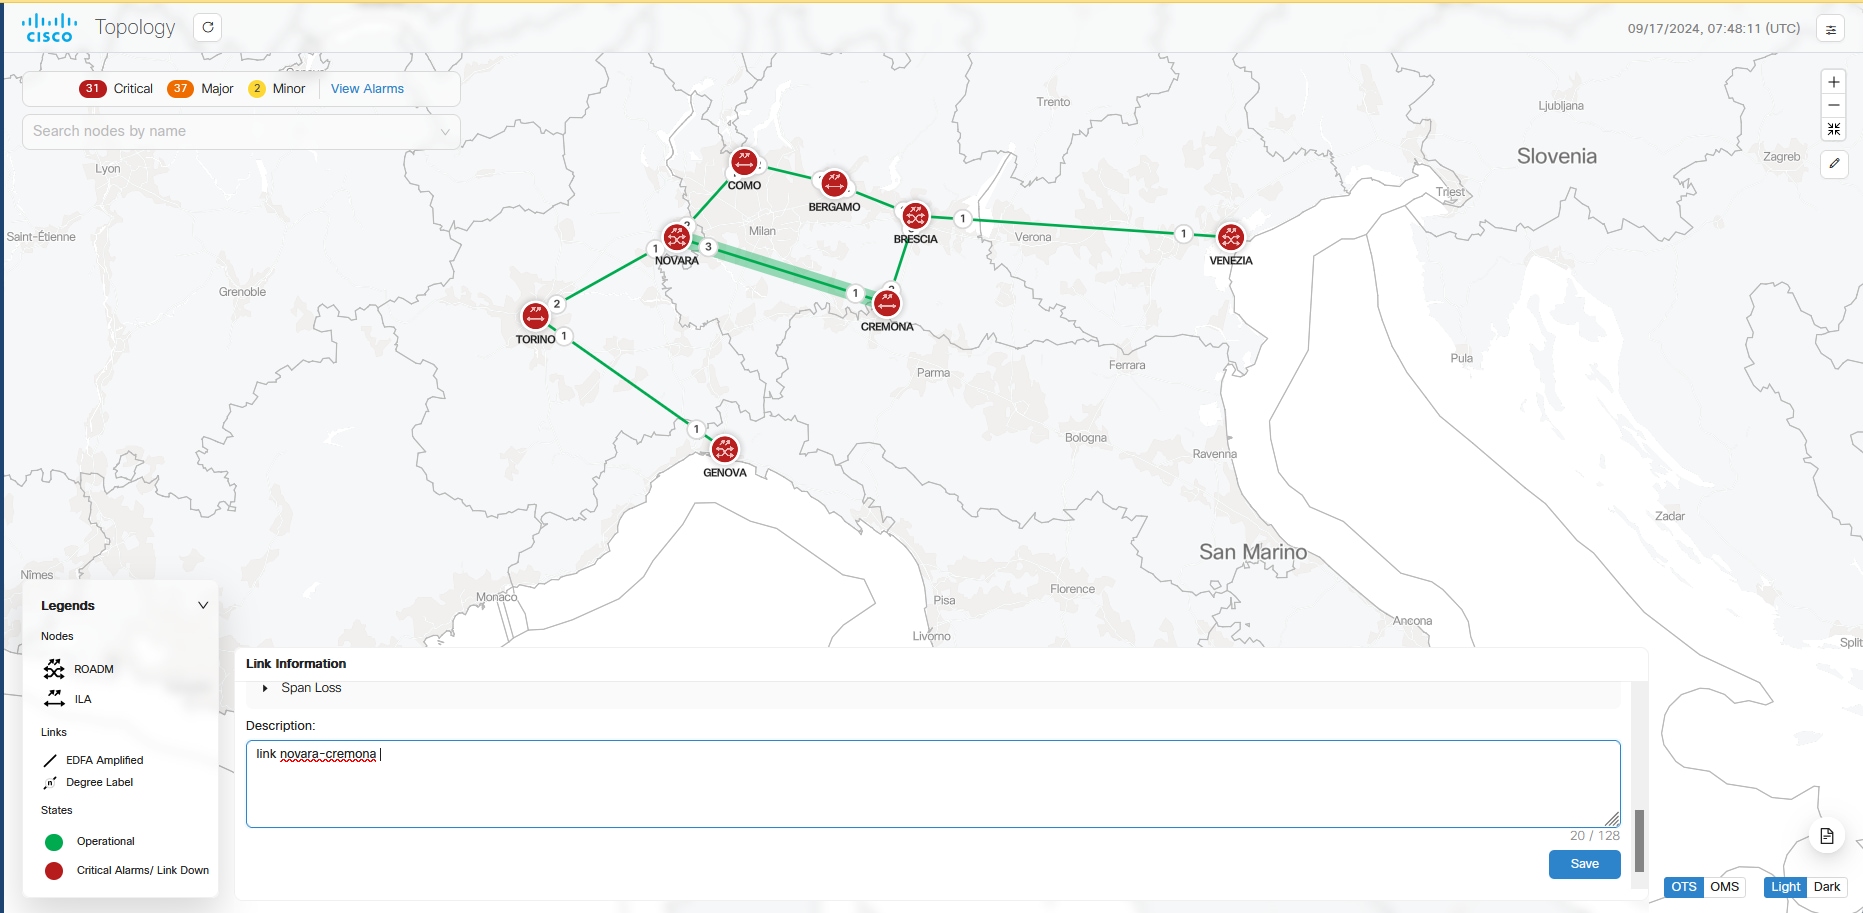
Note |
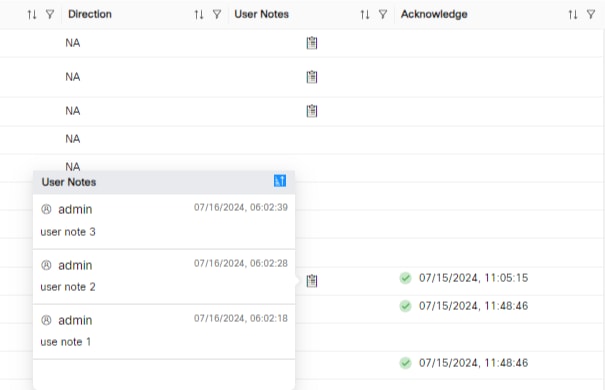
On Topology tool tip information it is possible to add a description and save. |
Troubleshooting in Topology
The most common problems encountered while using the Topology application is given below.
-
A pop-up message: Asking to reload the page appears in the following scenarios.
-
New node onboarded or deleted
-
Geo locations changed
-
-
In case the node, link or icons of the nodes are missing and not displayed in the Topology screen then refresh the page.
 Feedback