- Platform Overview
- Hardware vs Software Stack
- Services
- Available Form Factors
- Cluster Sizing Guidelines
- Supported Services
- Requirements and Guidelines
- Network Time Protocol (NTP) and Domain Name System (DNS)
- Nexus Dashboard External Networks
- Nexus Dashboard Internal Networks
- BGP Configuration and Persistent IPs
- Communication Ports: Nexus Dashboard
- Communication Ports: Nexus Dashboard Insights
- Communication Ports: Nexus Dashboard Fabric Controller
- Communication Ports: Nexus Dashboard Fabric Controller for SAN Deployments
- Fabric Connectivity
Platform Overview
Cisco Nexus Dashboard is a central management console for multiple data center sites and a common platform for hosting Cisco data center operation services, such as Nexus Dashboard Insights and Nexus Dashboard Orchestrator. These services are available for all the data center sites and provide real time analytics, visibility, assurance for network policies and operations, as well as policy orchestration for the data center fabrics, such as Cisco ACI or Cisco NDFC.
Nexus Dashboard provides a common platform and modern technology stack for the above-mentioned micro-services-based applications, simplifying the life cycle management of the different modern applications and reducing the operational overhead to run and maintain these applications. It also provides a central integration point for external 3rd party applications with the locally hosted applications.
Nexus Dashboard cluster typically consists of 1 or 3 master nodes. For 3-node clusters, you can also provision a number of worker nodes to enable horizontal scaling and standby nodes for easy cluster recovery in case of a master node failure. For maximum number of worker and standby nodes supported in this release, see the "Verified Scalability Limits" sections of the Cisco Nexus Dashboard Release Notes. For more information about extending your cluster with additional nodes, see Infrastructure Management.
Hardware vs Software Stack
Nexus Dashboard is offered as a cluster of specialized Cisco UCS servers (Nexus Dashboard platform) with the software framework (Nexus Dashboard) pre-installed on it. The Cisco Nexus Dashboard software stack can be decoupled from the hardware and deployed in a number of virtual form factors. For the purposes of this document, we will use "Nexus Dashboard platform" specifically to refer to the hardware and "Nexus Dashboard" to refer to the software stack and the GUI console.
This guide describes how to use the Nexus Dashboard; for hardware installation, see Nexus Dashboard Hardware Setup Guide and for deployment planning and Nexus Dashboard software installation, see the Nexus Dashboard Deployment Guide.
Services
Nexus Dashboard is a standard appliance platform to build and deploy services that would allow you to consume all Nexus Dashboard products in a consistent and uniform manner. You can subscribe and consume services like Insights, Orchestrator, Fabric Controller, and Data Broker with the Nexus Dashboard platform providing the necessary capacity and life cycle management operations for these services.
Typically, the Nexus Dashboard platform is shipped with only the software required for managing the lifecycle of these services, but no actual services are packaged with the appliance. If you allow public network connectivity from your data centers, you can download and install the services with a few clicks. However, without public network connectivity, you will need to manually download these services, upload them to the platform, and perform installation operations before you can use them.
If you are ordering the physical Nexus Dashboard servers, you have the option to choose some services to be pre-installed on the hardware before it is shipped to you. For more information, see the Nexus Dashboard Ordering Guide. Note that if you are deploying the virtual or cloud form factors of the Nexus Dashboard, there are no changes to service installation and you will need to deploy the services separately after the cluster is ready.
If you are ordering the physical Nexus Dashboard servers, you have the option to choose Nexus Dashboard Insights and Nexus Dashboard Orchestrator services to be pre-installed on the hardware before it is shipped to you. For more information, see the Nexus Dashboard Ordering Guide. Note that if you are deploying the virtual or cloud form factors of the Nexus Dashboard, you will need to deploy the services separately after the cluster is ready.
Available Form Factors
This release of Cisco Nexus Dashboard can be deployed using a number of different form factors. Keep in mind however, you must use the same form factor for all nodes, mixing different form factors within the same cluster is not supported.

Note ![]() Not all services are supported on all form factors. When planning your deployment, ensure to check the Nexus Dashboard Cluster Sizing tool for form factor and cluster size requirements.
Not all services are supported on all form factors. When planning your deployment, ensure to check the Nexus Dashboard Cluster Sizing tool for form factor and cluster size requirements.
-
Cisco Nexus Dashboard physical appliance (.iso)
This form factor refers to the original physical appliance hardware that you purchased with the Cisco Nexus Dashboard software stack pre-installed on it.
The later sections in this document describe how to configure the software stack on the existing physical appliance hardware to deploy the cluster. Setting up the original Cisco Nexus Dashboard platform hardware is described in Cisco Nexus Dashboard Hardware Setup Guide.
-
VMware ESX (.ova)
Virtual form factor that allows you to deploy a Nexus Dashboard cluster using VMware ESX virtual machines with one of two resource profiles:
-
Data node — node profile designed for data-intensive applications, such Nexus Dashboard Insights
-
App node — node profile designed for non-data-intensive applications, such Nexus Dashboard Orchestrator
-
-
Linux KVM (.qcow2)
Virtual form factor that allows you to deploy a Nexus Dashboard cluster using Linux KVM virtual machines.
-
Amazon Web Services (.ami)
Cloud form factor that allows you to deploy a Nexus Dashboard cluster using AWS instances.
-
Microsoft Azure (.arm)
Cloud form factor that allows you to deploy a Nexus Dashboard cluster using Azure instances.
-
In an existing Red Hat Enterprise Linux (RHEL) system
Beginning with Release 2.2(1), you can run Nexus Dashboard node in an existing Red Hat Enterprise Linux server.
Cluster Sizing Guidelines
As mentioned previously, Nexus Dashboard cluster is first deployed using 1 or 3 master nodes. Depending on the type and number of services you choose to run, you may be required to deploy additional worker nodes in your cluster after the initial deployment. For cluster sizing information and recommended number of nodes based on specific use cases, see the Nexus Dashboard Capacity Planning tool.
Note ![]() Single-node clusters are supported for a limited number of services and cannot be extended to a 3-node cluster after the initial deployment.
Single-node clusters are supported for a limited number of services and cannot be extended to a 3-node cluster after the initial deployment.
Only 3-node clusters support additional worker nodes.
If you deploy a single-node cluster and want to extended it to a 3-node cluster or add worker nodes, you will need to redeploy it as a base 3-node cluster.
For 3-node clusters, at least 2 master nodes are required for the cluster to remain operational. If 2 master nodes fail, the cluster will go offline and cannot be used until you recover it as described in this guide.
Adding worker nodes to your cluster is described in Managing Worker Nodes.
Adding standby nodes to your cluster is described in Managing Standby Nodes.
Supported Services
For the full list of supported applications and the associated compatibility information, see the Data Center Networking Services Compatibility Matrix.
Requirements and Guidelines
Network Time Protocol (NTP) and Domain Name System (DNS)
The Nexus Dashboard nodes require valid DNS and NTP servers for all deployments and upgrades.
Lack of valid DNS connectivity (such as if using an unreachable or a placeholder IP address) can prevent the system from deploying or upgrading successfully.
Note ![]() Nexus Dashboard acts as both a DNS client and resolver. It uses an internal Core DNS server which acts as DNS resolver for internal services. It also acts as a DNS client to reach external hosts within the intranet or the Internet, hence it requires an external DNS server to be configured.
Nexus Dashboard acts as both a DNS client and resolver. It uses an internal Core DNS server which acts as DNS resolver for internal services. It also acts as a DNS client to reach external hosts within the intranet or the Internet, hence it requires an external DNS server to be configured.
Additionally, Nexus Dashboard does not support DNS servers with wildcard records.
Nexus Dashboard External Networks
Cisco Nexus Dashboard is deployed as a cluster, connecting each service node to two networks. When first configuring Nexus Dashboard, you will need to provide two IP addresses for the two Nexus Dashboard interfaces—one connected to the Data Network and the other to the Management Network.
Individual services installed in the Nexus Dashboard may utilize the two networks for additional purposes, so we recommend consulting the specific service’s documentation in addition to this document for your deployment planning.
| Data Network | Management Network |
|---|---|
|
|
The two networks have the following requirements:
-
For all new Nexus Dashboard deployments, the management network and data network must be in different subnets.
-
For physical clusters, the management network must provide IP reachability to each node’s CIMC via TCP ports 22/443.
Nexus Dashboard cluster configuration uses each node’s CIMC IP address to configure the node.
-
For Nexus Dashboard Insights service, the data network must provide IP reachability to the in-band network of each fabric and of the APIC.
-
For Nexus Dashboard Insights and AppDynamics integration, the data network must provide IP reachability to the AppDynamics controller.
-
For Nexus Dashboard Orchestrator service, the data network can have in-band and/or out-of-band IP reachability for Cisco APIC sites but must have in-band reachability for Cisco NDFC sites.
-
The data network interface requires a minimum MTU of 1500 to be available for the Nexus Dashboard traffic.
Higher MTU can be configured if desired.
-
The following table summarizes service-specific requirements for the management and data networks.
Note
 Changing the data subnet requires redeploying the cluster, so we recommend using a larger subnet than the bare minimum required by the nodes and services to account for any additional services in the future. In addition to the requirements listed in this section, ensure that you consult the Release Notes for the specific service you plan to deploy.
Allocating persistent IP addresses for both Layer 2 and Layer 3 connectivity is done after the cluster is deployed using the External Service Pools configuration in the UI, as described in the Cisco Nexus Dashboard User Guide.
We recommend consulting the specific service’s documentation for any additional requirements and caveats related to persistent IP configuration.
Nexus Dashboard Service Management Interface Data Interface Total Number of Persistent IPs Nexus Dashboard Orchestrator
Layer 3 adjacent
Layer 3 adjacent
N/A
Nexus Dashboard Insights without SFLOW/NetFlow (ACI fabrics)
Layer 3 adjacent
Layer 3 adjacent
N/A
Nexus Dashboard Insights without SFLOW/NetFlow (NDFC fabrics)
Layer 3 adjacent
Layer 2 adjacent
6 IPs in data interface network if using IPv4
7 IPs in data interface network if using IPv6
Nexus Dashboard Insights with SFLOW/NetFlow (ACI or NDFC fabrics)
Layer 3 adjacent
Layer 2 adjacent
6 IPs in data interface network
Nexus Dashboard Fabric Controller, Release 12.0(x)
Layer 2 adjacent
Layer 2 adjacent
If LAN Device Management Connectivity is set to
Management(default):-
2 IPs in the management network for SNMP/Syslog and SCP services
-
If EPL is enabled, 1 additional IP in the data network for each fabric
-
If IP Fabric for Media is enabled, 1 additional IP in the management network for telemetry
If LAN Device Management Connectivity is set to
Data:-
2 IPs in the data network for SNMP/Syslog and SCP services
-
If EPL is enabled, 1 additional IP in the data network for each fabric
-
If IP Fabric for Media is enabled, 1 additional IP in the data network for telemetry
Nexus Dashboard Fabric Controller, Release 12.1(1) and latter
Layer 2 or Layer 3 adjacent
Layer 2 or Layer 3 adjacent
When operating in Layer 2 mode with LAN deployment type and LAN Device Management Connectivity set to
Management(default)-
2 IPs in the management network for SNMP/Syslog and SCP services
-
If EPL is enabled, 1 additional IP in the data network for each fabric
-
If IP Fabric for Media is enabled, 1 additional IP in the management network for telemetry
When operating in Layer 2 mode with LAN deployment type and LAN Device Management Connectivity set to
Data:-
2 IPs in the data network for SNMP/Syslog and SCP services
-
If EPL is enabled, 1 additional IP in the data network for each fabric
-
If IP Fabric for Media is enabled, 1 additional IP in the data network for telemetry
Nexus Dashboard Fabric Controller, Release 12.1(1) and latter
Layer 2 or Layer 3 adjacent
Layer 2 or Layer 3 adjacent
When operating in Layer 3 mode with LAN deployment type:
-
LAN Device Management Connectivity must be set to
Data -
2 IPs for SNMP/Syslog and SCP services
-
If EPL is enabled, 1 additional IP in the data network for each fabric
-
All persistent IPs must be part of a separate pool that must not overlap with the management or data subnets
For more information about Layer 3 mode for persistent IPs, see the Persistent IP Addresses
When operating in Layer 3 mode with SAN Controller deployment type:
-
1 IP for SSH
-
1 IP for SNMP/Syslog
-
1 IP for SAN Insights functionality
IP Fabric for Media mode are not supported in Layer 3 mode
Nexus Dashboard Data Broker
Layer 3 adjacent
N/A
N/A
-
-
Connectivity between the nodes is required on both networks with the following additional round trip time (RTT) requirements.
Note
You must always use the lowest RTT requirement when deploying the Nexus Dashboard cluster and applications. For example, if you plan to co-host the Insights and Orchestrator services, site connectivity RTT must not exceed 50ms.
Application Connectivity Maximum RTT Nexus Dashboard cluster
Between nodes
150 ms
Nexus Dashboard Orchestrator
Between nodes
150 ms
To sites
500 ms
Nexus Dashboard Insights
Between nodes
50 ms
To sites
50 ms
Nexus Dashboard Fabric Controller
Between nodes
50 ms
To sites
50 ms
Nexus Dashboard Data Broker
Between nodes
150 ms
To sites
500 ms
Nexus Dashboard Internal Networks
Two additional internal networks are required for communication between the containers used by the Nexus Dashboard:
-
Application overlay is used for applications internally within Nexus Dashboard
Application overlay must be a /16 network and a default value is pre-populated during deployment.
-
Service overlay is used internally by the Nexus Dashboard.
Service overlay must be a /16 network and a default value is pre-populated during deployment.
If you are planning to deploy multiple Nexus Dashboard clusters, they can use the same Application and Service subnets.
Note ![]() Communications between containers deployed in different Nexus Dashboard nodes is VXLAN-encapsulated and uses the data interfaces IP addresses as source and destination. This means that the Application Overlay and Service overlay addresses are never exposed outside the data network and any traffic on these subnets is routed internally and does not leave the cluster nodes.
Communications between containers deployed in different Nexus Dashboard nodes is VXLAN-encapsulated and uses the data interfaces IP addresses as source and destination. This means that the Application Overlay and Service overlay addresses are never exposed outside the data network and any traffic on these subnets is routed internally and does not leave the cluster nodes.
For example, if you had another service (such as DNS) on the same subnet as one of the Overlay networks, you would not be able to access it from your Nexus Dashboard as the traffic on that subnet would never be routed outside the cluster. As such, when configuring these networks, ensure that they are unique and do not overlap with any existing networks or services you may need to access from the Nexus Dashboard cluster nodes.
For the same reason, we recommend not using 169.254.0.0/16 (the Kubernetes br1 subnet) for the App or Service subnets.
BGP Configuration and Persistent IPs
Previous releases of Nexus Dashboard allowed you to configure one or more persistent IP addresses for services (such as Nexus Dashboard Insights) that require retaining the same IP addresses even in case they are relocated to a different Nexus Dashboard node. However, in those releases, the persistent IPs had to be part of the management and data subnets and the feature could be enabled only if all nodes in the cluster were part of the same Layer 3 network. Here the services used Layer 2 mechanisms like Gratuitous ARP or Neighbor Discovery to advertise the persistent IPs within it’s Layer 3 network
Beginning with Release 2.2(1), the Persistent IPs feature is supported even if you deploy the cluster nodes in different Layer 3 networks. In this case, the persistent IPs are advertised out of each node’s data links via BGP, which we refer to as "Layer 3 mode". The IPs must also be part of a subnet that is not overlapping with any of the nodes' management or data subnets. If the persistent IPs are outside the data and management networks, this feature will operate in Layer 3 mode by default; if the IPs are part of those networks, the feature will operate in Layer 2 mode.
BGP can be enabled during cluster deployment or from the Nexus Dashboard GUI after the cluster is up and running.
If you plan to enable BGP and use the persistent IP functionality, you must:
-
Ensure that the peer routers exchange the advertised persistent IPs between the nodes' Layer 3 networks.
-
Choose to enable BGP at the time of the cluster deployment as described in the subsequent sections or enable it afterwards in the Nexus Dashboard GUI as described in Persistent IP Addresses.
-
Ensure that the persistent IP addresses you allocate do not be overlap with any of the nodes' management or data subnets.
Communication Ports: Nexus Dashboard
The following ports are required by the Nexus Dashboard cluster.
Note ![]() All services use TLS or mTLS with encryption to protect data privacy and integrity over the wire.
All services use TLS or mTLS with encryption to protect data privacy and integrity over the wire.
| Service | Port | Protocol | Direction | Connection |
|---|---|---|---|---|
|
ICMP |
ICMP |
ICMP |
In/Out |
Other cluster nodes, CIMC, default gateway |
|
SSH |
22 |
TCP |
In/Out |
CLI and CIMC of the cluster nodes |
|
TACACS |
49 |
TCP |
Out |
TACACS server |
|
DNS |
53 |
TCP/UDP |
Out |
DNS server |
|
HTTP |
80 |
TCP |
Out |
Internet/proxy |
|
NTP |
123 |
UDP |
Out |
NTP server |
|
HTTPS |
443 |
TCP |
In/Out |
UI, other clusters (for multi-cluster connectivity), fabrics, Internet/proxy |
|
LDAP |
389 |
TCP |
Out |
LDAP server |
|
Radius |
1812 |
TCP |
Out |
Radius server |
|
KMS |
9880 |
TCP |
In/Out |
Other cluster nodes and ACI fabrics |
|
Infra-Service |
30012 |
TCP/UDP |
In/Out |
Other cluster nodes |
| Service | Port | Protocol | Direction | Connection |
|---|---|---|---|---|
|
SSH |
22 |
TCP |
Out |
In-band of switches and APIC |
|
HTTPS |
443 |
TCP |
Out |
In-band of switches and APIC/NDFC |
|
VXLAN |
4789 |
TCP |
In/Out |
Other cluster nodes |
|
KMS |
9880 |
TCP |
In/Out |
Other cluster nodes and ACI fabrics |
|
Infra-Service |
3379 |
TCP |
In/Out |
Other cluster nodes |
|
Kafka |
30001 |
TCP |
In/Out |
In-band of switches and APIC/NDFC |
|
Infra-Service |
30016 |
TCP/UDP |
In/Out |
Other cluster nodes |
|
Infra-Service |
30500-30600 |
TCP/UDP |
In/Out |
Other cluster nodes |
Communication Ports: Nexus Dashboard Insights
In addition to the ports required by the Nexus Dashboard cluster nodes, which are listed above, the following ports are required by the Nexus Dashboard Insights service.
| Service | Port | Protocol | Direction | Connection |
|---|---|---|---|---|
|
Show Techcollection |
2022 |
TCP |
In/Out |
In-band of switches and APIC/NDFC |
|
Flow Telemetry |
5640-5671 |
UDP |
In |
In-band of switches |
|
TAC Assist |
8884 |
TCP |
In/Out |
Other cluster nodes |
|
KMS |
9989 |
TCP |
In/Out |
Other cluster nodes and ACI fabrics |
|
SW Telemetry |
5695 |
TCP |
In/Out |
Other cluster nodes |
Communication Ports: Nexus Dashboard Fabric Controller
In addition to the ports required by the Nexus Dashboard (ND) cluster nodes, the following ports are required by the Nexus Dashboard Fabric Controller (NDFC) service.
Note ![]() The following ports apply to the Nexus Dashboard management network and/or data network interfaces depending on which interface provides IP reachability from the NDFC service to the switches.
The following ports apply to the Nexus Dashboard management network and/or data network interfaces depending on which interface provides IP reachability from the NDFC service to the switches.
| Service | Port | Protocol | Direction | Connection |
|---|---|---|---|---|
|
SSH |
22 |
TCP |
Out |
SSH is a basic mechanism for accessing devices. |
|
SCP |
22 |
TCP |
Out |
SCP clients archiving NDFC backup files to remote server. |
|
SMTP |
25 |
TCP |
Out |
SMTP port is configurable through NDFC’s Server Settings menu. |
|
DHCP |
67 |
UDP |
In |
If NDFC local DHCP server is configured for Bootstrap/POAP purposes. |
|
DHCP |
68 |
UDP |
Out |
|
|
SNMP |
161 |
TCP/UDP |
Out |
SNMP traffic from NDFC to devices. |
|
HTTPS/HTTP (NX-API) |
443/80 |
TCP |
Out |
NX-API HTTPS/HTTP client connects to device NX-API server on port 443/80, which is also configurable. NX-API is an optional feature, used by limited set of NDFC functions. |
|
HTTPS (vCenter, Kubernetes, OpenStack, Discovery) |
443 |
TCP |
Out |
NDFC provides an integrated host and physical network topology view by correlating the information obtained from registered VMM domains, such as VMware vCenter or OpenStack, as well as container orchestrators, such as Kubernetes. |
The following ports apply to the External Service IPs, also known as persistent IPs, used by some of the NDFC services. These External Service IPs may come from the Nexus Dashboard management subnet pool or the data subnet pool depending on the configured settings.
| Service | Port | Protocol | Direction | Connection |
|---|---|---|---|---|
|
SCP |
22 |
TCP |
In |
SCP is used by various features to transfer files between devices and the NDFC service. The NDFC SCP service serves as the SCP server for both downloads and uploads. SCP is also used by the POAP client on the devices to download POAP-related files. |
|
TFTP (POAP) |
69 |
TCP |
In |
Only used for device zero-touch provisioning via POAP, where devices can send (limited jailed write-only access to NDFC) basic inventory information to NDFC to start secure POAP communication. NDFC Bootstrap or POAP can be configured for TFTP or HTTP/HTTPS. |
|
HTTP (POAP) |
80 |
TCP |
In |
Only used for device zero-touch provisioning via POAP, where devices can send (limited jailed write-only access to NDFC) basic inventory information to NDFC to start secure POAP communication. NDFC Bootstrap or POAP can be configured for TFTP or HTTP/HTTPS. |
|
BGP |
179 |
TCP |
In/Out |
For Endpoint Locator, per fabric where it is enabled, an EPL service is spawned with its own persistent IP. This service is always associated with the Nexus Dashboard data interface. NDFC EPL service peers with the appropriate BGP entity (typically BGP Route-Reflectors) on the fabric to get BGP updates needed to track endpoint information. |
|
HTTPS (POAP) |
443 |
TCP |
In |
Secure POAP is accomplished via the NDFC HTTPS Server on port 443. The HTTPS server is bound to the SCP-POAP service and uses the same persistent IP assigned to that pod. |
|
Syslog |
514 |
UDP |
In |
When NDFC is configured as a Syslog server, Syslogs from the devices are sent out toward the persistent IP associated with the SNMP-Trap/Syslog service pod |
|
SCP |
2022 |
TCP |
Out |
Transport tech-support file from persistent IP of NDFC POAP-SCP pod to a separate ND cluster running Nexus Dashboard Insights. |
|
SNMP Trap |
2162 |
UDP |
In |
SNMP traps from devices to NDFC are sent out toward the persistent IP associated with the SNMP-Trap/Syslog service pod. |
|
GRPC (Telemetry) |
33000 |
TCP |
In |
SAN Insights Telemetry Server which receives SAN data (such as storage, hosts, flows, and so on) over GRPC transport tied to NDFC Persistent IP. |
|
GRPC (Telemetry) |
50051 |
TCP |
In |
Information related to multicast flows for IP Fabric for Media deployments as well as PTP for general LAN deployments is streamed out via software telemetry to a persistent IP associated with a NDFC GRPC receiver service pod. |
Communication Ports: Nexus Dashboard Fabric Controller for SAN Deployments
Nexus Dashboard Fabric Controller can be deployed on a single-node or 3-node Nexus Dashboard cluster. The following ports are required for NDFC SAN deployments on single-node clusters.
| Service | Port | Protocol | Direction | Connection |
|---|---|---|---|---|
|
SSH |
22 |
TCP |
Out |
SSH is a basic mechanism for accessing devices. |
|
SCP |
22 |
TCP |
Out |
SCP clients archiving NDFC backup files to remote server. |
|
SMTP |
25 |
TCP |
Out |
SMTP port is configurable through NDFC’s Server Settings menu. |
|
SNMP |
161 |
TCP/UDP |
Out |
SNMP traffic from NDFC to devices. |
|
HTTPS (vCenter, Kubernetes, OpenStack, Discovery) |
443 |
TCP |
Out |
NDFC provides an integrated host and physical network topology view by correlating the information obtained from registered VMM domains, such as VMware vCenter or OpenStack, as well as container orchestrators, such as Kubernetes. |
The following ports apply to the External Service IPs, also known as Persistent IPs, used by some of the NDFC services. These External Service IPs may come from the Nexus Dashboard management subnet pool or the data subnet pool depending on the configured settings.
| Service | Port | Protocol | Direction | Connection |
|---|---|---|---|---|
|
SCP |
22 |
TCP |
In |
SCP is used by various features to transfer files between devices and the NDFC service. The NDFC SCP service functions for both downloads and uploads. |
|
Syslog |
514 |
UDP |
In |
When NDFC is configured as a Syslog server, syslogs from the devices are sent out towards the persistent IP associated with the SNMP-Trap/Syslog service pod. |
|
SNMP Trap |
2162 |
UDP |
In |
SNMP traps from devices to NDFC are sent out toward the persistent IP associated with the SNMP-Trap/Syslog service pod. |
|
GRPC (Telemetry) |
33000 |
TCP |
In |
SAN Insights Telemetry Server which receives SAN data (such as storage, hosts, flows, and so on) over GRPC transport tied to NDFC Persistent IP. |
Fabric Connectivity
You can connect the Nexus Dashboard cluster to your fabrics in two ways:
-
The Nexus Dashboard cluster connected to the fabric via a Layer 3 network.
-
The Nexus Dashboard nodes connected to the leaf switches as typical hosts.
For Cisco Cloud Network Controller fabrics, you will need to connect via a Layer 3 network.
Physical Node Cabling
If you deployed a virtual or cloud form factor cluster, you can skip this section.
The following figure shows the Nexus Dashboard physical node interfaces:
-
eth1-1andeth1-2must be connected to the Management network -
eth2-1andeth2-2must be connected to the Data network
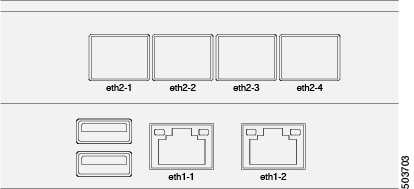
The interfaces are configured as Linux bonds (one for the data interfaces and one for the management interfaces) running in active-standby mode. All interfaces must be connected to individual host ports, PortChannel or vPC are not supported.
When Nexus Dashboard nodes are connected to Cisco Catalyst switches, packets are tagged with vlan0 if no VLAN is specified. In this case, you must add switchport voice vlan dot1p command to the switch interfaces where the nodes are connected to ensure reachability over the data network.
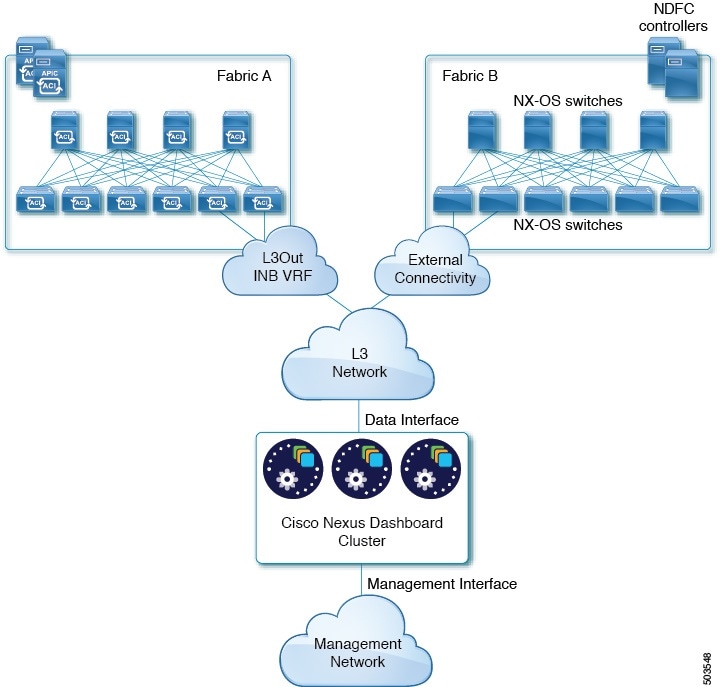
Connecting via External Layer 3 Network
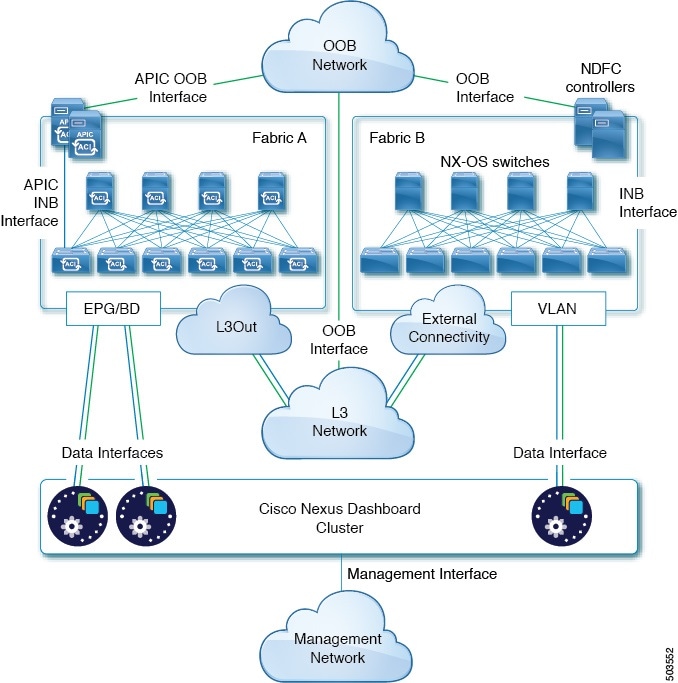
We recommend connecting the Nexus Dashboard cluster to the fabrics via an external Layer 3 network as it does not tie the cluster to any one fabric and the same communication paths can be establish to all sites. Specific connectivity depends on the type of applications deployed in the Nexus Dashboard:
-
If you are deploying Nexus Dashboard Orchestrator to manage Cisco ACI fabrics only, you can establish connectivity from the data interface to either the in-band or out-of-band (OOB) interface of each site’s APIC or both.
-
If you are deploying Nexus Dashboard Orchestrator to manage Cisco NDFC fabrics, you must establish connectivity from the data interface to the in-band interface of each site’s NDFC.
-
If you are deploying Day-2 Operations applications, such as Nexus Dashboard Insights, you must establish connectivity from the data interface to the in-band network of each fabric and of the APIC.
If you plan to connect the cluster across an external Layer 3 network, keep the following in mind:
-
For ACI fabrics, you must configure an L3Out and the external EPG for Cisco Nexus Dashboard data network connectivity in the management tenant.
Configuring external connectivity in an ACI fabric is described in Cisco APIC Layer 3 Networking Configuration Guide.
-
For NDFC fabrics, if the data interface and NDFC’s in-band interface are in different subnets, you must add a route to the Nexus Dashboard’s data network on NDFC.
You can add the route from the NDFC UI by navigating to Administration > Customization > Network Preference > In-Band (eth2), then adding the route and saving.
-
If you specify a VLAN ID for your data interface during setup of the cluster, the host port must be configured as trunk allowing that VLAN.
However, in most common deployments, you can leave the VLAN ID empty and configure the host port in access mode.
The following two figures show two distinct network connectivity scenarios when connecting the Nexus Dashboard cluster to the fabrics via an external Layer 3 network. The primary purpose of each depends on the type of application you may be running in your Nexus Dashboard.
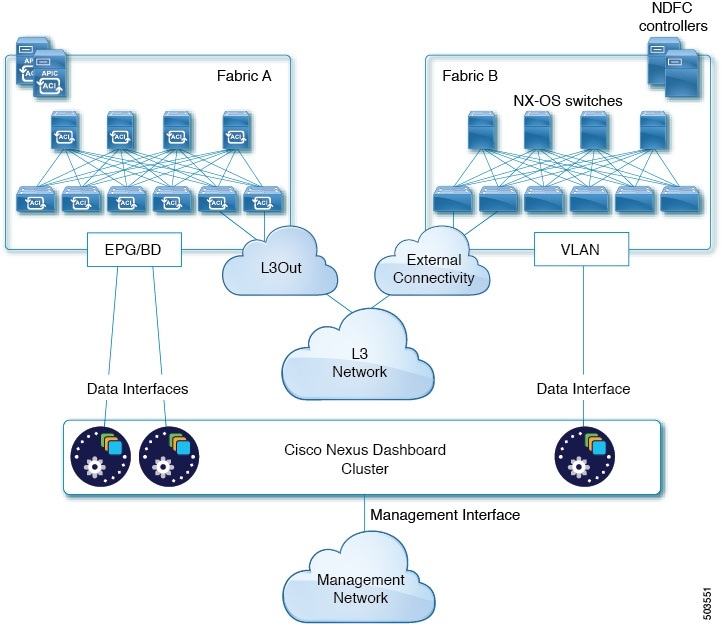
Connecting the Nodes Directly to Leaf Switches
You can also connect the Nexus Dashboard cluster directly to one of the fabrics. This provides easy connectivity between the cluster and in-band management of the fabric, but ties the cluster to the specific fabric and requires reachability to other fabrics to be established through external connectivity. This also makes the cluster dependent on the specific fabric so issues within the fabric may impact Nexus Dashboard connectivity. Like in the previous example, connectivity depends on the type of applications deployed in the Nexus Dashboard:
-
If you are deploying Nexus Dashboard Orchestrator to manage Cisco ACI fabrics only, you can establish connectivity from the data interface to either the in-band or out-of-band (OOB) interface of each site’s APIC.
-
If you are deploying Nexus Dashboard Insights or Network Assurance Engine, you must establish connectivity from the data interface to the in-band interface of each fabric.
For ACI fabrics, the data interface IP subnet connects to an EPG/BD in the fabric and must have a contract established to the local in-band EPG in the management tenant. We recommend deploying the Nexus Dashboard in the management tenant and in-band VRF. Connectivity to other fabrics is established via an L3Out.
-
If you are deploying Nexus Dashboard Insights with ACI fabrics, the data interface IP address and the ACI fabric’s in-band IP address must be in different subnets.
If you plan to connect the cluster directly to the leaf switches, keep the following in mind:
-
If deploying in VMware ESX or Linux KVM, the host must be connected to the fabric via trunk port.
-
If you specify a VLAN ID for your data network during setup of the cluster, the Nexus Dashboard interface and the port on the connected network device must be configured as trunk
However, in most cases we recommend not assigning a VLAN to the data network, in which case you must configure the ports in access mode.
-
For ACI fabrics:
-
We recommend configuring the bridge domain (BD), subnet, and endpoint group (EPG) for Cisco Nexus Dashboard connectivity in management tenant.
Because the Nexus Dashboard requires connectivity to the in-band EPG in the in-band VRF, creating the EPG in the management tenant means no route leaking is required.
-
You must create a contract between the fabric’s in-band management EPG and Cisco Nexus Dashboard EPG.
-
-
If several fabrics are monitored with apps on the Services Engine cluster, L3Out with default route or specific route to other ACI fabric in-band EPG must be provisioned and a contract must be established between the cluster EPG and the L3Out’s external EPG.
The following two figures show two distinct network connectivity scenarios when connecting the Nexus Dashboard cluster directly to the fabrics' leaf switches. The primary purpose of each depends on the type of application you may be running in your Nexus Dashboard.
 Feedback