
First Published: 2024-06-28
Americas Headquarters
Cisco Systems, Inc.
170 West Tasman Drive
San Jose, CA 95134-1706
USA
http://www.cisco.com
Tel: 408 526-4000
800 553-NETS (6387)
Fax: 408 527-0883
New and Changed Information
The following table provides an overview of the significant changes up to the current release. The table does not provide an exhaustive list of all changes or the new features up to this release.
| Feature | Description | Release | Where Documented |
|---|---|---|---|
|
Multicast routing analytics support for VXLAN fabrics |
You can now use multicast routing analytics with VXLAN fabrics. |
6.5.1 |
|
|
Out-of-band management connection support for telemetry streaming |
When you add a fabric, you can now use an out-of-band management connection support for telemetry streaming. In previous releases, you could only use in-band management. |
6.5.1 |
|
|
Terminology change |
The term "sites" is renamed to "fabrics". |
6.5.1 |
Entire document |
This document is available from your Cisco Nexus Dashboard Insights GUI as well as online at www.cisco.com. For the latest version of this document, visit Cisco Nexus Dashboard Insights Documentation.
Fabrics
Fabrics
Fabrics are on-premises network regions that consist of a group of switches and other networking devices that provide connectivity for your applications and endpoints. You can split fabrics into different availability zones, such as pods, that are analyzed and managed by Nexus Dashboard Insights.
To learn about how to prepare fabrics for onboarding, see Add fabrics.
An NDFC fabric comprises a fabric running NX-OS that is either fully managed or only monitored by NDFC. All of the switches in the fabric can be analyzed as a part of the fabric. With a NX-OS based fabric, the fabric could be a NDFC managed fabric or it could be configured using other means such as CLI, Ansible, or any other configuration automation mechanism. For fabrics not using NDFC for configuration management, NDFC must be installed and the fabric must be discovered in read-only or monitor mode. Nexus Dashboard Insights uses NDFC for topology discovery and to identify the role of the switch in the fabric.
An NX-OS fabric comprises Nexus 9000 switches that run NX-OS without a controller and is connected to Nexus Dashboard.
Once your fabric is onboarded and fully prepared, Nexus Dashboard Insights will start the fabric analysis to collect data from your fabric and display the fabric information in the Fabrics page. See Fabric Details. From there, you can view your fabric’s general information, inventory, L2 and L3 connectivity, endpoints, anomalies and advisories and more! To learn more see Fabric Details.
Fabric connection types
When you add a fabric, you can use either an in-band management or out-of-band management connection for telemetry streaming. You specify the connection type in the GUI with the Telemetry Streaming Network property.
With out-of-band management, NDFC and standalone NX-OS fabrics use the out-of-band management IP addresses of the switches.
Advantages of in-band management
In-band management supports Flow Telemetry and increased bandwidth for telemetry streaming.
Advantages of out-of-band management
Most fabrics already have out-of-band management set up. In such a case, using this connection type does not require any additional connection configuration.
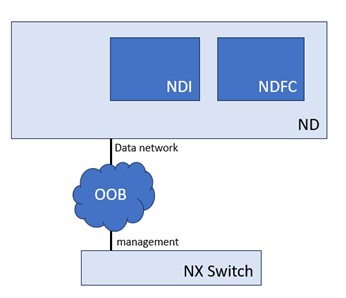
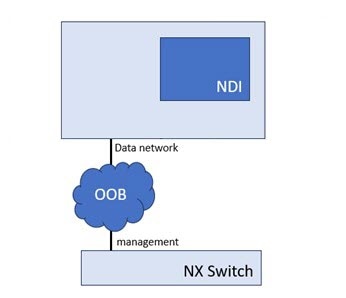
Supported out-of-band management fabric topologies
Nexus Dashboard Insights supports these out-of-band management fabric topologies:
-
Nexus Dashboard Insights is in a different cluster than NDFC
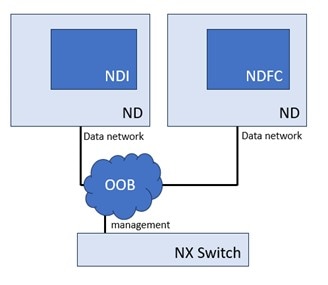
-
Nexus Dashboard Insights is in the same cluster as NDFC
-
Nexus Dashboard Insights is in a standalone NX-OS fabric
Guidelines and limitations for the connection types
Observe these guidelines and limitations for the connection types:
-
You can set the connection type only when you add the fabric. You cannot change the type after you added the fabric. To change the connection type, you must remove the fabric then re-add it.
-
For out-of-band management, the Nexus Dashboard Insights data network must have reachability to the management addresses of the switches.
-
Out-of-band management is not supported with Flow Telemetry.
-
If you use out-of-band management with Traffic Analytics, flow troubleshooting is disabled.
Prerequisites
-
You have configured DNS on the fabric.
-
You have configured NTP on the fabric.
-
You have configured PTP on the fabric.
-
For in-band management, configure the Nexus switch in-band port address on the loopback interface and the address should be reachable to the Nexus Dashboard data network. For out-of-band management, this is optional.
-
For out-of-band management, the Nexus Dashboard Insights data network must have reachability to the management addresses of the switches.
-
If the switches are controlled by NDFC and they are discovered using the out-of-band management interface, then the Nexus Dashboard data interface should have routed connectivity to those switches.
-
You have configured Fabric connectivity in Cisco Nexus Dashboard’s Admin Console. See Cisco Nexus Dashboard Platform Overview.
-
You have the supported software version for your fabric. See Nexus Dashboard and Services Compatibility Matrix.
-
For snapshot fabrics, you have Python3 installed on your system.
-
To onboard an NX-OS fabric without a controller:
-
You must enable NX-OS Discovery in Nexus Dashboard.
-
You must enable CDP or LLDP in Nexus switches.
-
-
You must enable the NX-API feature on all Cisco NX-OS switches at the CLI prompt before onboarding the fabric in Nexus Dashboard Insights by using the following command:
switch(config)# feature nxapi
Guidelines and Limitations
-
You cannot onboard a Cisco NDFC fabric with remote authentication using the Manually Add option in Nexus Dashboard Insights. You must first add the NDFC fabric with remote authentication in Nexus Dashboard’s Admin Console. You can then onboard the NDFC fabric using the Ready to Add option in NDI.
-
Switch name or Host name should be unique across all the fabrics discovered in Nexus Dashboard Insights.
-
SVI interfaces are not displayed for Cisco NX-OS switches.
-
Connectivity Analysis is not supported with externally-onboarded NDFC fabrics.
Guidelines and Limitations for NX-OS Fabrics without a Controller (Standalone NX-OS Fabrics)
-
Interface flow rules in the context of Flow Telemetry are not supported.
-
Onboarding a snapshot fabric is not supported.
-
Onboarding NX-OS fabrics without a controller is supported on Cisco NX-OS release 9.3(10) and later.
-
Onboarding an online NX-OS fabric without a controller is only supported on a physical Nexus Dashboard cluster. Onboarding an online NX-OS fabric without a controller is not supported on a virtual Nexus Dashboard cluster.
-
Only Nexus Dashboard Insights deployment mode is supported to onboard NX-OS Standalone fabrics. The following deployment modes are not supported and you cannot enable NX-OS discovery for onboarding NX-OS Standalone fabrics:
-
Nexus Dashboard Insights and NDFC
-
Nexus Dashboard Insights and Nexus Dashboard Orchestrator
-
-
Onboarding NX-OS fabrics without a controller is supported only on the Cisco Nexus 9000 product families.
Add fabrics
You can add a fabric to Nexus Dashboard Insights using the following methods:
-
Online fabrics
-
Enable the fabric that has already been added to Nexus Dashboard. Fabrics added to the Nexus Dashboard are not enabled in the services by default, so you will need to explicitly enable them directly from Nexus Dashboard Insights.
-
Add a fabric directly to Nexus Dashboard Insights.
-
-
Snapshot fabrics
-
Add a snapshot fabric.
-
Add an online NDFC fabric
-
Navigate to Manage > Fabrics.
-
Click Add Fabric.
-
If you are adding a fabric in Nexus Dashboard Insights for the very first time, you will receive the following message. Click Add Fabric to proceed.
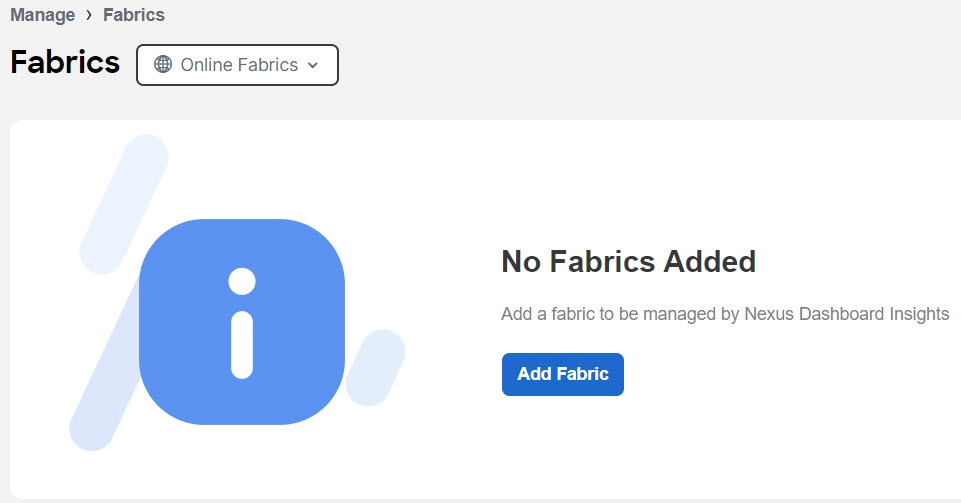
-
-
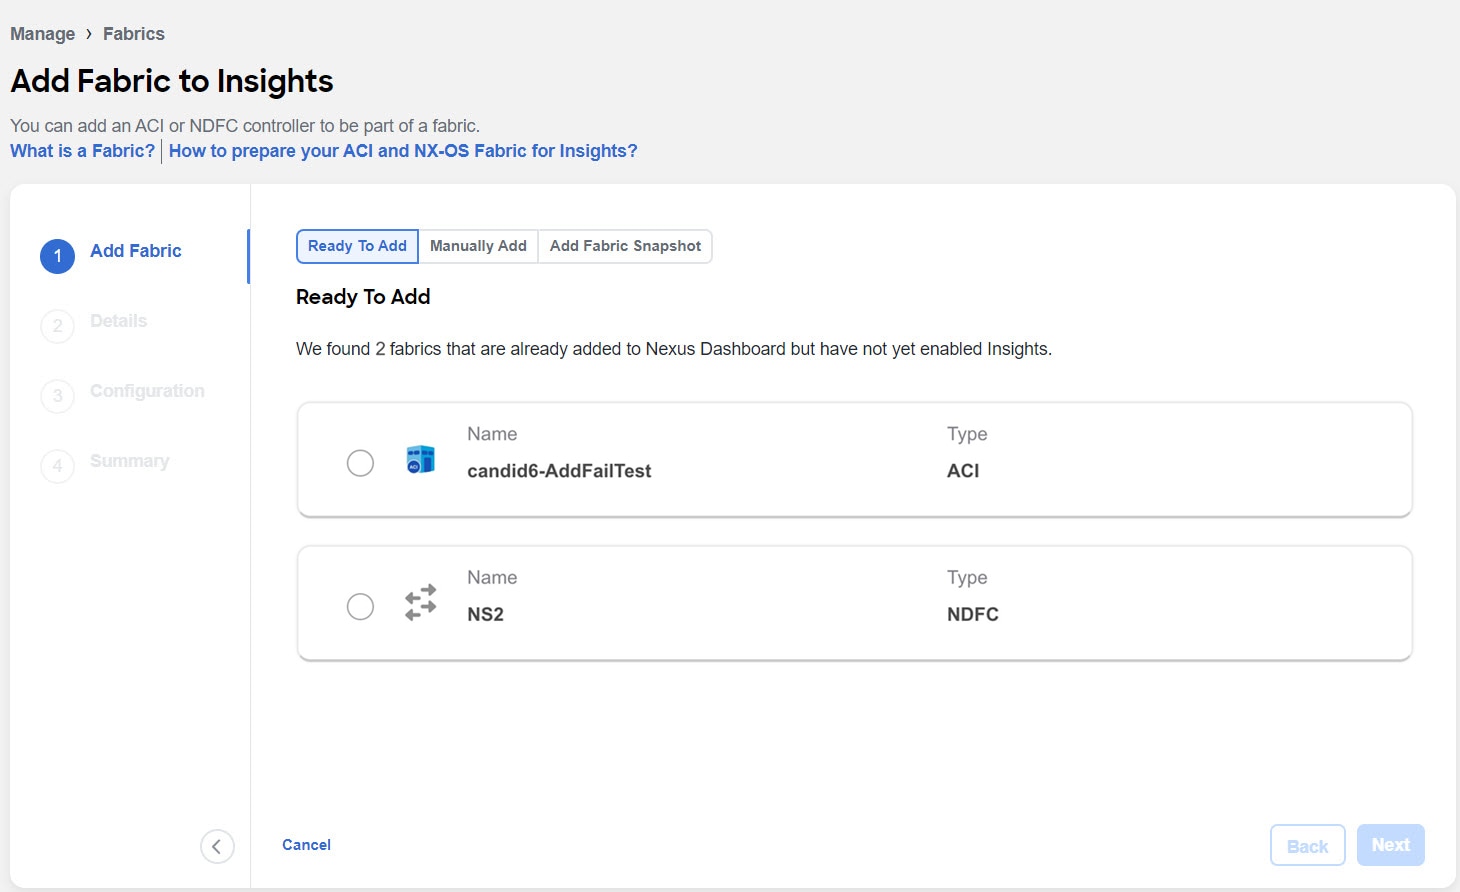
To enable a fabric that has been already added to Nexus Dashboard, choose Ready to Add. The fabrics added to Nexus Dashboard are displayed. To add a fabric to Nexus Dashboard, see Cisco Nexus Dashboard Fabrics Management.
-
Complete the following fields for Ready to Add.
-
Choose the NDFC fabric.
-
Click Next.
-
Click See on map and click the fabric location on the map to identify the fabric in the Admin Console.
-
Click Next.
-
In the User Name and Password field for Switch Credentials, provide the login credentials for a LAN user with
adminprivileges on the switch you are adding. -
For Insights Collector Configuration, use the toggle to choose IPv4 or IPv6 to onboard the fabric. Based on this setting, Nexus Dashboard Insights will configure its collector to receive telemetry from this fabric. This setting should match your fabrics IP address configuration.
-
For Telemetry Streaming Network, use the toggle to choose in-band management or out-of-band management.
-
For in-band management, in the VRF field, enter the VRF instance instance name associated with the loopback interfaces. This is the VRF instance instance that provides connectivity to the Nexus Dashboard in-band IP addresses.

Default and non-default VRF instance instances are supported. In VXLAN/EVPN fabrics they must be part of the underlay.
-
For in-band management, in the Loopback field, enter the loopback configured on the switches that provide connectivity to the Nexus Dashboard in-band IP address.
-
Click Add Switch Credentials to add switches to the list and specify their credentials only if the switch credentials do not match the default credentials provided above.
-
In the Switch Name field, enter the name for the switch.
-
In the Switch IP field, enter the IP address for the switch.
-
In the Switch Username field, enter the username for the switch.
-
In the Switch Password field, enter the password.
-
-
Check the check mark to complete to add your entries, and add additional switches as appropriate.
-
Click Next.
-
Verify the configuration.
-
Click Save.
-
-
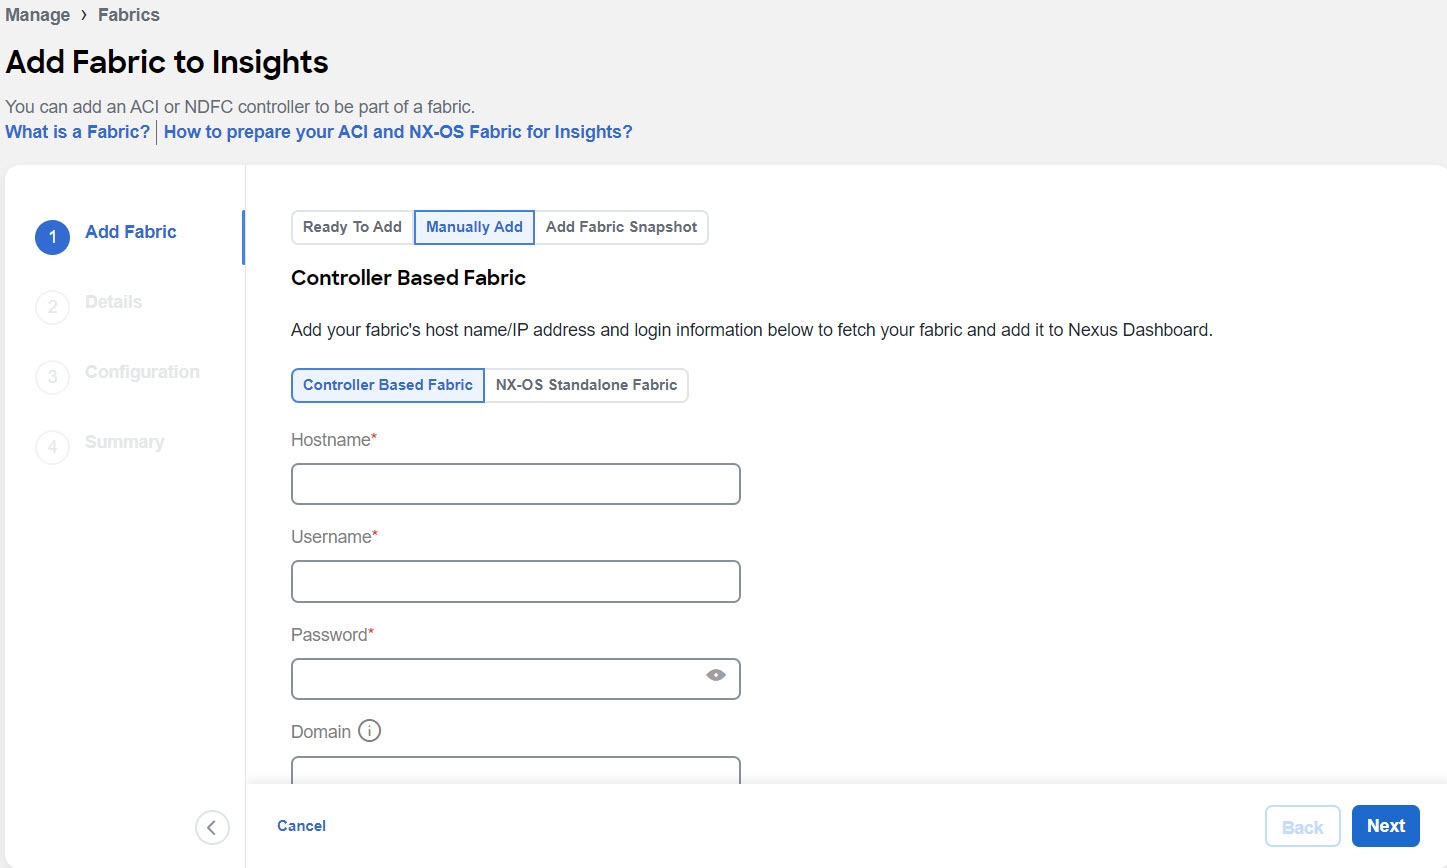
To add a fabric to Nexus Dashboard and then enable the fabric using Nexus Dashboard Insights, choose Manually Add.
-
Complete the following fields for Manually Add.
-
Choose Controller Based Fabric.
-
In the Hostname field, enter the IP address used to communicate with the fabric’s controller.
-
In the User Name and Password field, provide the login credentials for a user with
adminprivileges on the fabric you are adding. -
In the Domain field, enter the controller login domain name.
-
Click Next.
-
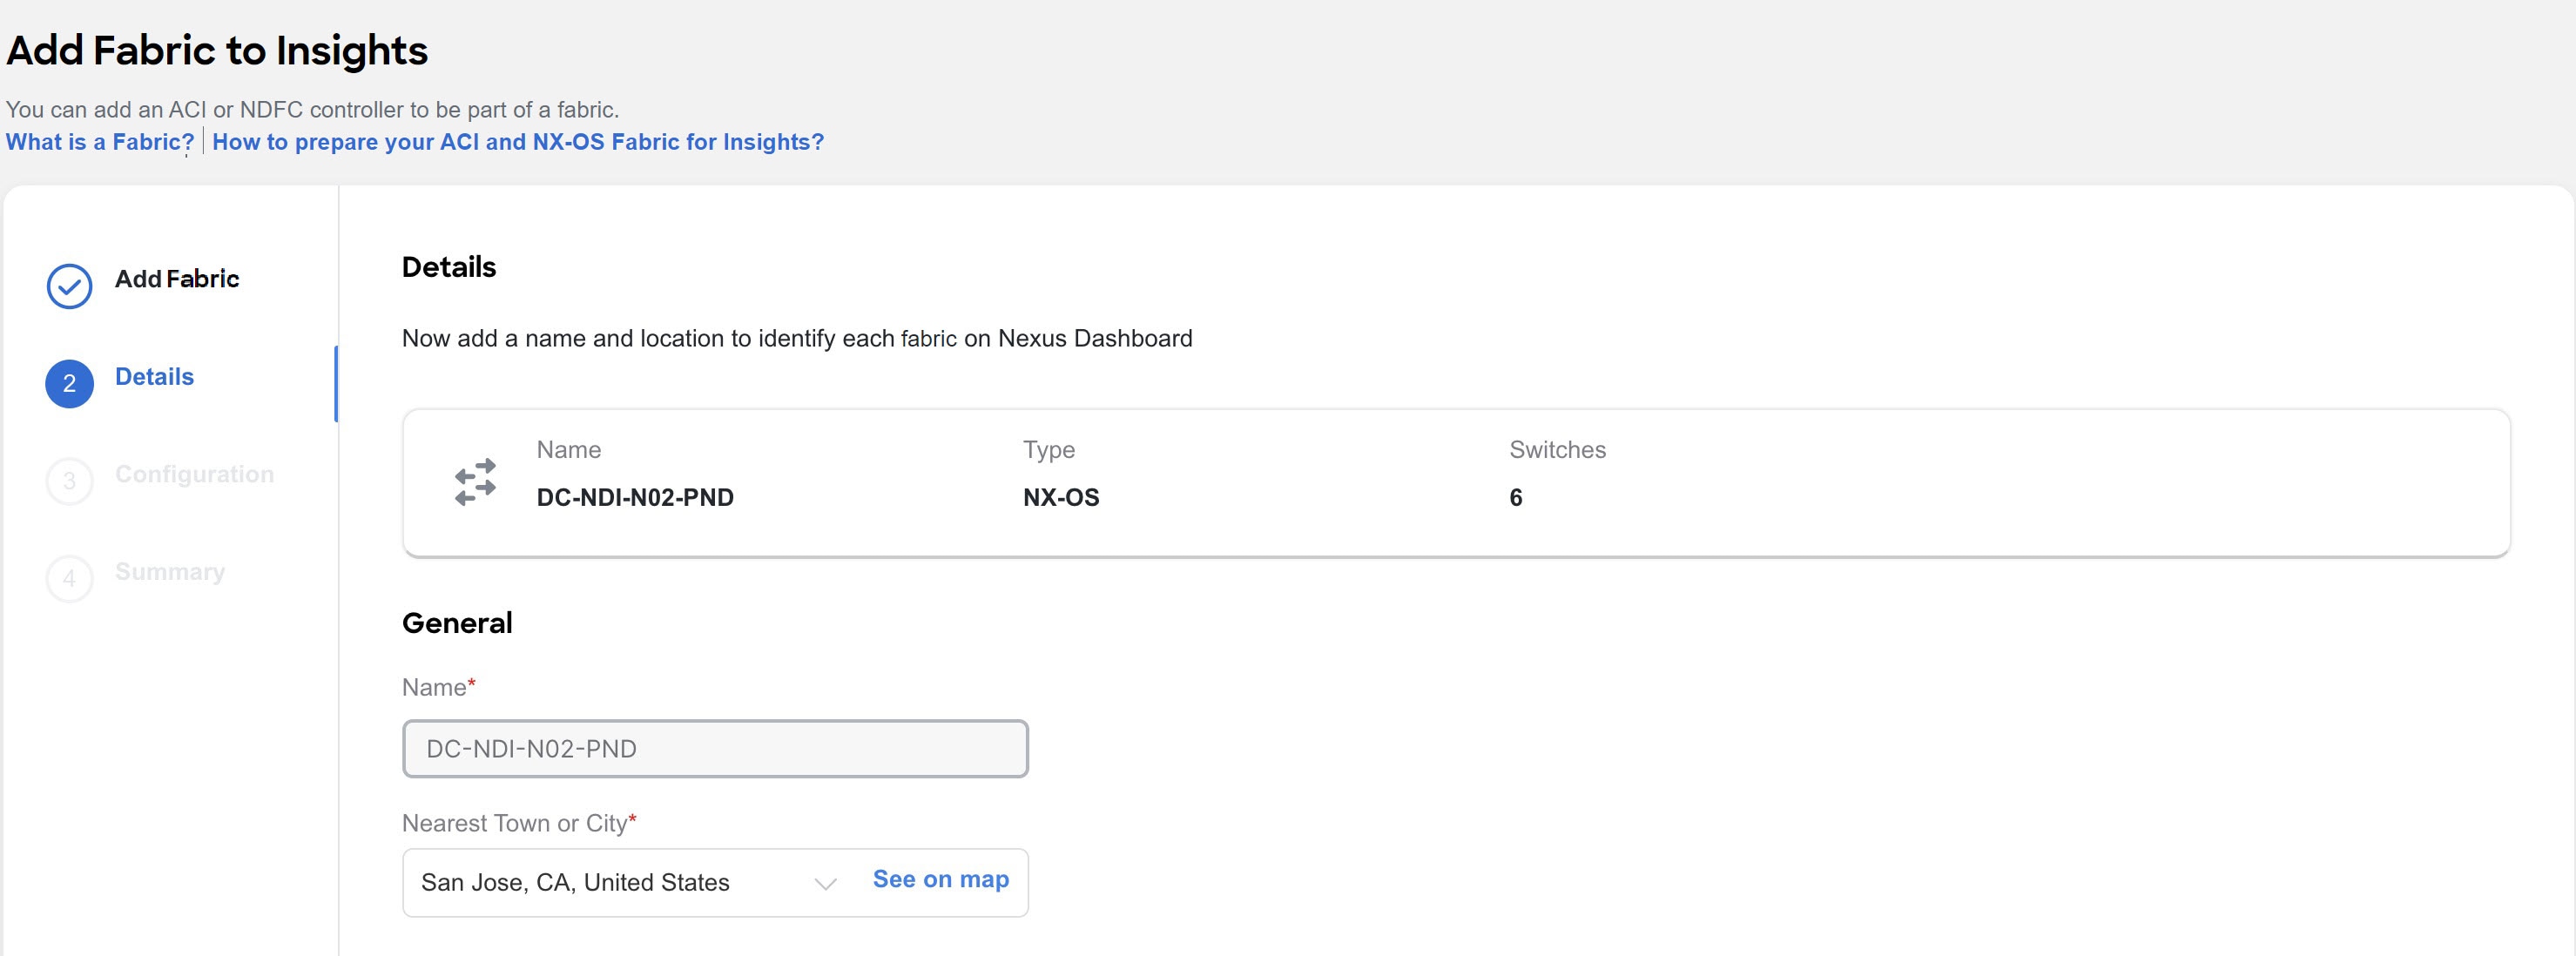
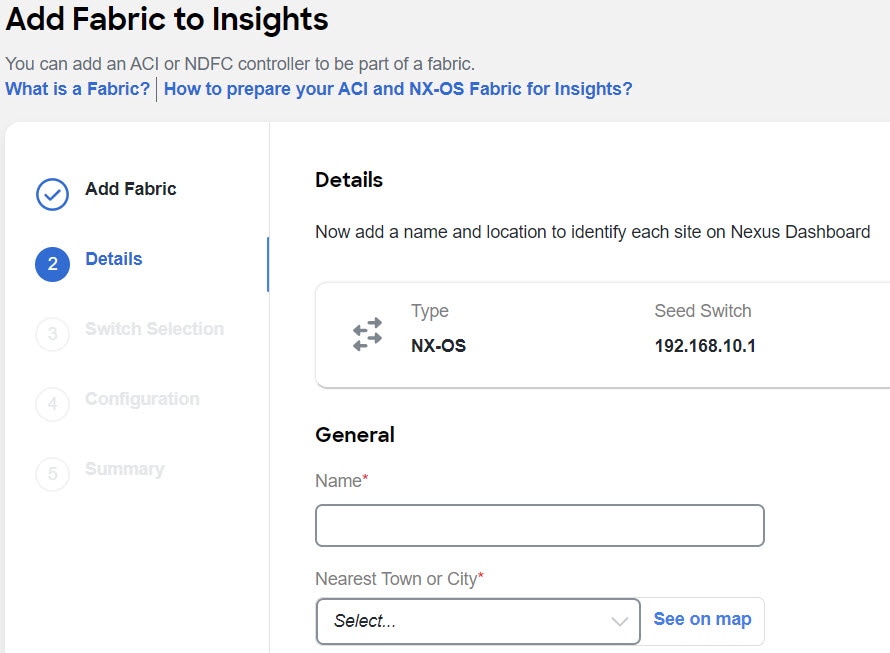
Enter the fabric name to identify the fabric on Nexus Dashboard.
-
Choose the fabric location from the map to identify the fabric on Nexus Dashboard.
-
Click Next.
-
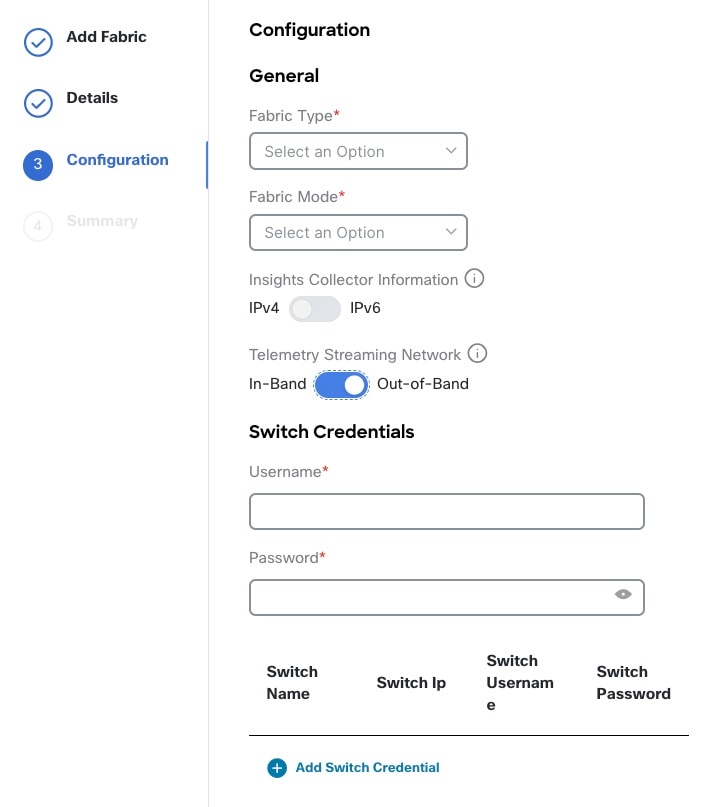
From the Fabric Type drop-down list, choose the fabric type. The options are Classic, VXLAN or SR-MPLS. Choose SR-MPLS option to set up flows for SR-MPLS in a NX-OS fabric. Enhanced Classic LAN is not supported for NDFC fabrics.
-
From the Fabric Mode drop-down menu, choose the fabric mode. The options are Managed or Monitored. In Managed mode, Nexus Dashboard Insights will deploy telemetry configuration to all switches in the fabric. In monitored mode, Nexus Dashboard Insights will not deploy telemetry configuration to all switches in the fabric.
-
For Insights Collector Configuration, use the toggle to choose IPv4 or IPv6 to onboard the fabric. Based on this setting, Nexus Dashboard Insights will configure its collector to receive telemetry from this fabric. This setting should match your fabrics IP address configuration.
-
In the Loopback field, enter the loopback configured on the switches that provide connectivity to the Nexus Dashboard in-band IP address.
-
In the VRF field, enter the VRF instance instance name associated with the loopback interfaces. This is the VRF instance instance that provides connectivity to the Nexus Dashboard in-band IP addresses.
Default and non-default VRF instance instances are supported. In VXLAN/EVPN fabrics they must be part of the underlay.
-
In the User Name and Password field for Switch Credentials, provide the login credentials for a LAN user with
adminprivileges on the switch you are adding. -
Click Add Switch Credentials to add switches to the list and specify their credentials only if the switch credentials do not match the default credentials provided above.
-
In the Switch Name field, enter the name for the switch.
-
In the Switch IP field, enter the IP address for the switch.
-
In the Switch Username field, enter the username for the switch.
-
In the Switch Password field, enter the password.
-
-
Check the check mark to complete to add your entries, and add additional switches as appropriate.
-
Click Next.
-
Verify the configuration.
-
Click Submit.
-
Add an online NX-OS fabric without a controller (standalone NX-OS fabric)
-
Navigate to Manage > Fabrics.
-
Click Add Fabric.
-
If you are adding a fabric in Nexus Dashboard Insights for the very first time, you will receive the following message. Click Add Fabric to proceed.
-
-
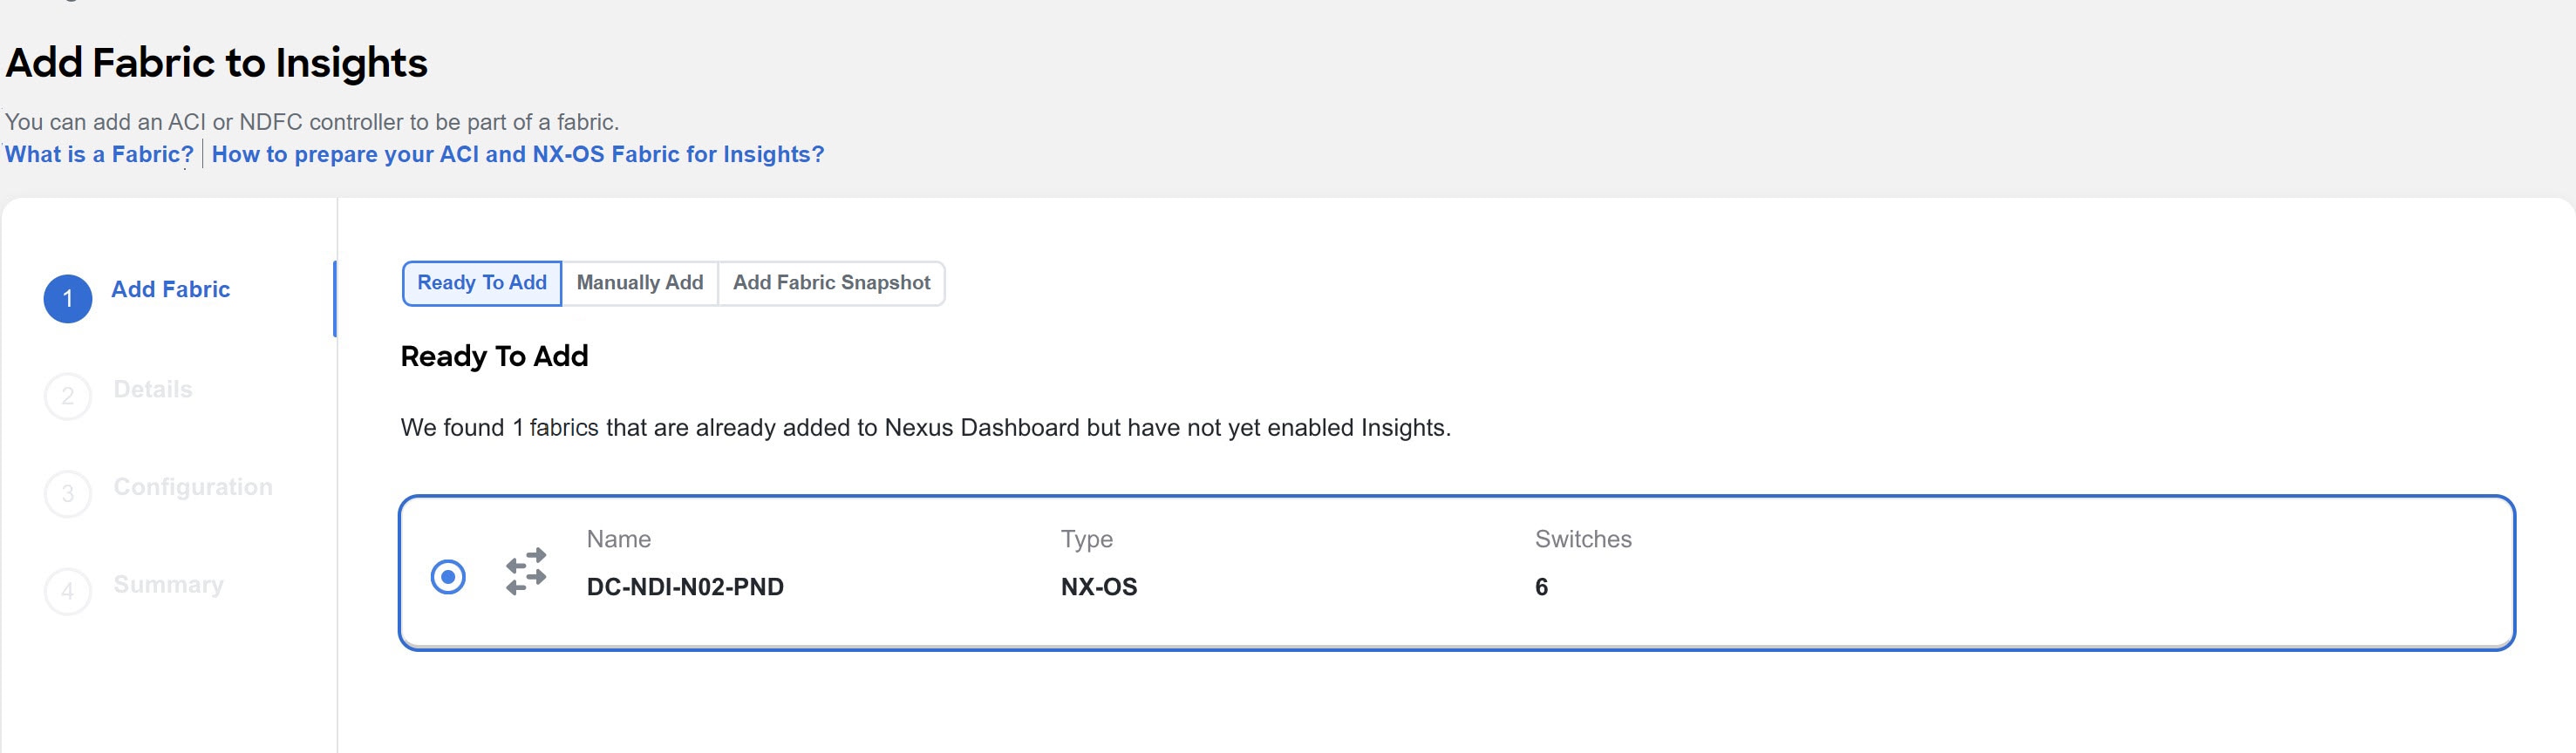
To enable a fabric that has been already added to Nexus Dashboard, choose Ready to Add. The fabrics added to Nexus Dashboard are displayed. To add a fabric to Nexus Dashboard, see Cisco Nexus Dashboard Fabrics Management.
-
Complete the following fields for Ready to Add.
-
Choose the NX-OS fabric.
-
Click Next.
-
Choose the fabric location from the map to identify the fabric on Nexus Dashboard.
-
Click Next.
-
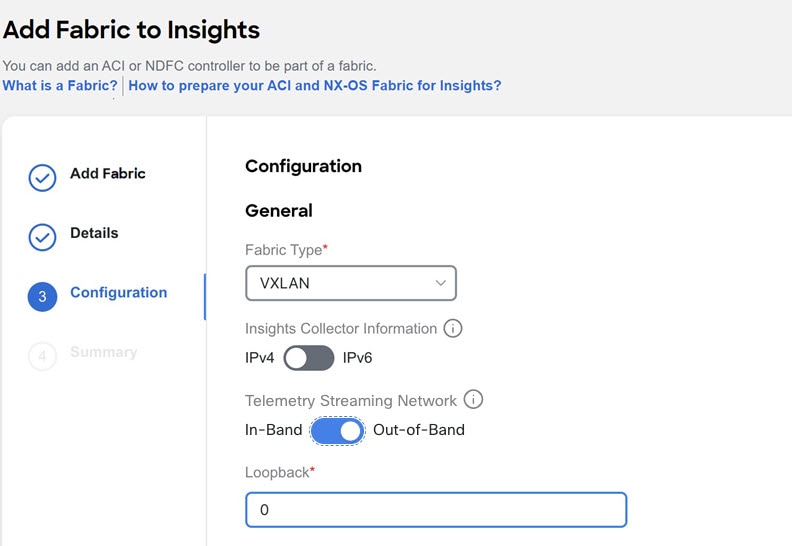
From the Fabric Type drop-down menu, choose the fabric type. The options are Classic, VXLAN or SR-MPLS. Choose SR-MPLS option to set up flows for SR-MPLS in a NX-OS fabric.
-
For Insights Collector Configuration, use the toggle to choose IPv4 or IPv6 to onboard the fabric. Based on this setting, Nexus Dashboard Insights will configure its collector to receive telemetry from this fabric. This setting should match your fabrics IP address configuration.
-
For Telemetry Streaming Network, use the toggle to choose in-band management or out-of-band management.
-
For in-band management, in the VRF field, enter the VRF instance instance name associated with the loopback interfaces. This is the VRF instance instance that provides connectivity to the Nexus Dashboard in-band IP addresses.
Default and non-default VRF instance instances are supported. In VXLAN/EVPN fabrics they must be part of the underlay.
-
For in-band management, in the Loopback field, enter the loopback configured on the switches that provide connectivity to the Nexus Dashboard in-band IP address.
-
Click Next.
-
Verify the configuration.
-
Click Submit.
-
-
To add a fabric to Nexus Dashboard and then enable the fabric using Nexus Dashboard Insights, choose Manually Add.
-
Complete the following fields for Manually Add.
-
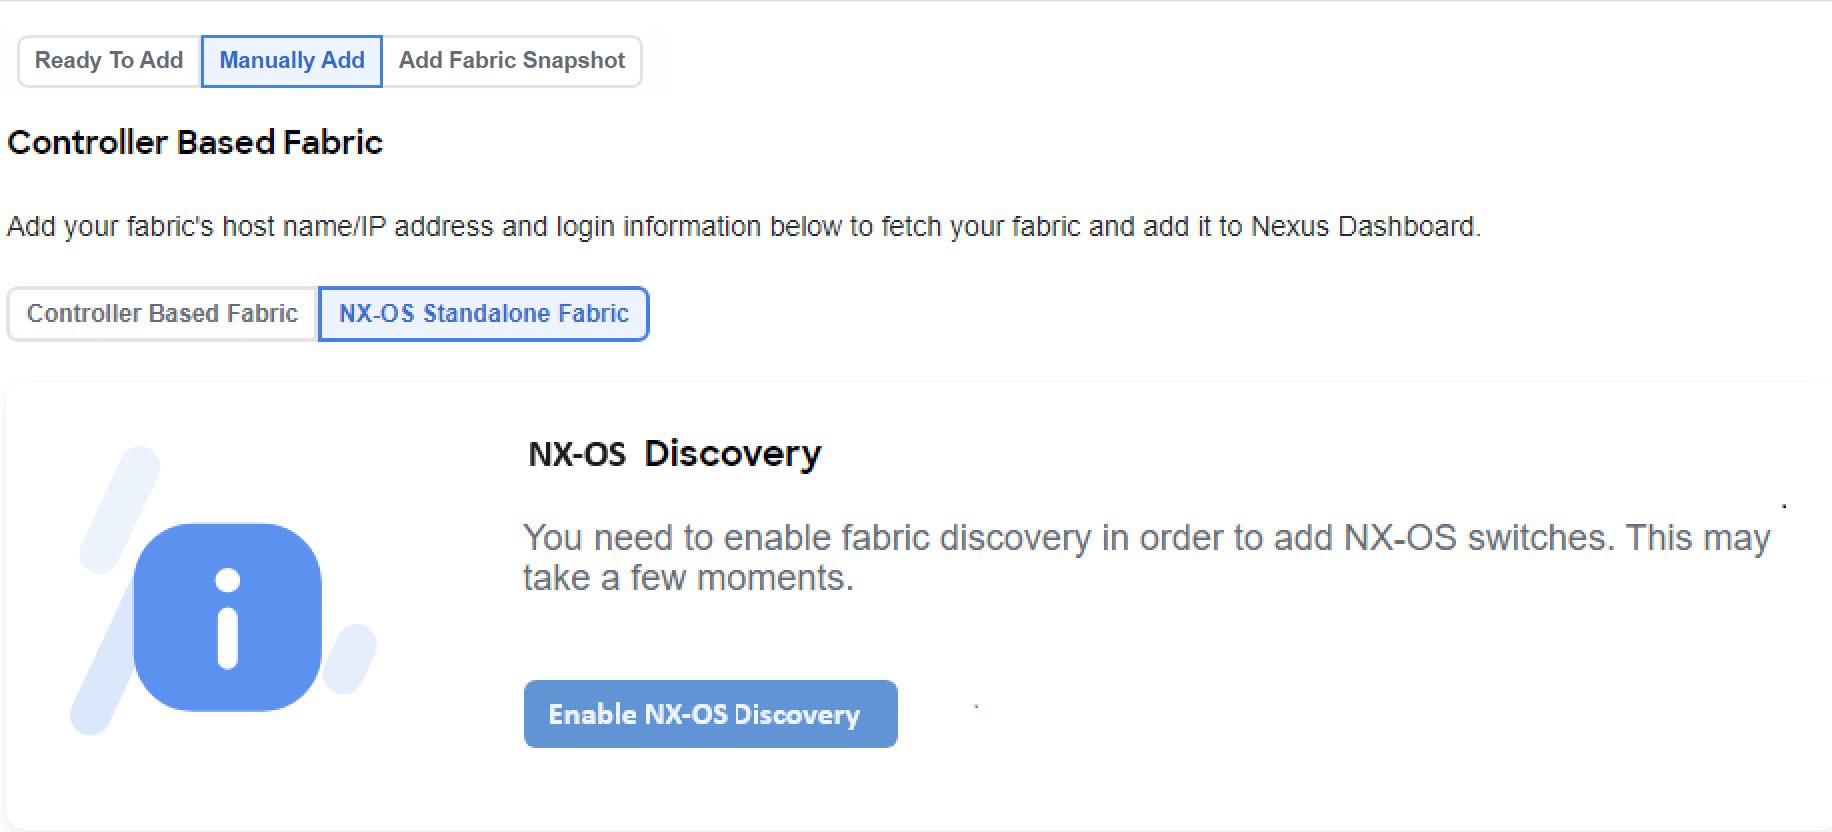
Choose NX-OS Standalone Fabric.
-
Click Enable NX-OS Discovery to enable NX-OS Discovery in Nexus Dashboard’s Admin Console.
-
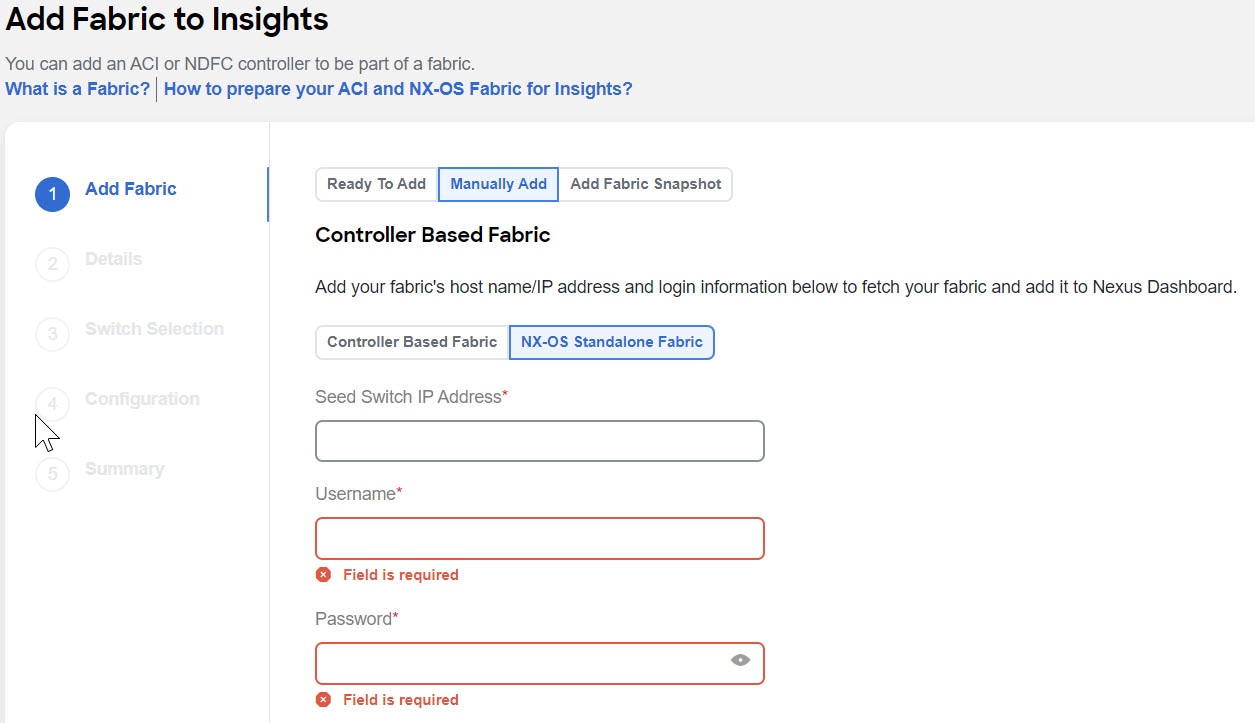
In the Seed Switch IP Address field, enter the IP address of the seed switch management interface.
-
In the User Name and Password field, provide the login credentials for a user with
adminprivileges on the switch you are adding. -
From the Authentication Protocol drop-down list, choose the protocol.
-
Click Next.
-
Enter the NX-OS fabric name to identify the fabric on Nexus Dashboard.
-
Choose the NX-OS fabric location from the map to identify the fabric on Nexus Dashboard.
-
Choose the switches to be added to the fabric.
-
Click Next.
-
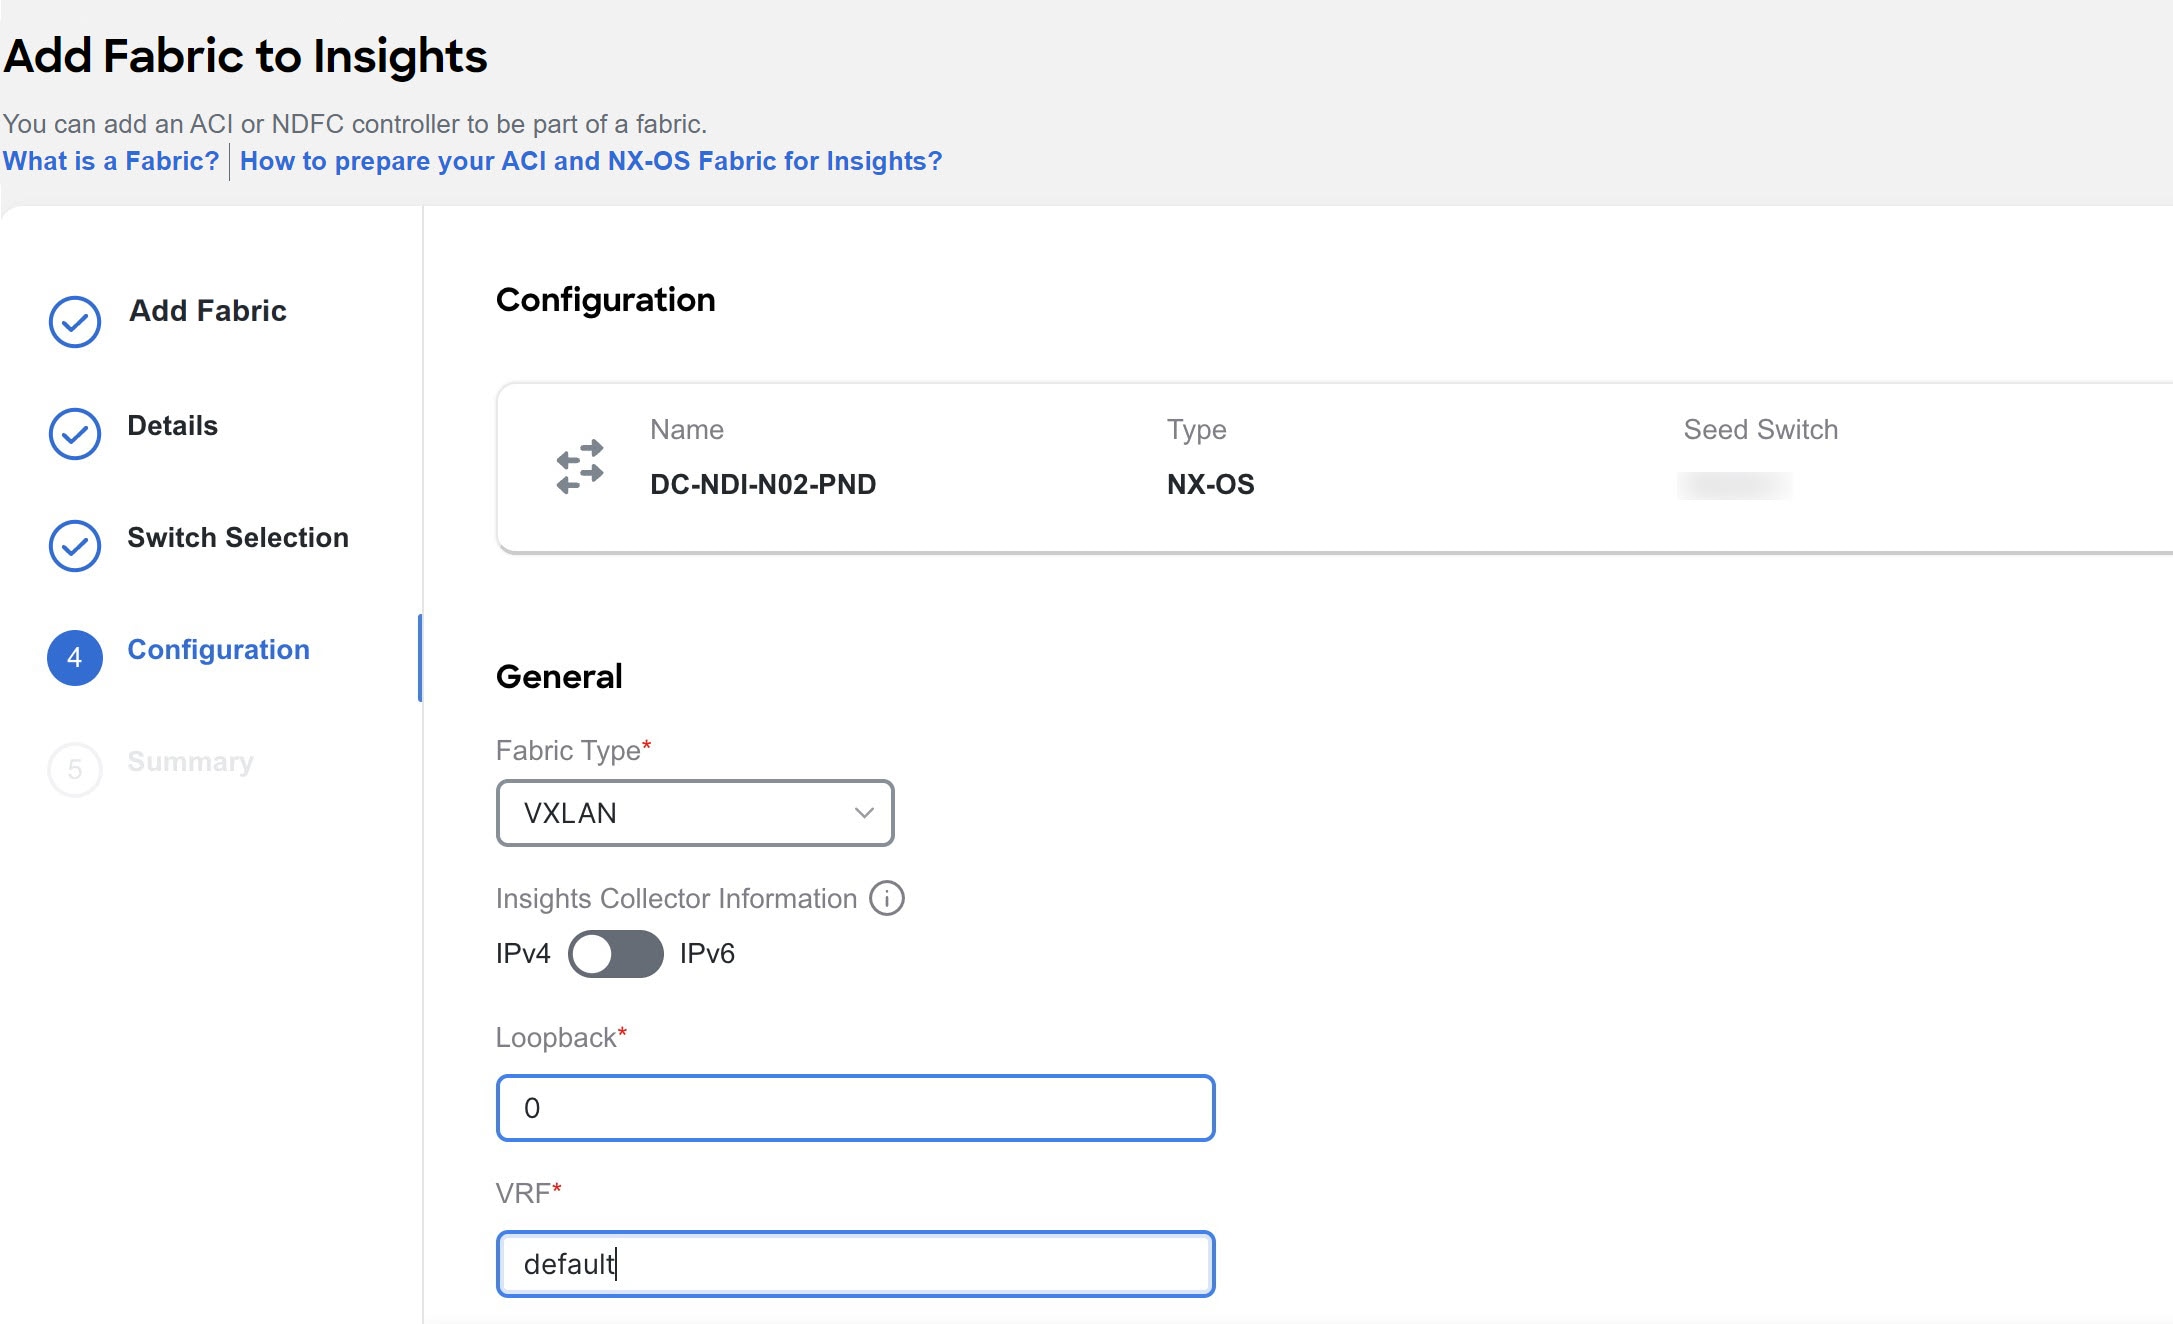
From the Fabric Type drop-down menu, choose the fabric type. The options are Classic, VXLAN or SR-MPLS. Choose SR-MPLS option to set up flows for SR-MPLS in a NX-OS fabric.
-
For Insights Collector Configuration, use the toggle to choose IPv4 or IPv6 to onboard the fabric. Based on this setting, Nexus Dashboard Insights will configure its collector to receive telemetry from this fabric. This setting should match your fabrics IP address configuration.
-
In the Loopback field, enter the loopback configured on the switches that provide connectivity to the Nexus Dashboard in-band IP address.
-
In the VRF field, enter the VRF instance name associated with the loopback interfaces. This is the VRF instance that provides connectivity to the Nexus Dashboard in-band IP addresses.
Default and non-default VRF instances are supported. In VXLAN/EVPN fabrics they must be part of the underlay.
-
Click Next.
-
Verify the configuration.
-
Click Submit.
-
Add a snapshot fabric
-
Navigate to Manage > Fabrics.
-
Click Add Fabric.
-
To add a snapshot fabric, choose Add Fabric Snapshot.
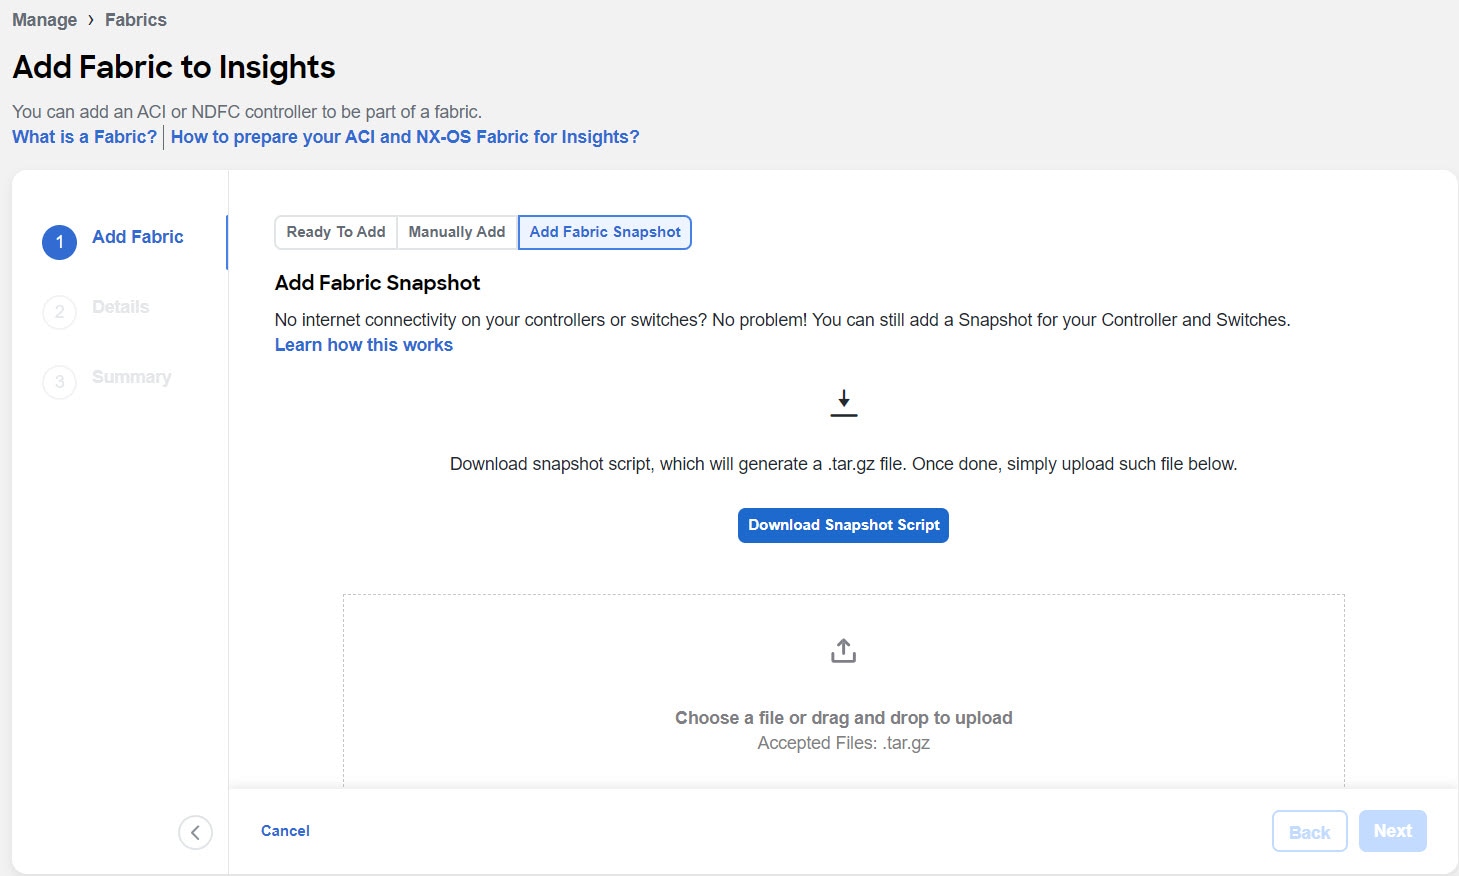
-
Click Download Snapshot Script to download the
data-collectors.tar.gzto your machine. -
Extract the file you downloaded and run the data collection script. Follow the instructions provided in the readme.md file. After the script is completed successfully, the data is collected in a
<filename>.tar.gzfile.
The collection script requires that you have Python3 installed on your system.
-
Upload the file in Nexus Dashboard Insights and click Next.
-
Enter the fabric name to identify the fabric on Nexus Dashboard.
-
Choose the fabric location from the map to identify the fabric on Nexus Dashboard.
-
Click Next.
-
Verify the configuration.
-
Click Submit.
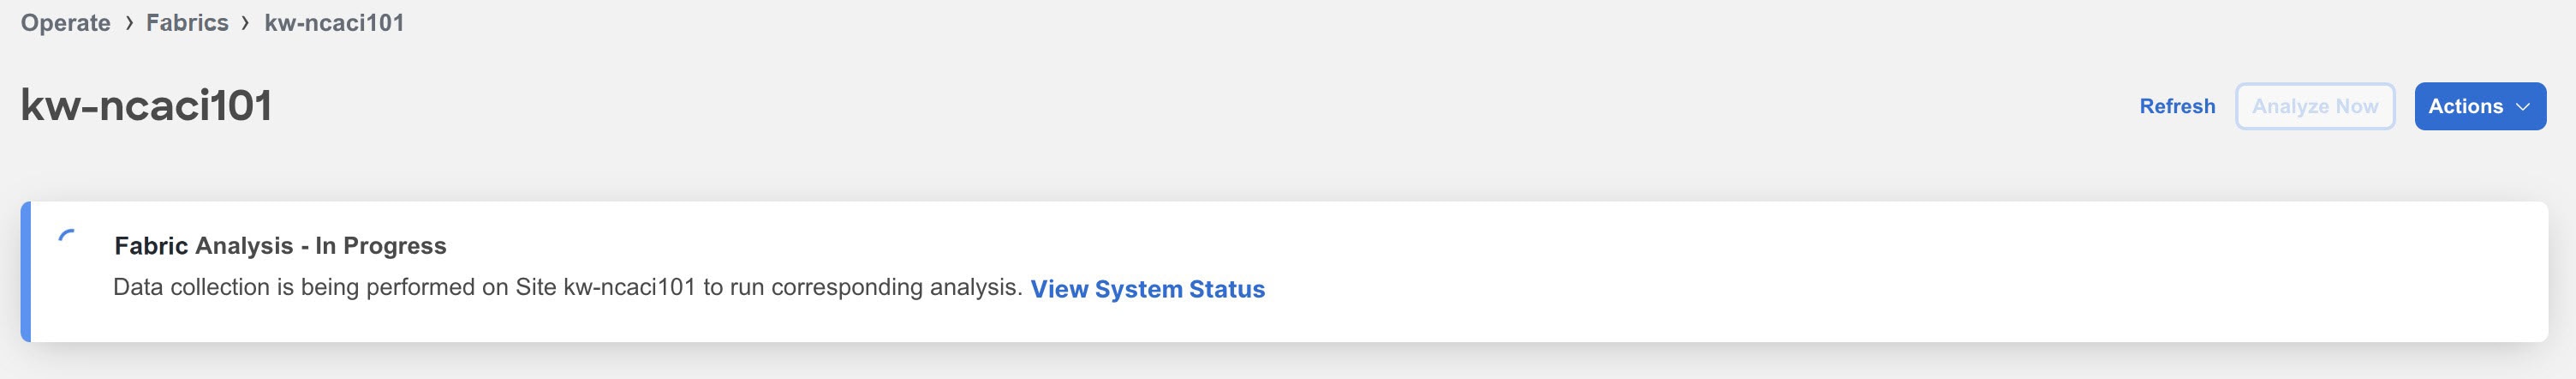
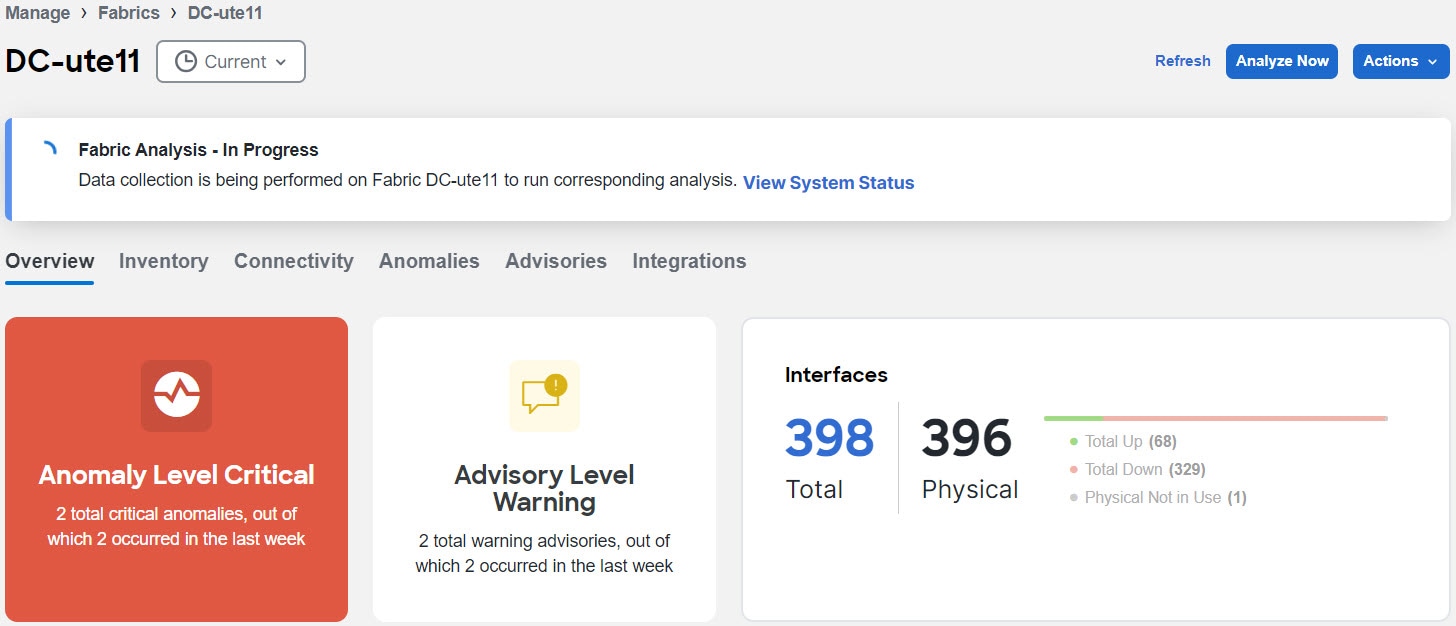
After your fabric is onboarded and fully prepared, Nexus Dashboard Insights will start the analysis to collect data from your fabric and display the fabric information in the Fabrics page. See Fabric Details. The Fabric Analysis banner displays the progress of the analysis. The time to run the analysis depends on the size of the fabric.
Fabric Details
In Nexus Dashboard Insights, Global View provides bird’s eye view of your global network infrastructure for all your fabrics. The Fabrics page provides the details for an individual fabric.
Fabric Details in Global View
After you add the first fabric, Global View gives you a bird’s eye view of your global network infrastructure for all your fabrics, their locations, and the key health metrics.
Navigate to Overview > Global View.
The map visually shows the physical location and total number of your fabrics in each continent, and their names. Click a fabric to jump directly to the details for that fabric, or scroll down to the Fabrics area to navigate to your fabric. You can also use the the zoom control icons in the page to change your view of the map.
See an at-a-glance summary for each individual fabric in the Fabrics area. It includes their anomaly and advisory health levels, fabric-external traffic with total data transferred, and connectivity data for endpoints and Layer 3 neighbors. To learn about fabrics in Global View, see Journey and Global View.
Individual Fabric Details
In the Fabrics page, you can dive into the details for an individual fabric, switch, or interface, with a comprehensive dashboard, simple topology, per-device summaries and more. You can also manage anomalies and advisories at a fabric level.
-
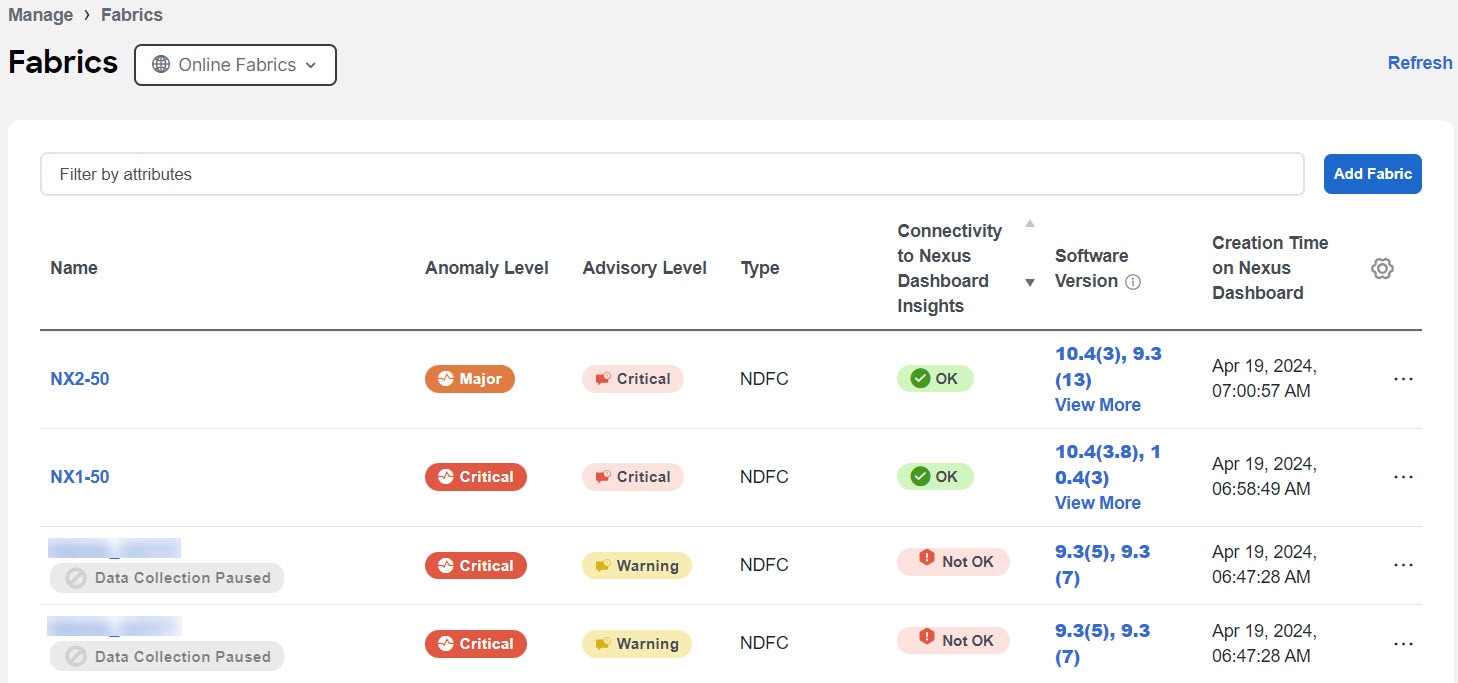
Navigate to Manage > Fabrics.
-
Choose Online or Snapshot fabrics from the drop-down list.
-
Use the search bar to filter the fabrics. The Fabrics table, displays the fabric type, connectivity status, anomaly and advisory level, onboarding time.
-
Click the fabric name to view details for your fabric. From the Time Selection drop-down menu choose the time. All sections will show data based on time selection and data availability. By default, the current time is selected.
-
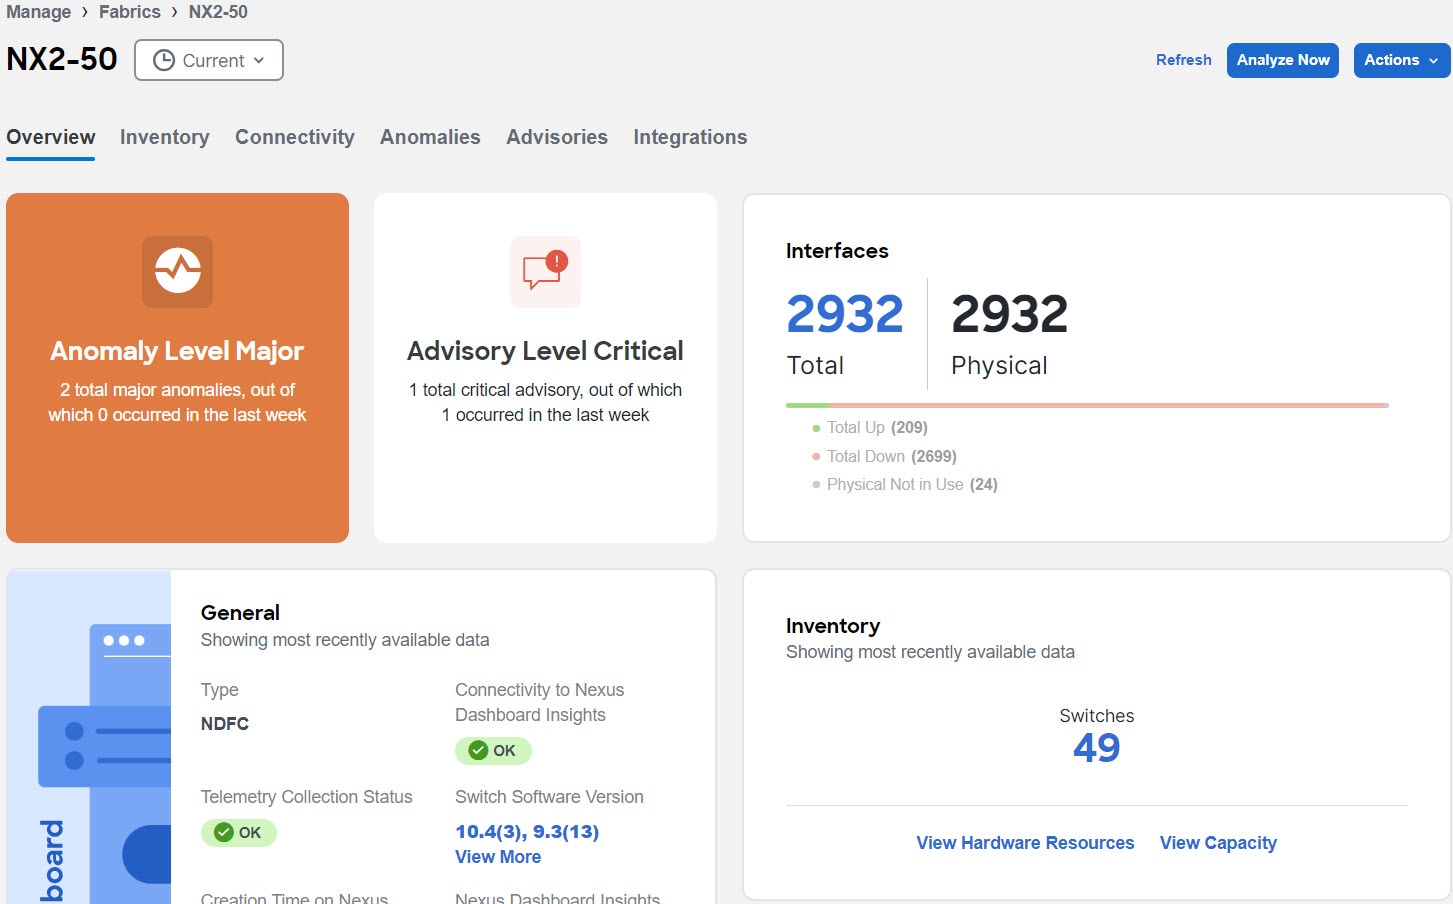
Click Overview.
-
In the The Anomaly and Advisory area you can view the status of your anomaly and advisory levels, and a list of your top anomaly and advisory categories.
-
Click Anomaly to view the level, category, and count for your anomalies for the fabric.
-
Click the anomaly name to view additional details.
-
Click Advisory to view the level, category, and count for your advisories for the fabric.
-
Click the advisory name to view additional details.
-
-
The General area shows you the type of fabric, the software version used, the connectivity status to Nexus Dashboard, conformance status, onboarding time, telemetry status, and Traffic Analytics status. You can see Traffic Analytics status if you have enabled Traffic Analytics in Flow Collection. See Traffic Analytics. In the General area hover on the software version and click View Bugs to view the active and susceptible bugs for that fabric. See Getting Started.
Telemetry collection status provides insights into the health and performance of the switches and devices in your network. The different telemetry collection statuses at the fabric level include:
-
OK - This status indicates that the telemetry data streaming from all the switches to Nexus Dashboard Insights is functioning correctly. This is the desired state, as it ensures comprehensive monitoring and visibility into the network’s performance.
-
Not OK - This status indicates the telemetry data streaming from all the switches to Nexus Dashboard Insights is not functioning correctly. This could be as a result of various problems such as network outages, misconfigurations, or hardware failures.
-
Partial OK - This status indicates that telemetry data streaming from all the switches to Nexus Dashboard Insights is not functioning correctly from some of the switches but it is functioning correctly from others. This suggests an inconsistent or partial telemetry data flow within the network which could be caused by various factors, such as switch-specific issues or misconfigurations on some switches.
-
-
In the Analytics Summary area, you can see an overview of the multiple analytics collected from across the fabric. It displays the status for conformance, congestion score, sustainability and traffic analytics. For Inventory you can view only congestion score under Analytics Summary.
-
In the External Traffic area, you can see the External Traffic that the fabric has sent and received in the last 7 days. The donut helps view the how much traffic is sent and received by the fabric. Click the information icon to view more information about what External Traffic is and how it can be measured for the different types of fabrics.
-
In the Interfaces area, you can see the summary of the interfaces for the fabric. Click Total to view additional details such as Anomaly Level, Admin Status, Operational Status, and Interface Type. Click the interface name to view additional details.
-
In the Connectivity area, you can view details about your endpoints, and L3 neighbors.
-
In the Inventory area, you can view the summary of the controllers and switches for the fabric.
-
Click View Hardware Resources to view the hardware resources for the fabric. Click and choose a resource from the Top Devices By drop-down list to see a graph for that resource. In the table that follows, see the resource usage by switch. Click the switch name to view additional details.
-
Click View Capacity to view the different resources with their maximum capacity and current usage. Fabric Summary shows you the trends for the week, as well as the capacity by resource for the entire fabric. You see the number of resources used out of the total available capacity for each resource in this fabric (for example, Bridge Domains 2829 of 15000). The percentage indicates the percentage of resource used. The Switch Summary displays the capacity breakout of resources by switch. The graph shows you the timeline for the parameter that you have chosen from the Top Switches By drop-down list. In the table, click Operational Resources, Configuration Resources, or Hardware Resources, to see the capacity and usage for each switch in the fabric.
-
-
-
Click Inventory to view the the controllers and switches information for the fabric. To learn more, see Inventory.
-
Click Connectivity to view the details of interfaces, endpoints, L3 neighbors, vPC Domains, flows for the fabric. To learn more, see Inventory. You can also view Multicast Route details for a fabric. See Multicast Routes.
-
Click Anomalies to view all the anomalies for the fabric. To learn more, see Anomalies and Advisories.
-
Click Advisories to view all the advisories for the fabric. To learn more, see Anomalies and Advisories.
-
Click Integrations to view all the integrations associated with the fabric. To learn more, see Integrations.
-
Click File History to view he history of files that are attached to the snapshot fabric. It shows the file name, the file size, when the file was uploaded, upload status, and when the last analysis was run.
File History is displayed only for snapshot fabrics.
-
For the currently active snapshot, which is the latest file that you uploaded, you can click Run Analysis to run the same snapshot analysis again. This can be useful when additional features are added and you want to re-run an analysis so that the additional features are included in your analysis.
-
You can also upload a snapshot file for the same fabric at a different time interval. Click Upload File to upload the file and then click Run Analysis to run the snapshot analysis.
-
Multicast Routes
In the multicast dashboard, you can view the following multicast route information for an NDFC fabric:
-
Top groups by traffic
-
Top groups by receivers
Prerequisites for multicast routes
Execute the following commands on the Nexus switch:
switch(config)# hardware profile multicast flex-stats-enable

switch(config)# multicast flow-path export

switch(config)# copy running-config startup-config

switch(config)# reload
You must execute the commands copy running-config startup-config and reload for the changes to take effect.
Guidelines and limitations for multicast routes
-
Multicast routing analytics is supported on Cisco NX-OS release 10.4(1)F and later for VXLAN and 10.3(3)F and later for classic LAN.
-
Multicast routing analytics is supported for Classic VLAN and VXLAN fabrics.
-
Multicast routing analytics is only supported for IPv4 addresses.
-
Supported scale limits per fabric: 2000 multicast groups, 16000 S,G entries, 8K routed interfaces.
-
When First Hop Router for multicast or the multicast source is configured outside the fabric, multicast routes are not displayed in the GUI.
View multicast routes
-
Navigate to Manage > Fabrics.
-
Choose Online Fabrics or Snapshot Fabrics from the drop-down list.
-
Click the fabric name to view the fabric details.
-
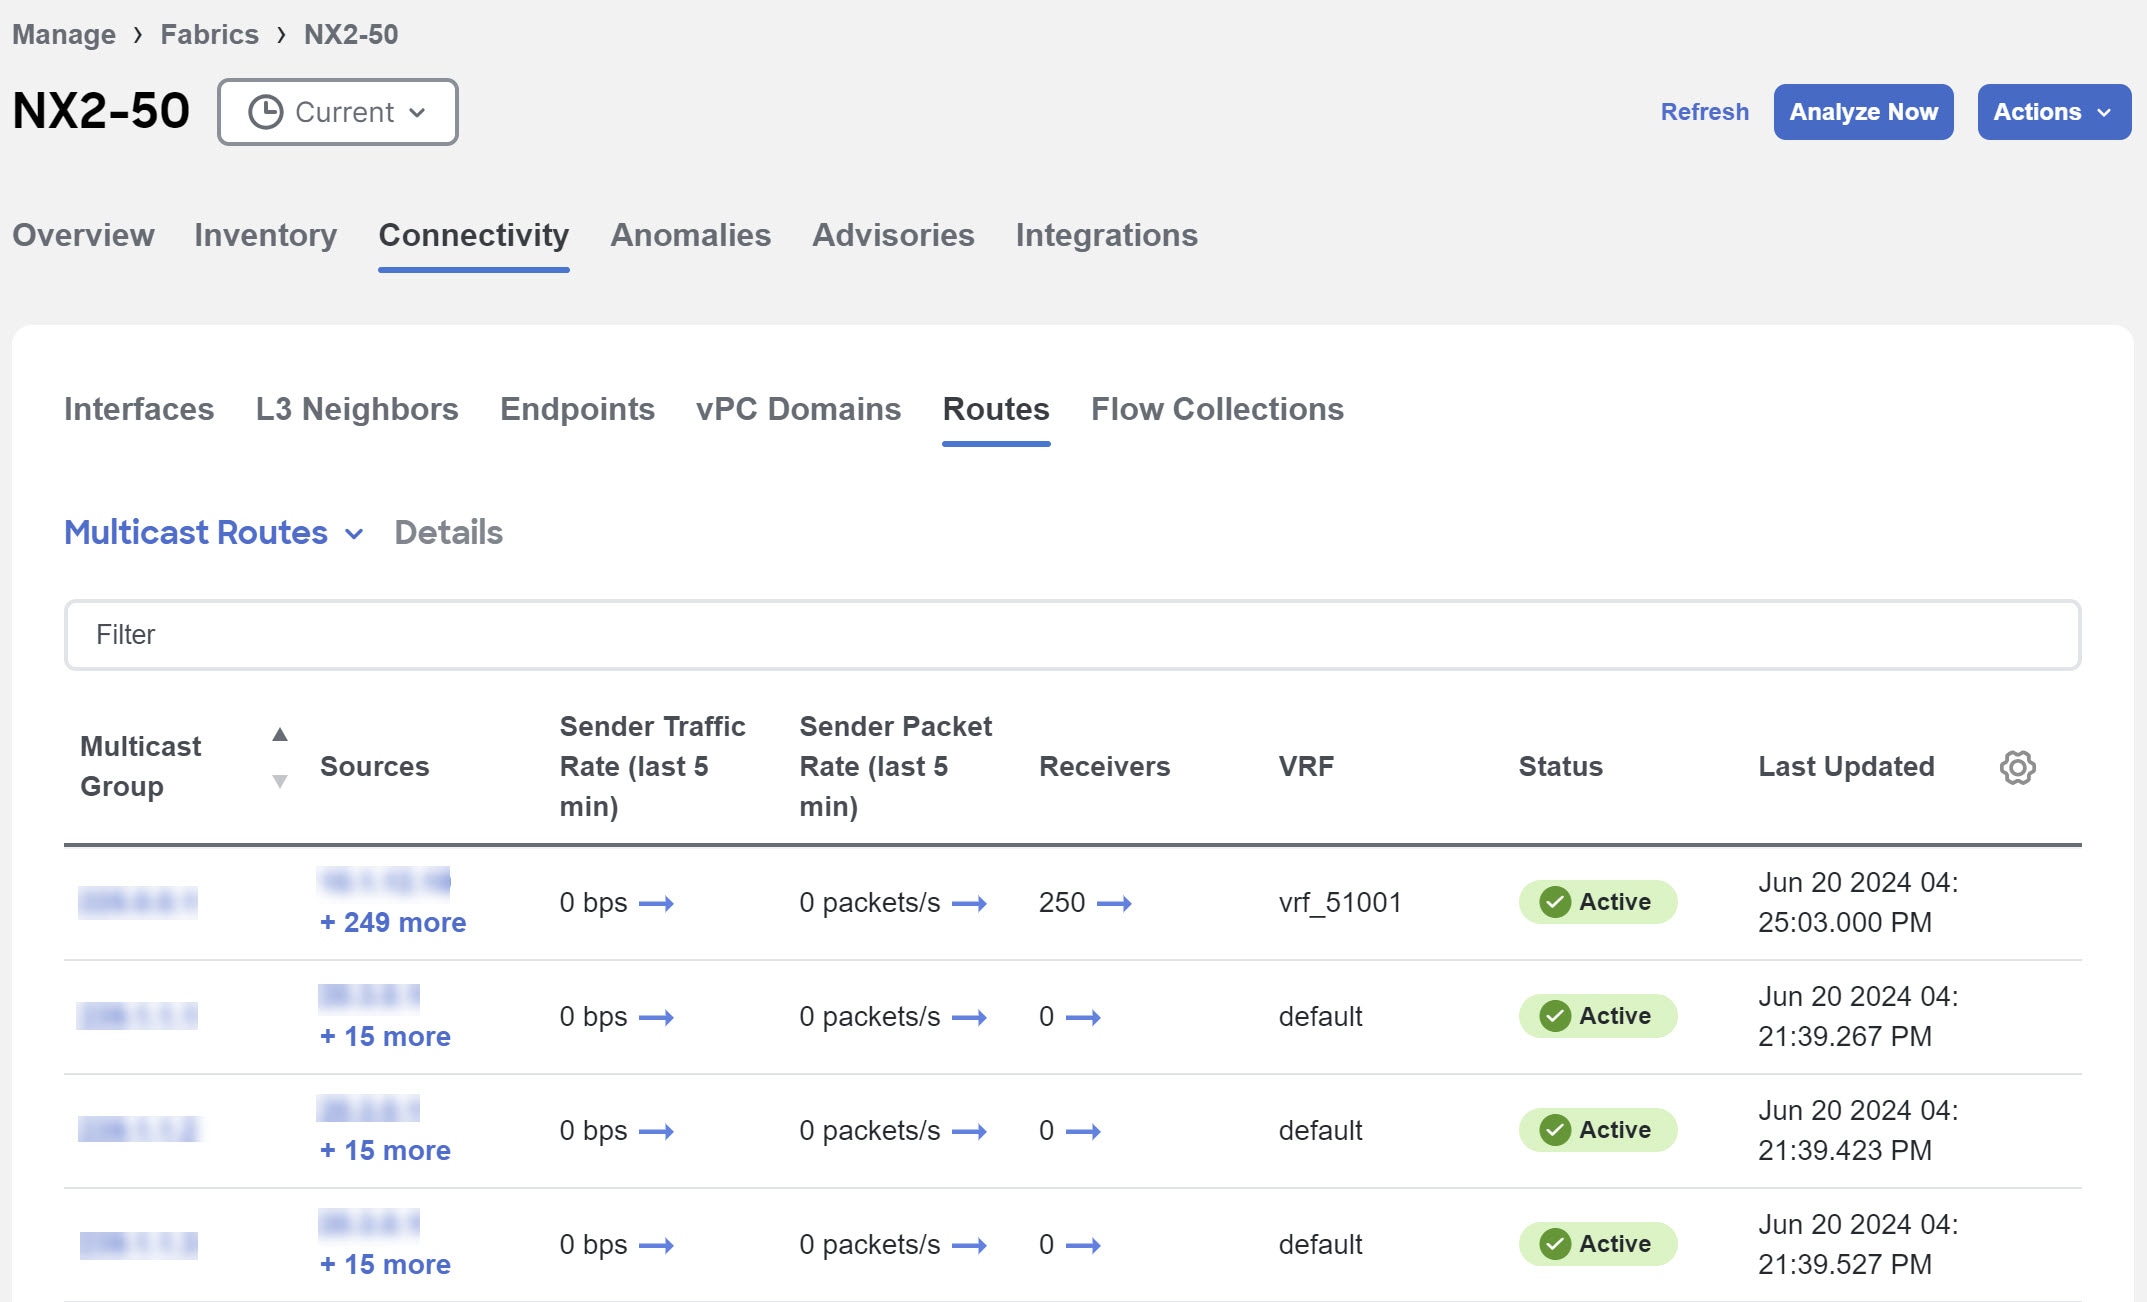
Choose Connectivity > Routes.
-
In the Details drop-down menu, choose Multicast Routes.
-
In the Multicast page, you can view the information such as multicast groups, sources sending to this group, sending rate per source, number of receivers for this group, and VRF instances.
-
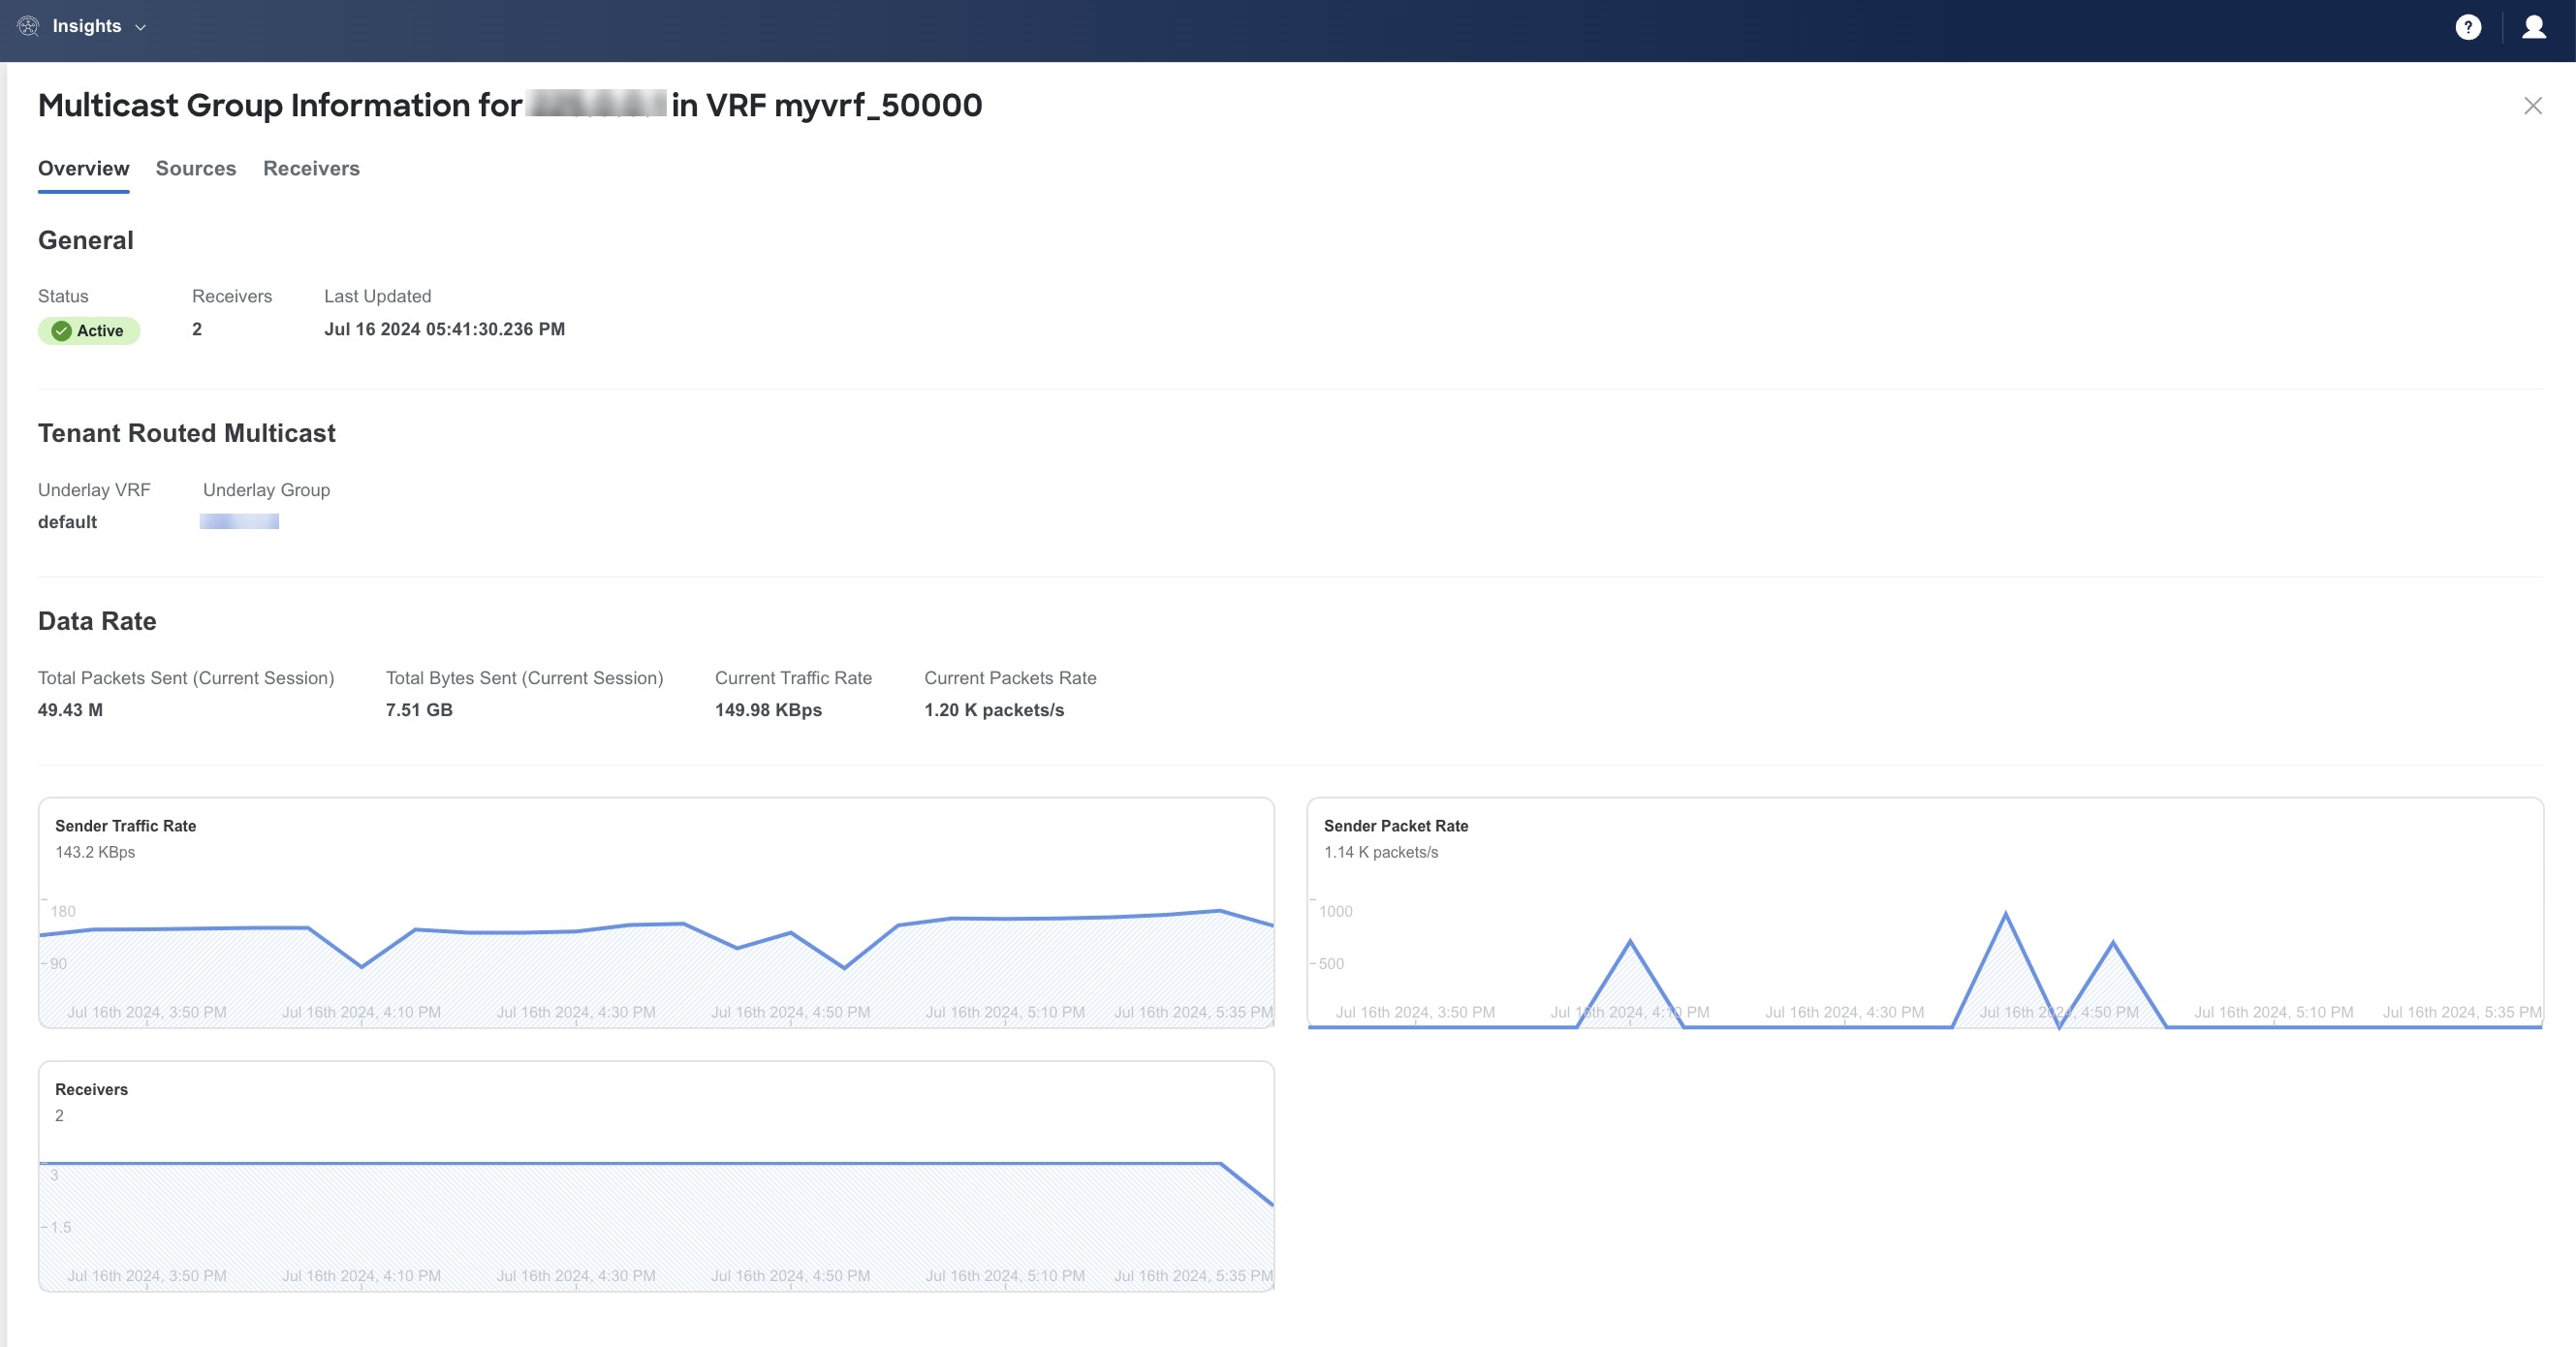
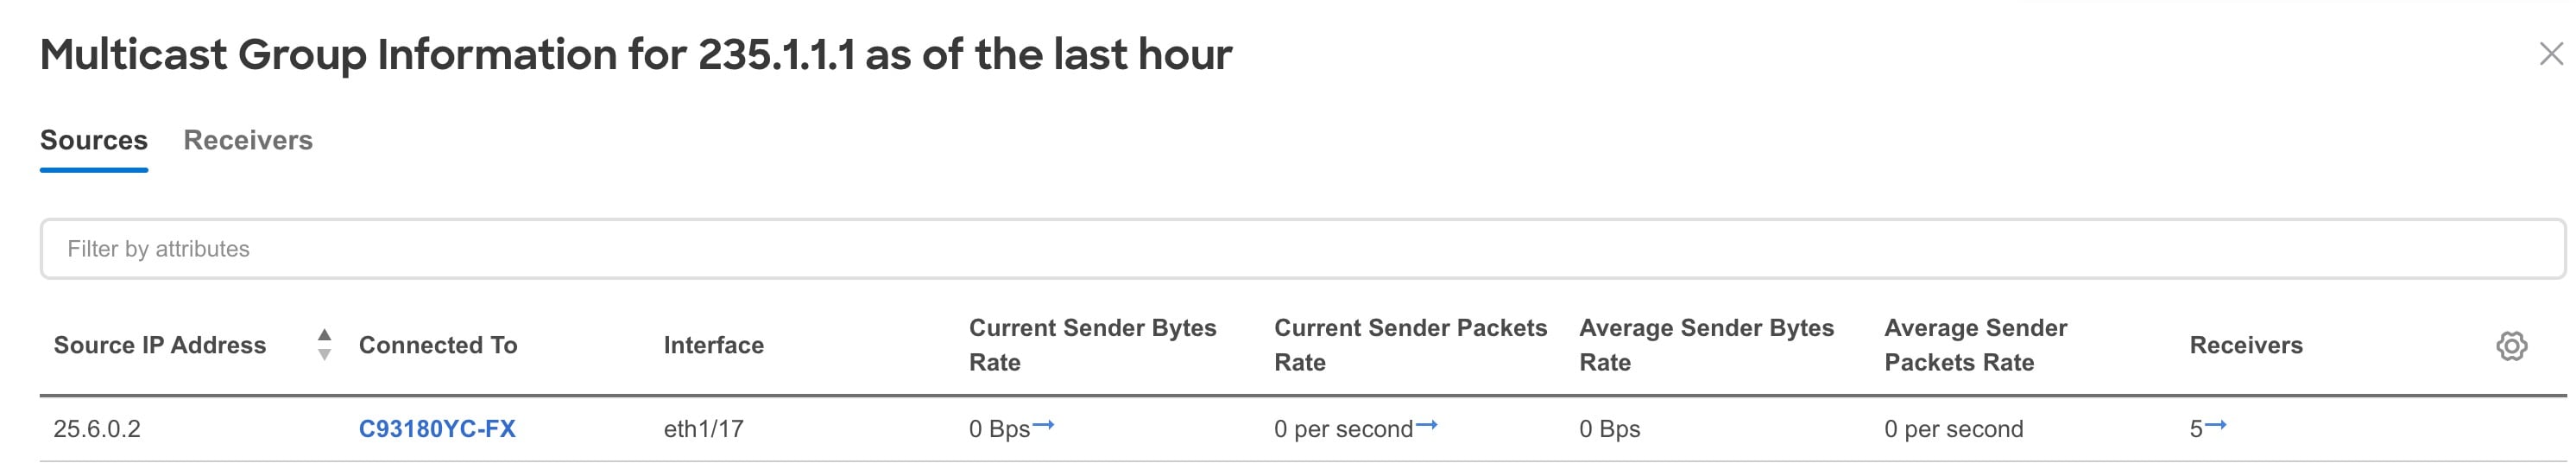
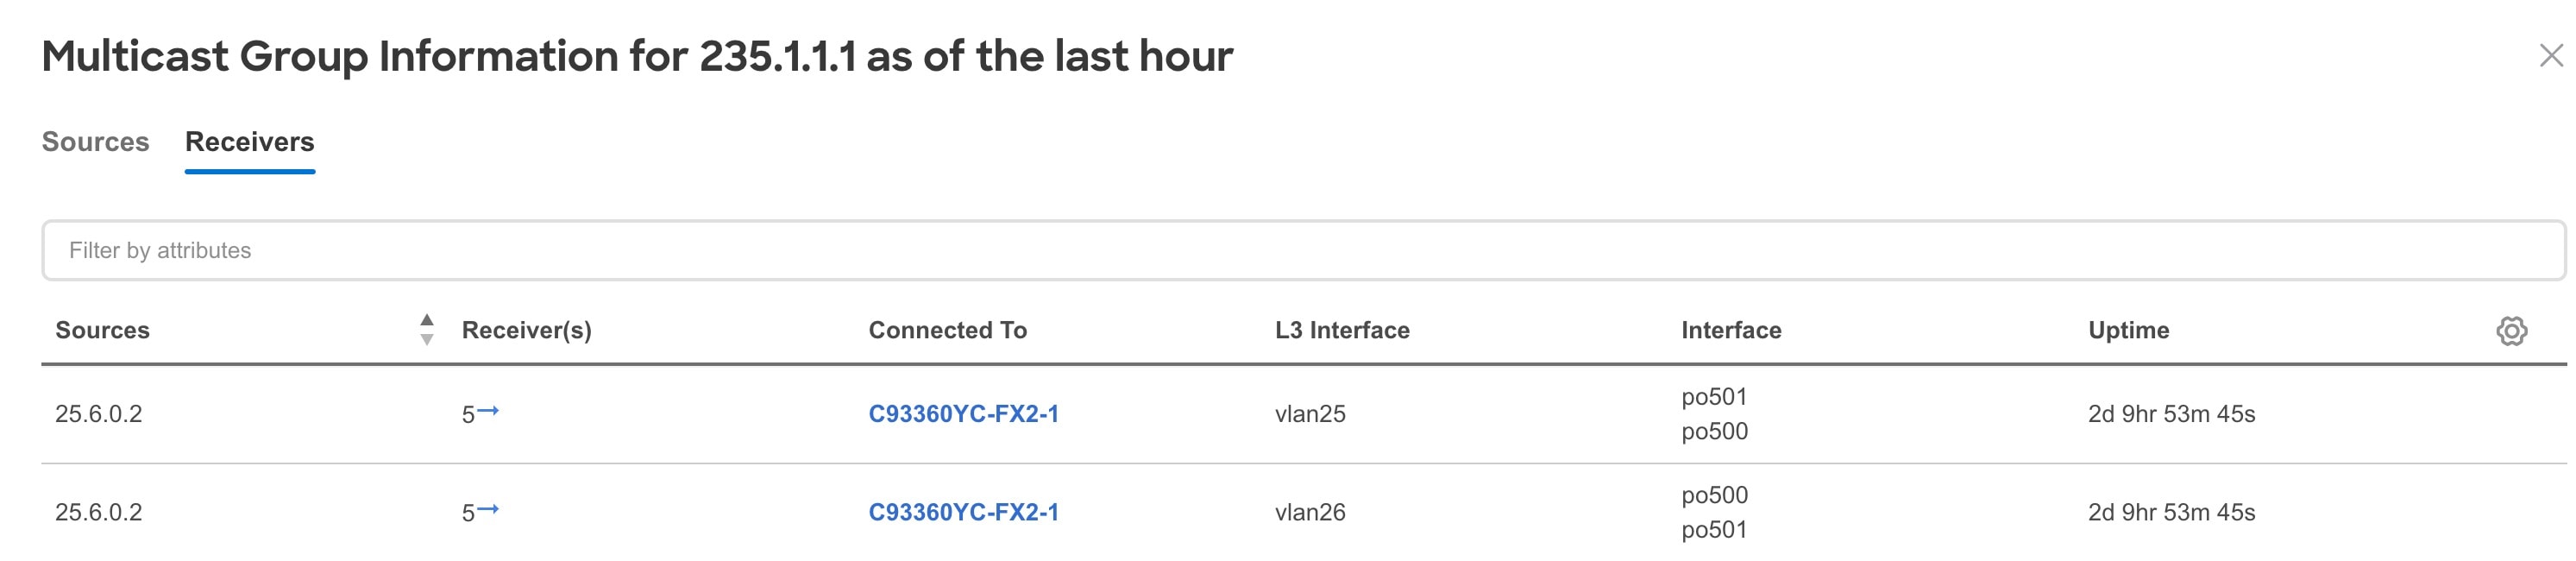
Click a multicast group to view additional information for sources and receivers.
-
Click Overview to view information such as multicast underlay group information for all tenant routed multicast sources, and trend graphs showing the sender traffic rate, sender packet rate, and number of receivers. The Overview displays by default.
-
Click Sources to view information such as source IP address, switch name, and interface.
-
Click Receivers to view information such as switch name,receiver count, uptime, and L3 interface.
-
-
Click a Sources entry to view the list of all source IP addresses for that multicast group.
-
Click one of the source IP addresses in the list to view additional information about that source.
-
Working with Fabrics
-
Navigate to Manage > Fabrics.
-
To add a fabric, click Add Fabric. See Add fabrics.
-
Choose Online or Snapshot fabrics from the drop-down list.
-
Click the fabric name to view the Fabric Details.
-
From the Actions drop-down menu, choose Edit Fabric to edit the fabric details. After you update the information, click Save.
-
From the Actions drop-down menu, choose View in Topology to view the topology for the fabric.
-
From the Actions drop-down menu, choose System Status to view the status of the data analysis for your fabric. See Getting Started.
-
To delete a fabric from Nexus Dashboard Insights, perform the following steps:
-
From the Actions drop-down menu, choose Pause Telemetry Collection to pause data collection.
-
From the Actions drop-down menu, choose Remove from Insights to remove the fabric. The fabric is removed from Nexus Dashboard Insights only and not from Nexus Dashboard’s Admin Console.
-
-
From the Actions drop-down menu, choose Resume Telemetry Collection to resume data collection.
-
Click Analyze Now to perform an on-demand analysis. Choose the service such as Assurance, Bug Scan, or Best Practices and click Run Now. See Getting Started.
Troubleshooting telemetry configuration issues
The Nexus Dashboard Insights telemetry configurations can fail on the switches for various reasons. These sections describe some of the common scenarios.
Common configuration issues with standalone NX-OS fabrics
The table provides common configuration issues and solutions with standalone NX-OS fabrics.
| Issue | Solution |
|---|---|
|
If you already enabled feature analytics on the switches, the Traffic Analytics configuration from Nexus Dashboard Insights will fail because you cannot enable feature netflow when feature analytics is enabled. Nexus Dashboard Insights raises a system anomaly that contains the following string:
|
|
|
If you already enabled feature netflow on the switches, Nexus Dashboard Insights will not allow Flow Telemetry to be enabled on switches that have an NX-OS release earlier than 10.3(3). |
|
|
If you added a switch with a stale flow exporter configuration to the fabric, the Flow Telemetry configuration from Nexus Dashboard Insights can fail due to conflicting exporter destination IP address configurations. Nexus Dashboard Insights raises a system anomaly that contains the following string:
|
|
|
Nexus Dashboard Insights configurations are saved to the startup configuration by periodically using the "copy running-config startup-config" command on a switch. If you reboot the switch after you deployed the Nexus Dashboard Insights configuration but before the copy operation is run, the configuration will be lost, which can result in inconsistencies in the configuration. The worst case time period for this issue to happen is about 2 hours. |
In either case, these steps get the configuration that you must deploy:
Another solution is to pause telemetry on the fabric, then resume telemetry. |
|
If the switches and Nexus Dashboard become out of sync due to out-of-band configuration changes on the switches, this can result in subsequent configuration failures. Nexus Dashboard detects the switches as out of sync as part of their scheduled CC runs once every 24 hours. You can also trigger a CC run manually using Resync Insights Configuration from Nexus Dashboard. Nexus Dashboard Insights raises a system anomaly that contains the following string:
|
Avoid any manual configuration changes that can result in a configuration conflict. In the case of a conflict, remove all telemetry-related configurations from the switches, then re-add the necessary configurations. Follow these steps to get the configurations that you must re-add:
Removing feature telemetry and feature analytics also removes all configurations under these features, including user configurations. You must manually re-add the user configurations after you restore the Nexus Dashboard Insights telemetry configurations. |
Common configuration issues with Cisco NDFC-managed fabrics
The table provides common configuration issues and solutions with Cisco NDFC-managed fabrics.
| Issue | Solution |
|---|---|
|
If you already enabled feature analytics on the switches, the Traffic Analytics configuration from Nexus Dashboard Insights will fail because you cannot enable feature netflow when feature analytics is enabled. |
|
|
If you already have the Netflow configuration on NDFC, either from the Netflow configuration from the NDFC fabric settings or from the switch free-form templates, Nexus Dashboard Insights will not allow Flow Telemetry to be enabled on switches that have an NX-OS release earlier than 10.3(3). |
|
Common configuration issues with all fabrics
The table provides common configuration issues and solutions with all fabrics.
| Issue | Solution |
|---|---|
|
If there are connectivity issues between the switches and Nexus Dashboard, deploying a configuration can fail. |
|
Copyright
THE SPECIFICATIONS AND INFORMATION REGARDING THE PRODUCTS IN THIS MANUAL ARE SUBJECT TO CHANGE WITHOUT NOTICE. ALL STATEMENTS, INFORMATION, AND RECOMMENDATIONS IN THIS MANUAL ARE BELIEVED TO BE ACCURATE BUT ARE PRESENTED WITHOUT WARRANTY OF ANY KIND, EXPRESS OR IMPLIED. USERS MUST TAKE FULL RESPONSIBILITY FOR THEIR APPLICATION OF ANY PRODUCTS.
THE SOFTWARE LICENSE AND LIMITED WARRANTY FOR THE ACCOMPANYING PRODUCT ARE SET FORTH IN THE INFORMATION PACKET THAT SHIPPED WITH THE PRODUCT AND ARE INCORPORATED HEREIN BY THIS REFERENCE. IF YOU ARE UNABLE TO LOCATE THE SOFTWARE LICENSE OR LIMITED WARRANTY, CONTACT YOUR CISCO REPRESENTATIVE FOR A COPY.
The Cisco implementation of TCP header compression is an adaptation of a program developed by the University of California, Berkeley (UCB) as part of UCB’s public domain version of the UNIX operating system. All rights reserved. Copyright © 1981, Regents of the University of California.
NOTWITHSTANDING ANY OTHER WARRANTY HEREIN, ALL DOCUMENT FILES AND SOFTWARE OF THESE SUPPLIERS ARE PROVIDED “AS IS" WITH ALL FAULTS. CISCO AND THE ABOVE-NAMED SUPPLIERS DISCLAIM ALL WARRANTIES, EXPRESSED OR IMPLIED, INCLUDING, WITHOUT LIMITATION, THOSE OF MERCHANTABILITY, FITNESS FOR A PARTICULAR PURPOSE AND NONINFRINGEMENT OR ARISING FROM A COURSE OF DEALING, USAGE, OR TRADE PRACTICE.
IN NO EVENT SHALL CISCO OR ITS SUPPLIERS BE LIABLE FOR ANY INDIRECT, SPECIAL, CONSEQUENTIAL, OR INCIDENTAL DAMAGES, INCLUDING, WITHOUT LIMITATION, LOST PROFITS OR LOSS OR DAMAGE TO DATA ARISING OUT OF THE USE OR INABILITY TO USE THIS MANUAL, EVEN IF CISCO OR ITS SUPPLIERS HAVE BEEN ADVISED OF THE POSSIBILITY OF SUCH DAMAGES.
Any Internet Protocol (IP) addresses and phone numbers used in this document are not intended to be actual addresses and phone numbers. Any examples, command display output, network topology diagrams, and other figures included in the document are shown for illustrative purposes only. Any use of actual IP addresses or phone numbers in illustrative content is unintentional and coincidental.
The documentation set for this product strives to use bias-free language. For the purposes of this documentation set, bias-free is defined as language that does not imply discrimination based on age, disability, gender, racial identity, ethnic identity, sexual orientation, socioeconomic status, and intersectionality. Exceptions may be present in the documentation due to language that is hardcoded in the user interfaces of the product software, language used based on RFP documentation, or language that is used by a referenced third-party product.
Cisco and the Cisco logo are trademarks or registered trademarks of Cisco and/or its affiliates in the U.S. and other countries. To view a list of Cisco trademarks, go to this URL: http://www.cisco.com/go/trademarks. Third-party trademarks mentioned are the property of their respective owners. The use of the word partner does not imply a partnership relationship between Cisco and any other company. (1110R)
© 2017-2024 Cisco Systems, Inc. All rights reserved.