
First Published: 2024-07-26
Americas Headquarters
Cisco Systems, Inc.
170 West Tasman Drive
San Jose, CA 95134-1706
USA
http://www.cisco.com
Tel: 408 526-4000
800 553-NETS (6387)
Fax: 408 527-0883
New and Changed Information
The following table provides an overview of the significant changes up to the current release. The table does not provide an exhaustive list of all changes or the new features up to this release.
| Feature | Description | Release | Where Documented |
|---|---|---|---|
|
Search and Explore |
New Search and Explore enables you to search for any IP or MAC address across all the fabrics managed by Nexus Dashboard Insights, and execute show commands to display anomalies. |
6.5.1 |
|
|
Policy-based redirect (PBR) support for Search and Explore |
|
6.5.1 |
|
|
Terminology change |
The term "sites" is renamed to "fabrics". |
6.5.1 |
Entire document |
This document is available from your Cisco Nexus Dashboard Insights GUI as well as online at www.cisco.com. For the latest version of this document, visit Cisco Nexus Dashboard Insights Documentation.
Search and Explore
About Search and Explore
Search and Explore allows you to quickly search for an IP or MAC address, interface name, or switch name across all the fabrics managed by Nexus Dashboard Insights and view the results within a few seconds. You can also create a show query to display anomalies, advisories, controllers and switches in inventory, interfaces, endpoints, and more. Search and Explore also enables you to ask questions or use explore queries to understand how different elements communicate with each other as well as other associations.
Types of Queries Supported
Search and Explore supports these queries:
-
What Query - Answers how the different networking entities are related to each other.
Examples:
-
What EPGs are associated with VRF: /uni/tn-secure/ctx-secure
-
What endpoints are associated with interface: topology/pod-1/paths-101/pathep-[eth1/3] or VRF:uni/tn-secure/ctx-ctx1
-
What EPGs are associated with bridge-domain: uni/tn-secure/BD-BD1 and leaf: :topology/pod-1/node-103
-
-
Can Query - Answers whether the entities in the ACI policy can communicate with each other. Can queries can also be used to determine if the entities in the ACI policy can communicate using protocols such as TCP, UDP, or ICMP and the source and destination ports used for communication.
Examples:
-
Can entity A talk to entity B.
-
Can EPG: uni/tn-secure/ap-AP0/epg-B talk to EPG: uni/tn-secure/ap-AP0/epg-A on tcp dport: 80 sport: 10
-
-
Show Query - Used to view any of the various objects across any fabric currently visible in Nexus Dashboard Insights. You can perform show queries on anomalies, advisories, switches, controllers, endpoints, interfaces, flows and more.
Guidelines and Limitations
Guidelines and Limitations for Search and Explore
-
Search is supported on IPv4 and IPv6 addresses.
-
When you enter a search string, auto-suggest displays the results that begin with the input string and is case sensitive.
-
Search is not available for hardware and capacity resources on leaf switches.
-
In certain cases, keyword search for interface types such as port channel, virtual port channel, and virtual port channel peer link is not supported.
-
Scale limits for Search and Explore include:
-
On virtual Nexus Dashboard we support snapshots with 100,000 logical rules and 350,000 (Vertices + Edges).
-
On physical Nexus Dashboard we support snapshots with 300,000 logical rules and 1000,000 (Vertices + Edges).
-
Guidelines and Limitations for Queries
-
What X to any association query is only supported for single fabrics.
-
Can any to any query is not supported.
-
The retention period for a What query is 7 days. After that the What query will not be displayed in historical searches.
-
For a Can query between prefixes, if the number of EPGs shared by the prefixes is greater than 25, the endpoint table fails to load the data and displays an error message.
-
To explore the APIC resources successfully using the Search and Explore feature, the APIC policy must contain either valid endpoints such as fv:CEp or valid EPGs.
Perform Search and Explore
-
Click Search and Explore.
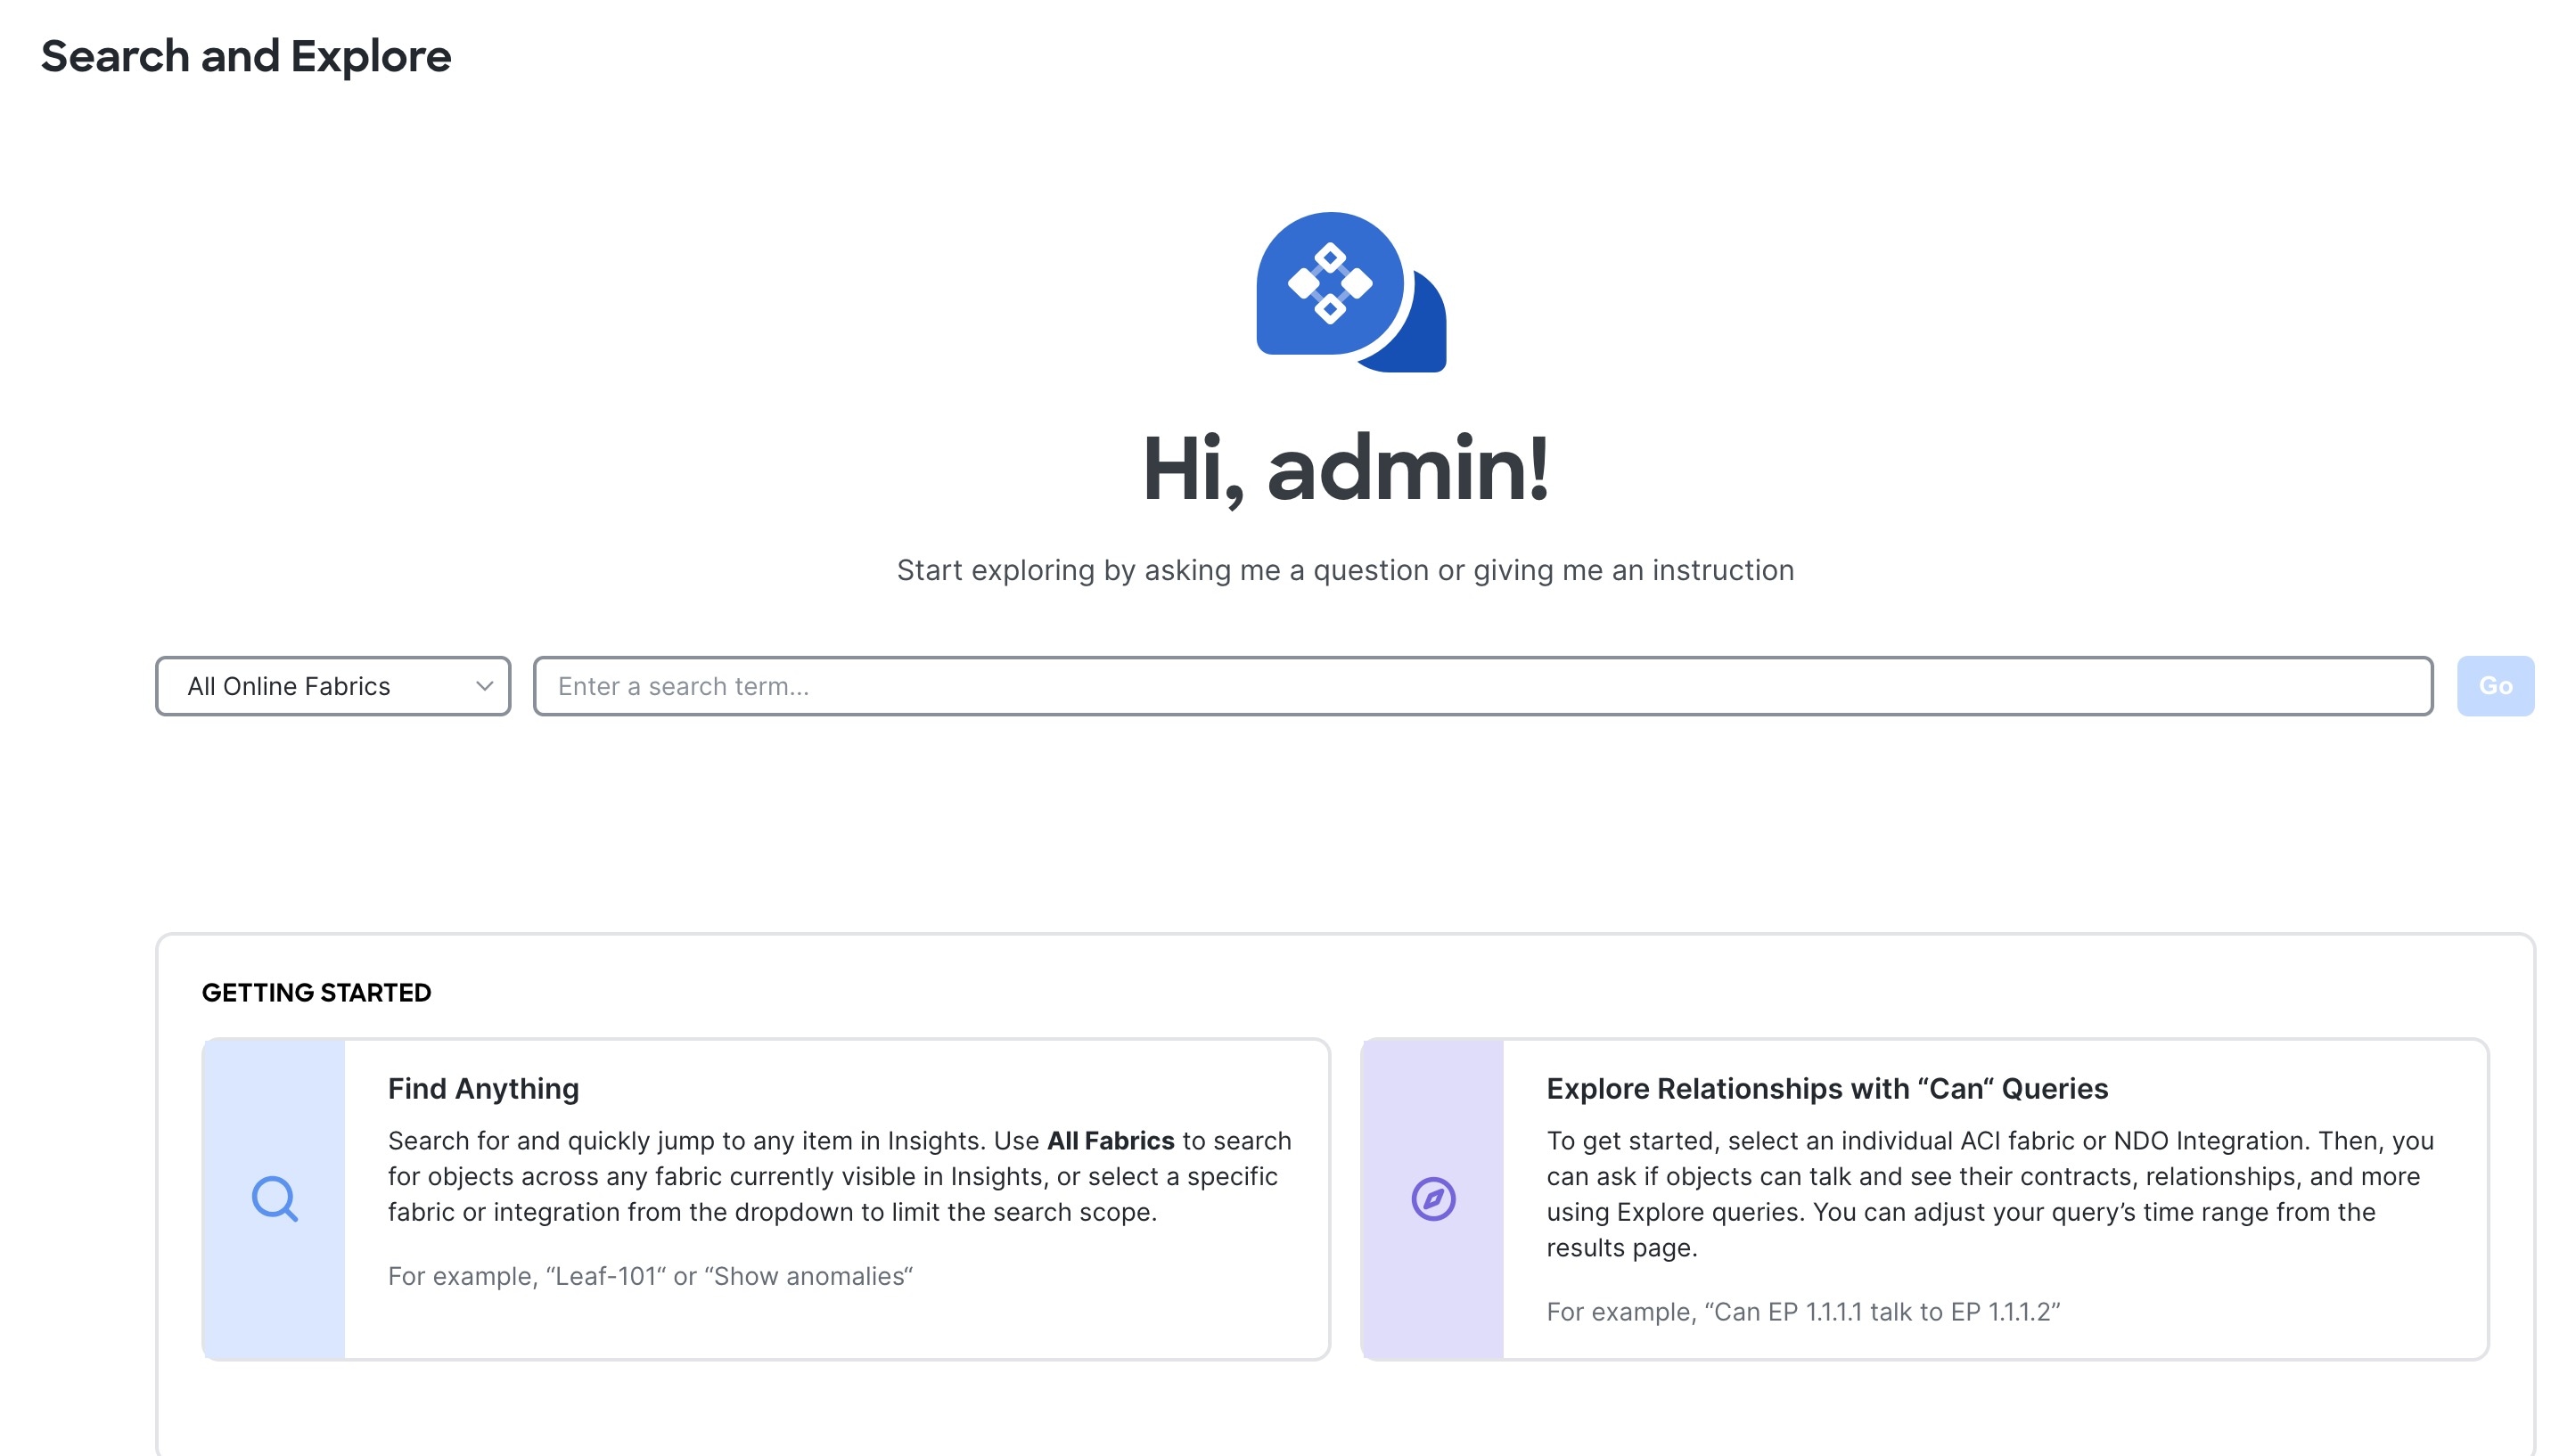
-
From the drop-down list, select All Online Fabrics or a single fabric.
-
Keyword Search
-
To perform a keyword search start typing the IP or MAC address, interface name, or switch name. Once you start typing the first 3 alphabets or numbers, auto-suggest results are displayed.
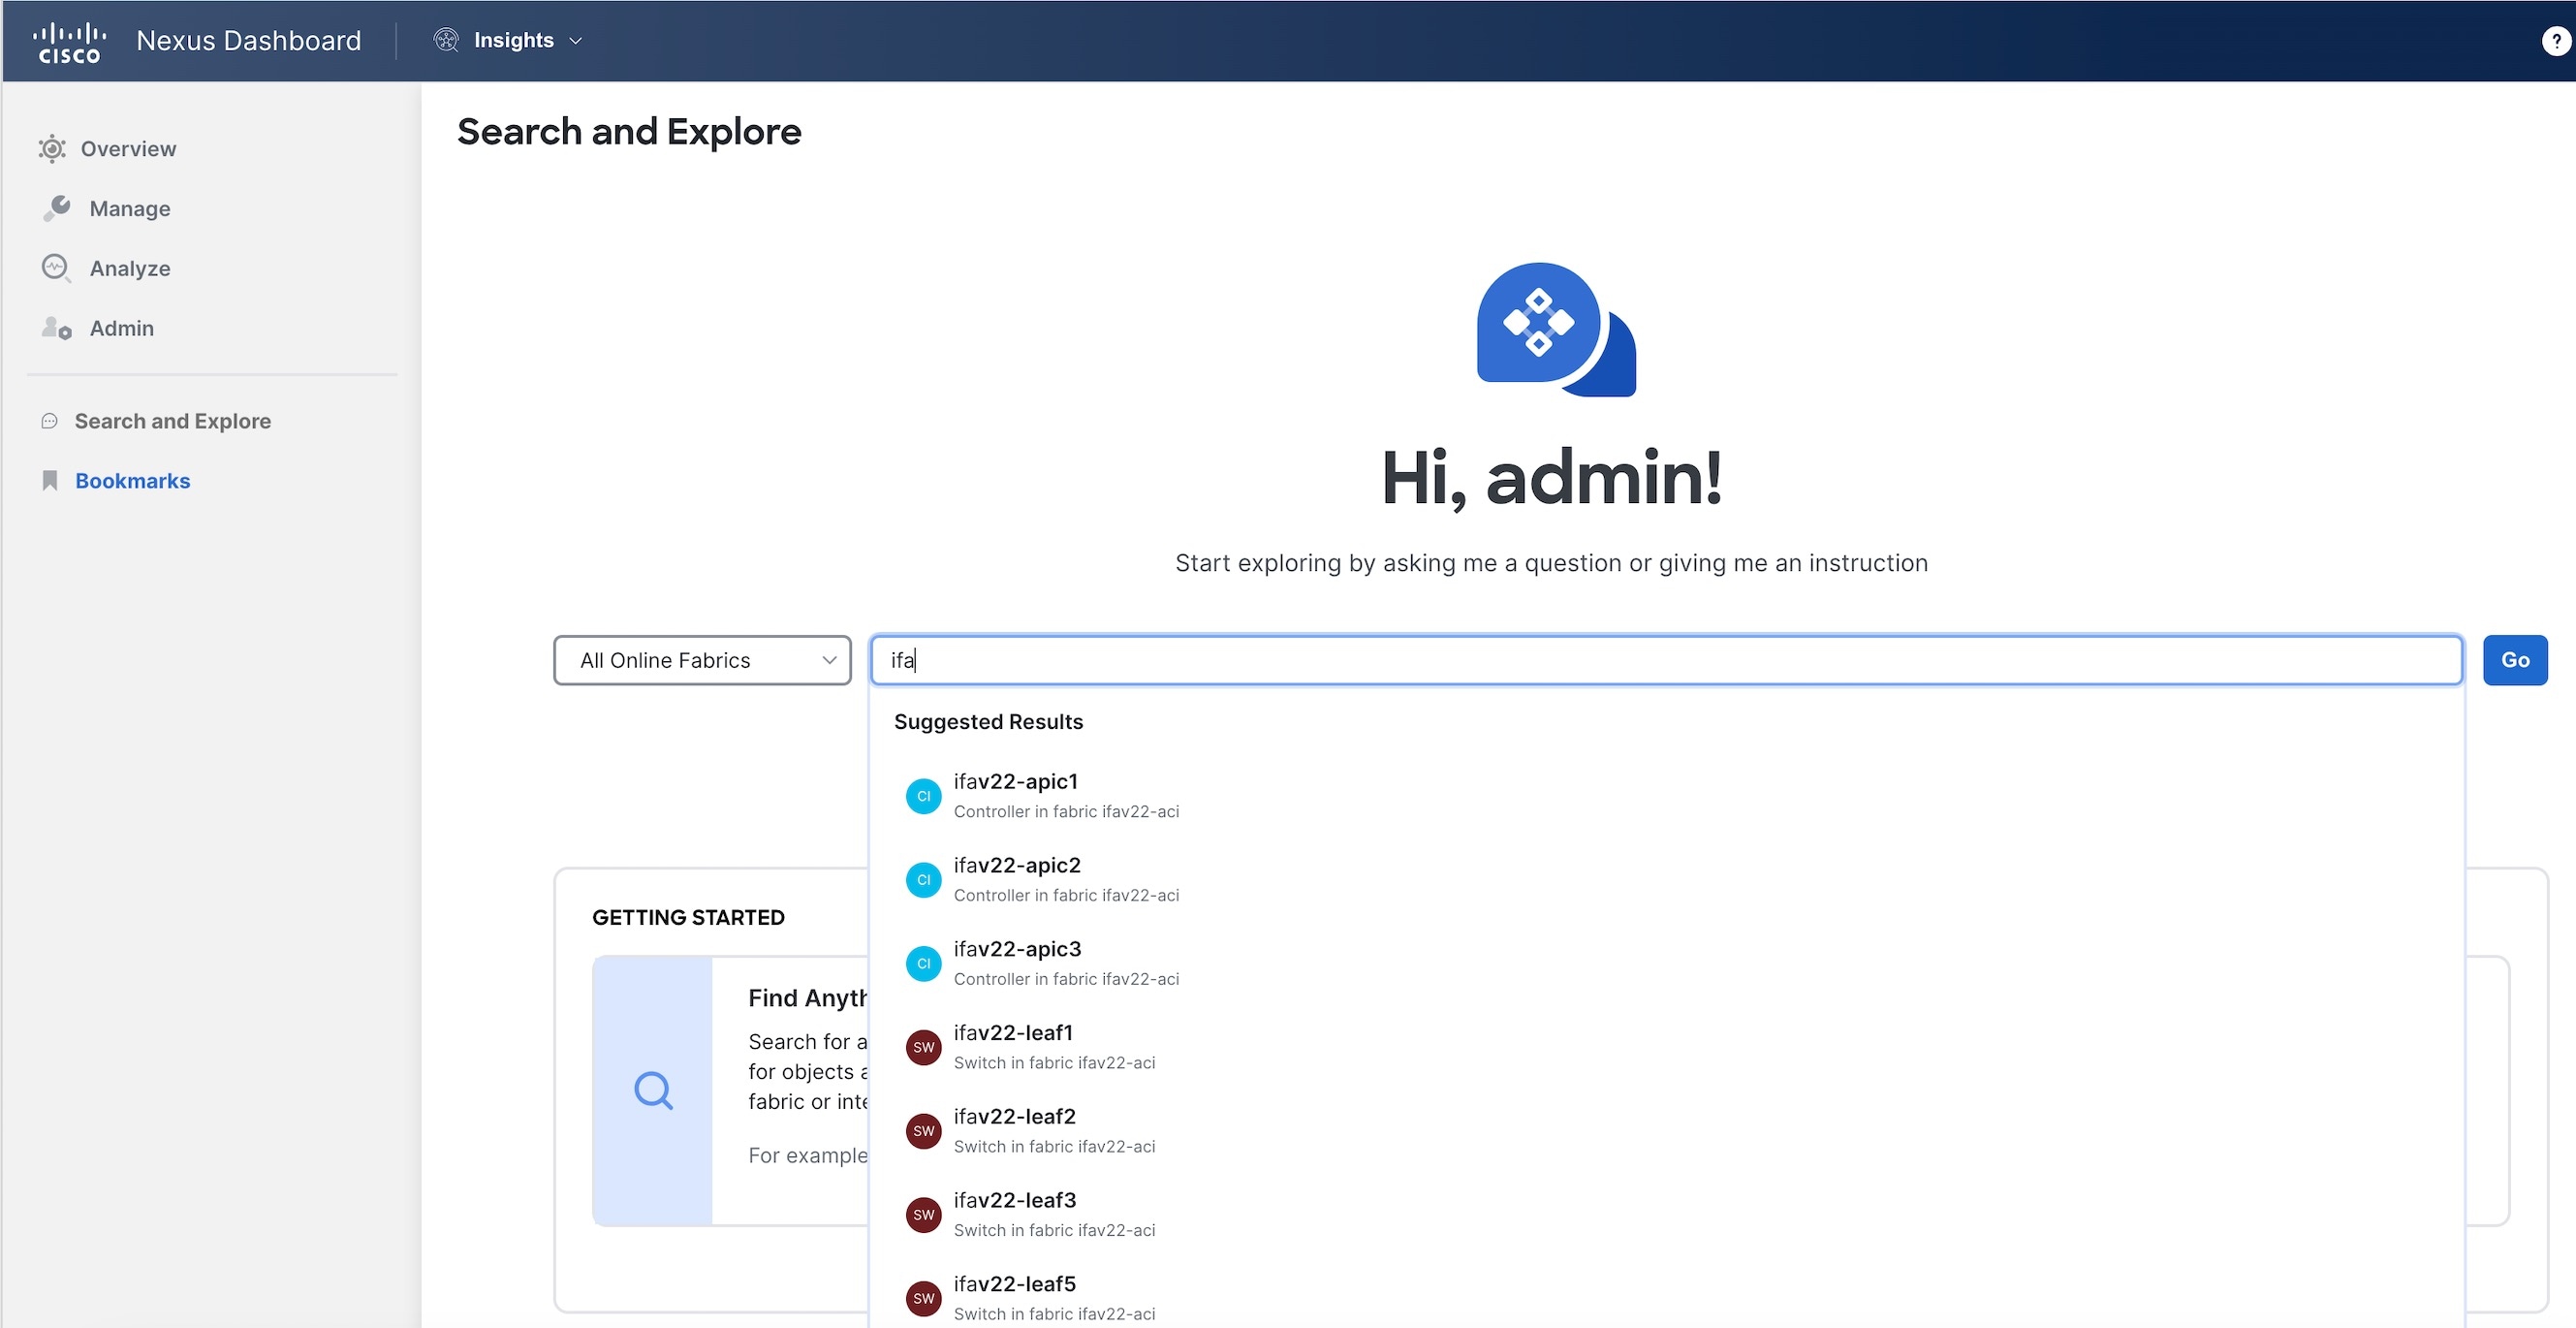

Keyword search is supported on online fabrics. Keyword search is case sensitive.
-
Select a result from the suggested results and click Go.
-
By default, search results for Active Now are displayed. From the Date and Time selector, select the time range to view results for a specific time.
-
For MAC and IP address search the endpoint page is displayed. For switch and interface name search the inventory page is displayed.
-
-
Show Queries
-
You can perform show queries on anomalies, advisories, switches, controllers, endpoints, interfaces, flows and more.
-
To perform a show query start typing show. Once you start typing auto-suggest results are displayed.
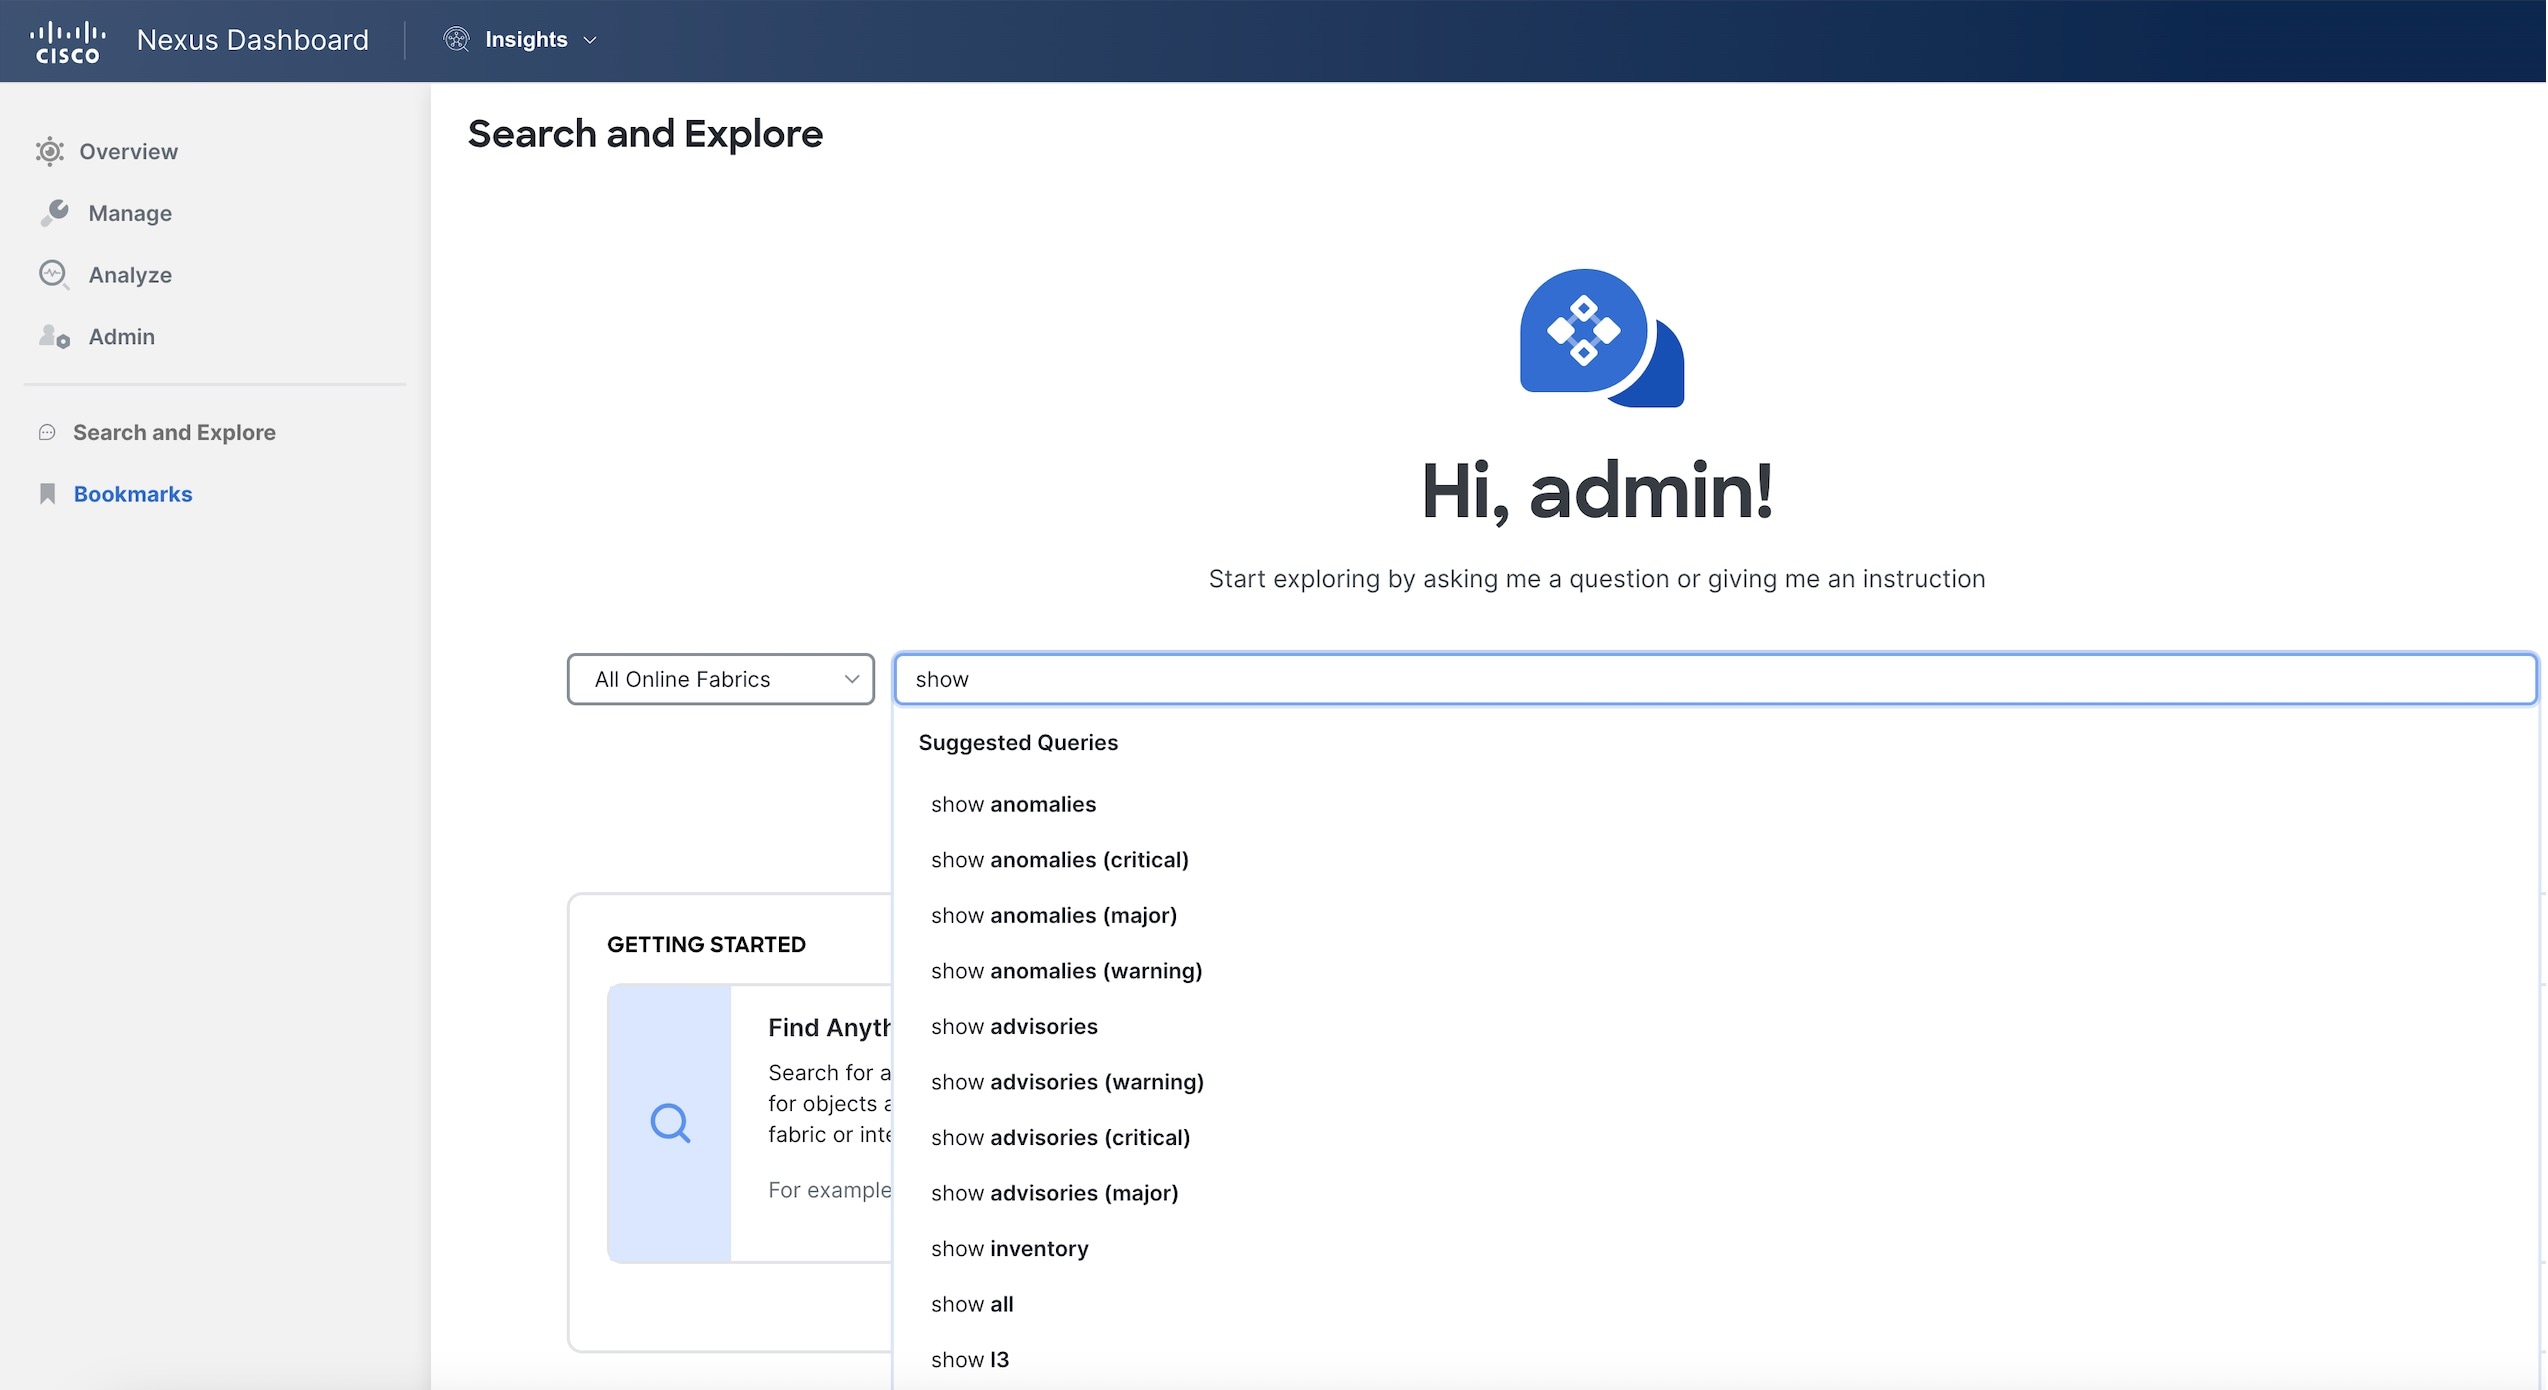
-
Select a query from the suggested results and click Go.
-
By default, search results for Active Now are displayed. From the Date and Time selector, select the time range to view results for a specific time.
-
The show query results are displayed in the existing Insights page with filters.
-
-
What Queries
-
You can perform a what query to answer the question, What entities are associated with each other?
-
To perform a what query, select a single fabric from the drop-down list and start typing what.
-
Once you start typing auto-suggest results are displayed.
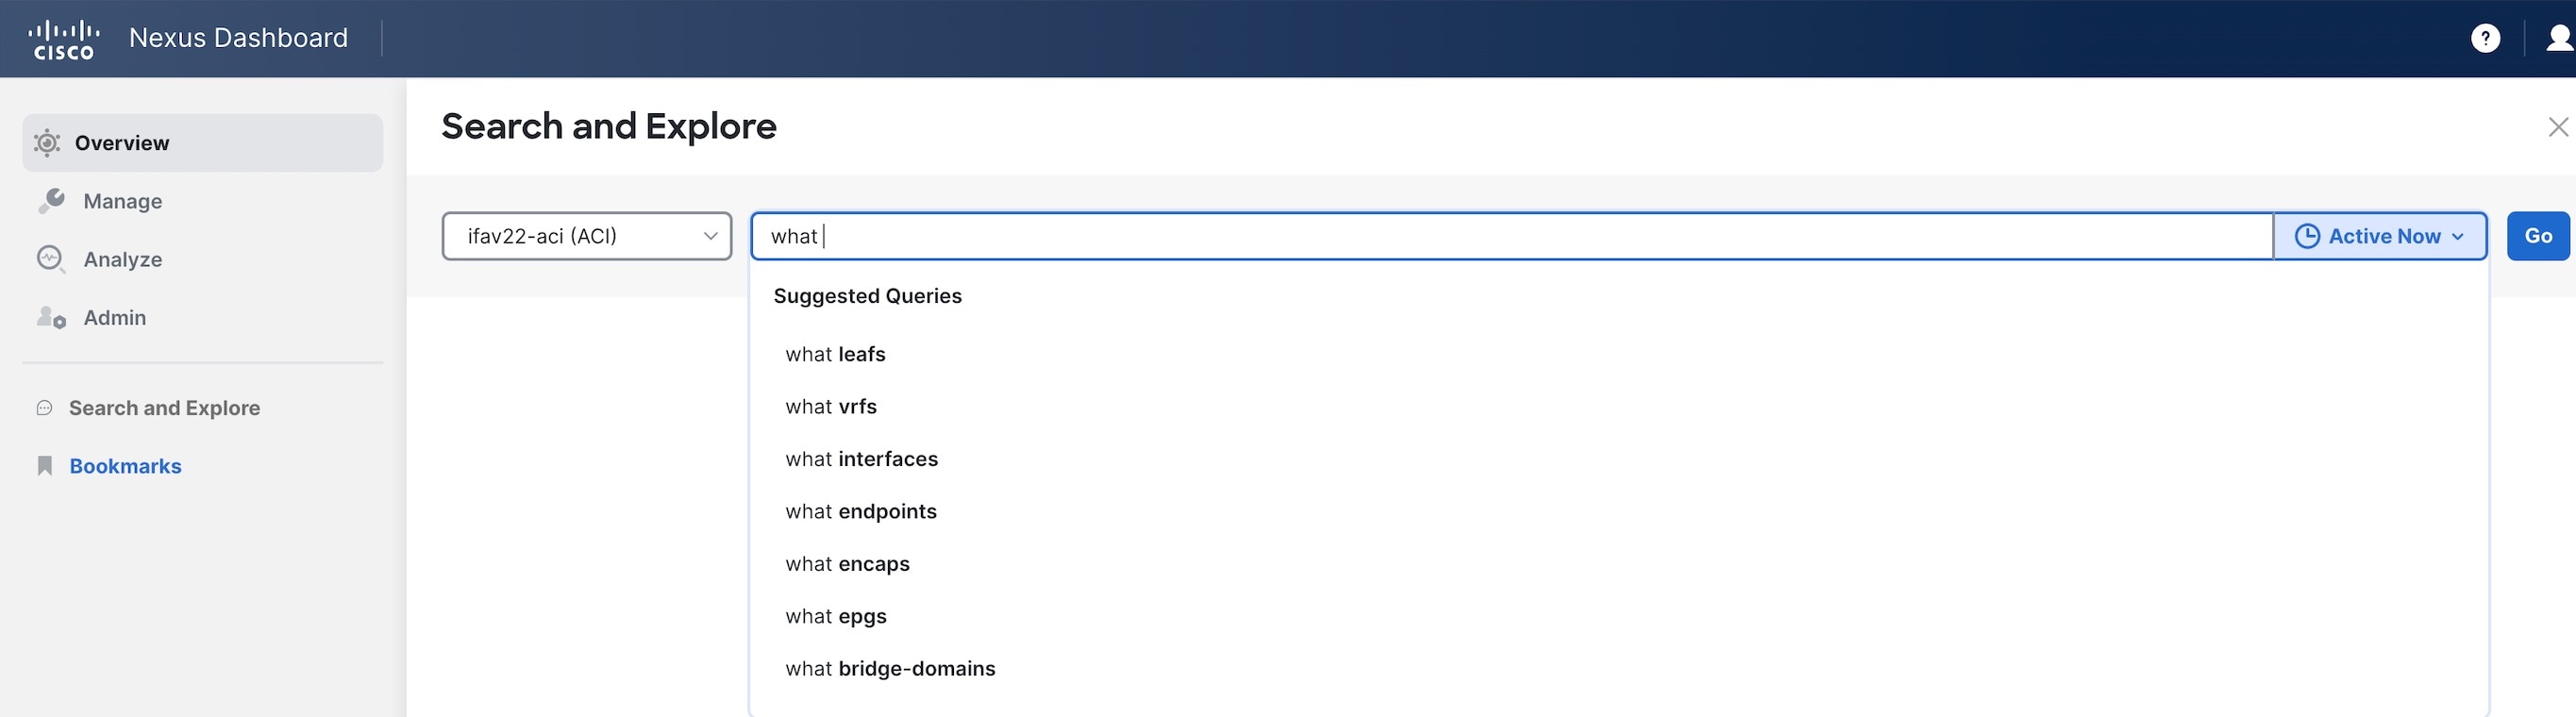
-
Select a query from the suggested results and click Go.
-
By default, search results for Active Now are displayed. From the Date and Time selector, select the time range to view results for a specific time.
-
The what query results are displayed in a tabular format.
-
-
Can Queries
-
You can perform a can query to determine if the entities can communicate with each other and the health of the connectivity.
-
To perform a can query, select a single fabric from the drop-down list and start typing can.
-
Once you start typing auto-suggest results are displayed.
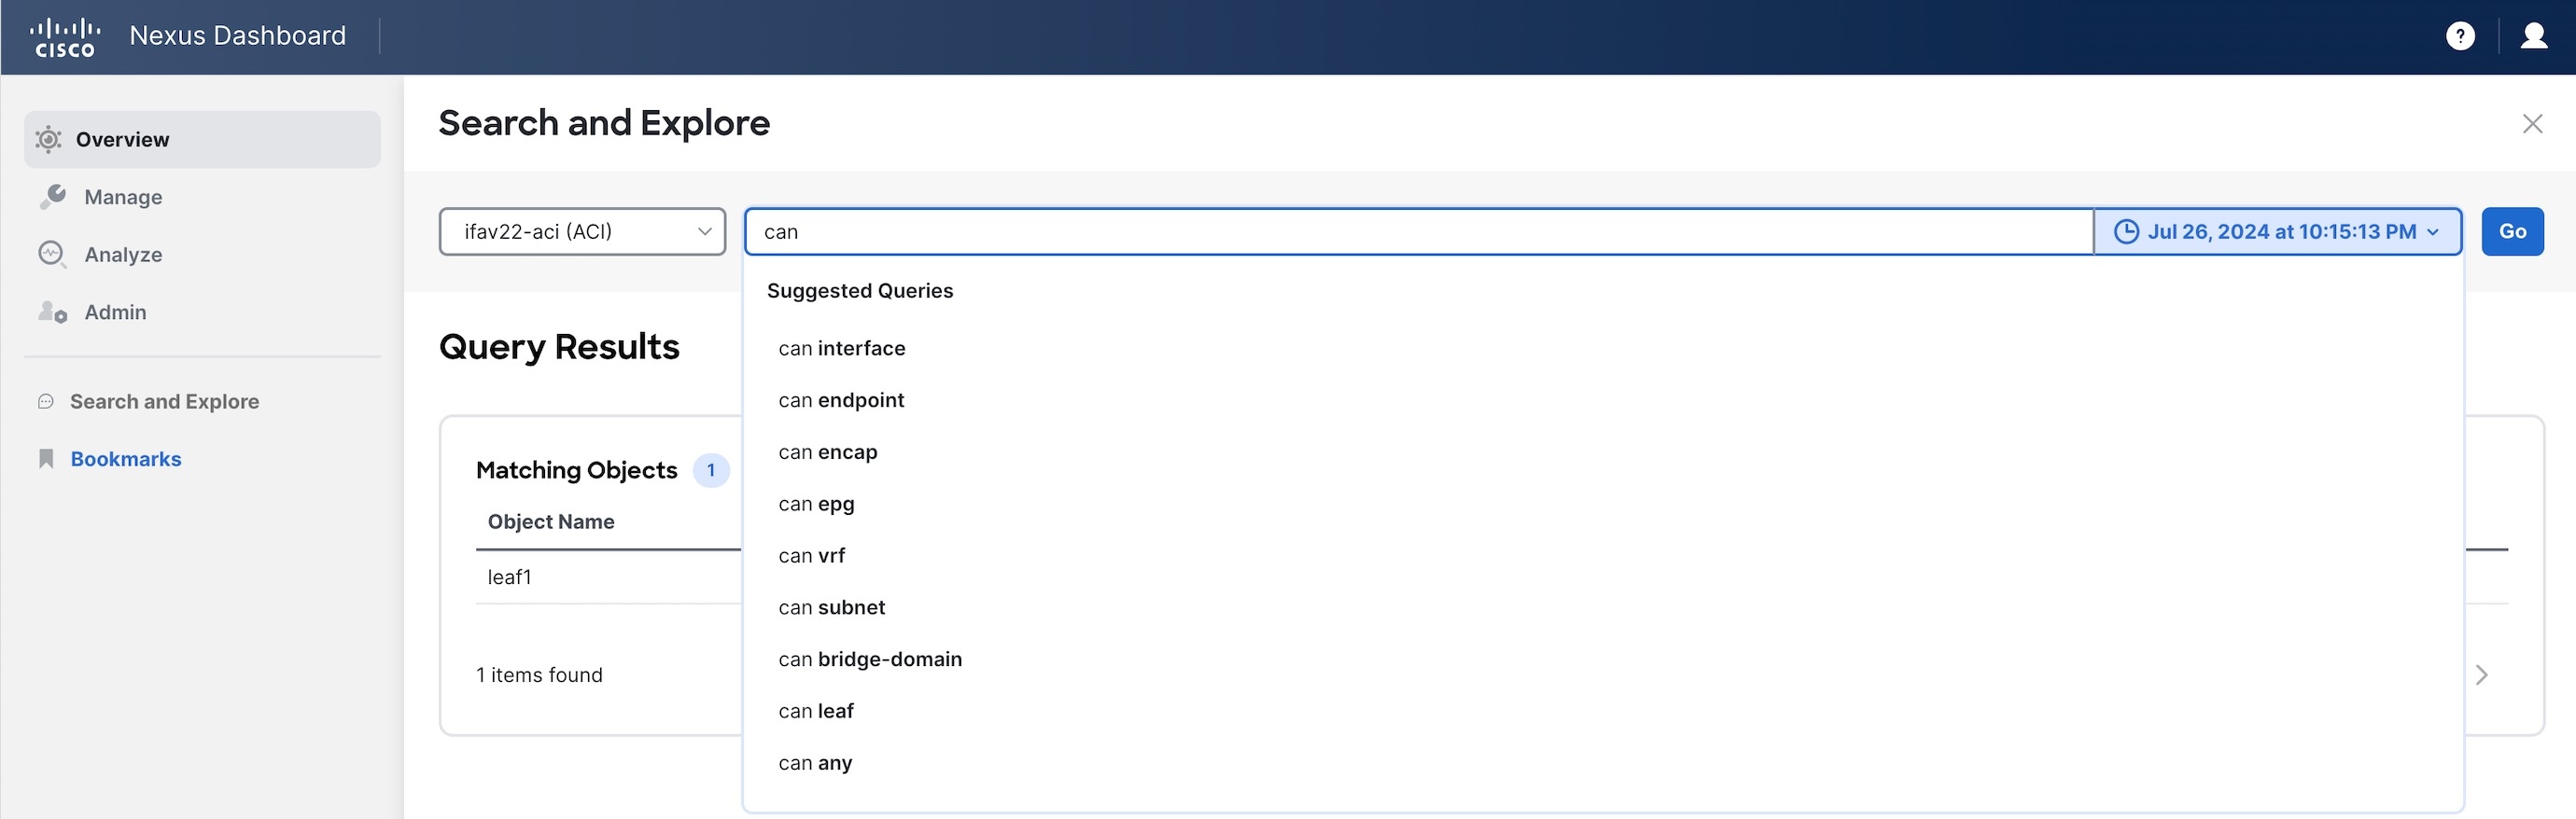
-
Select a query from the suggested results and click Go.
-
By default, search results for Active Now are displayed. From the Date and Time selector, select the time range to view results for a specific time.
-
The can query results are displayed in a graphical format.
-
Click Reverse Query to reverse the source and destination entities for a query.
-
Can Query Results
The Can query determines if the entities can communicate with each other and the health of the connectivity. The Can query results displays information about Can source talk to destination, Which entities can talk, and How do they talk.
Can Source Talk to Destination
This displays the flow of the traffic and the connectivity between the entities.
Which Entities Can Talk
The default radial view displays if the EPGs can talk to each other and the health of the EPGs. The source EPG is highlighted in light blue whereas the destination EPG is highlighted in dark blue.
The single radial band is used to view the prefixes or EPGs as entities. View enables you to filter the information displayed in the radial view. EPGs displays connectivity information between different EPGs as configured in the APIC policy, while Prefixes displays connectivity information between prefixes as configured in the APIC policy or learnt prefixes.
You can select different entities under Type to explore the associations between the different objects such as objects, tenants and VRFs. The associations will be displayed using inner and outer radial bands.
-
If you select EPGs, Tenants, and Both, the outer ring represents the tenants, the inner ring represents the application profiles, and arced lines in the middle show the health of the contracts.
-
If you select EPGs, VRFs, and Both, the outer ring represents the VRFs, the inner ring represents the bridge domains, and arced lines in the middle show the health of the contracts.
-
If you select Prefixes and VRFs, and Both, the outer ring represents the VRFs, the inner ring represents the bridge domains or L3Outs, and arced lines in the middle show the health of the contracts.
Health Status allows you to view the healthy and unhealthy connections between the entities.
How do they talk?
This is where you can view the configuration used for communication between the entities and the health of the connectivity. The possible causes for unhealthy connectivity include security violations, forwarding violations, and endpoint violations. In How do they talk?, the results display under Connectivity Table, Policy Table, Forwarding Table, Endpoints Table, and Anomalies table.
-
Connectivity - Displays the source EPG, destination EPG, source prefix, destination prefix, source VRF and destination VRF between the entities.
-
Policy - Displays the security flows between the source and destination. It lists the source EPG, destination EPG, policy enforcement VRF, policy owner (contract), ether type, protocol, source port from, source port to, destination port from, destination port to, TCP rules and rule action. For a non PBR contract, it displays one rule while for a PBR enabled rule, it displays two.
-
Forwarding -Displays the prefix table between the source and destination. You can click Subnet/Route to see information regarding the prefixes.
When we create a PBR, we can configure a BD for the provider/consumer connector of the service node, which allows us to see the service BD and the service BD subnet in addition to the consumer and provider BD information.
-
Endpoints - Displays the endpoint details of the source and destination. For a PBR enabled rule, an additional EPG (service EPG) will be listed with the EPG column and BD column populated.
-
Anomalies - Lists all the anomalies generated from the query. You can click the anomaly to determine the objects in your fabric that are affected by the issue. Pass or Fail checks are performed on the anomaly and the suggested steps to resolve the issue are displayed.
Policy-Based Redirect (PBR) support for Search and Explore
Starting from Nexus Dashboard Insights release 6.5.1, Can EPG_A talk to EPG_B query is enhanced for PBR enabled contract.
In the query results page, you can view the following for PBR enabled contract:
-
Policy table will display the redirect rule from
EPG_A to EPG_Band the permit rule from serviceEPG to EPG_B. -
Forwarding table will also display subnet from service EPG.
-
Endpoint table will also display endpoint from service EPG.
In addition, you can query a service EPG as a regular EPG.
Examples:
-
Can serviceEPG_name talk to regularEPG_name
-
What endpoints are associated with serviceEPG_name
Search and Explore for Nexus Dashboard Orchestrator
The Search and Explore feature in Nexus Dashboard Insights allows network operators to discover assets and their object associations in an easy-to-consume natural language query format. Nexus Dashboard Orchestrator assurance for Search and Explore workflows currently supports a Can EPG talk to EPG query where the query must include two distinct Nexus Dashboard Orchestrator policy entities to view their connectivity.
After you run assurance analyses against the fabrics in your Nexus Dashboard Orchestrator deployment, you will be able to navigate associations between EPGs, explore EPG to EPG communication, and enable visibility and troubleshooting across fabrics.
Explore provides you with EPG details from your programmed Nexus Dashboard Orchestrator templates or schemas. You can view which EPG entities can communicate. The entities stretch across the fabrics. If there are anomalies raised in these connections, those anomalies are also displayed here.
Currently, only Can EPG to EPG queries are supported for Nexus Dashboard Orchestrator assurance. What queries are not supported. For Can EPG to EPG queries, additional filtering based on protocols and port is not supported.
Examples:
-
This is an example of a query that is supported: Can EPG: uni/tn-secure/ap-AP0/epg-B talk to EPG: uni/tn-secure/ap-AP0/epg-A
-
This is an example of a query that is not supported: Can EPG: uni/tn-secure/ap-AP0/epg-B talk to EPG: uni/tn-secure/ap-AP0/epg-A on tcp dport: 80
You can choose from the auto-suggested query-list of all EPGs within the Nexus Dashboard Orchestrator assurance fabrics. Can query results are available as an aggregated view across all fabrics within the Nexus Dashboard Orchestrator assurance fabrics and not per ACI fabric. All queries are across-fabric queries, and the maximum severity of assets and associations across all fabrics is shown in the results.
Guidelines and Limitations for Nexus Dashboard Orchestrator
-
After running your query, when you view the Connectivity Table and the Policy Table, in the Source EPG and Destination EPG columns a shadow tag to an EPG will be displayed if the EPG is a shadow in the corresponding fabric. For example, <epgname>(shadow). If an EPG is not a shadow, there will be no shadow tag after the EPG name. However, if you have a version of APIC/Nexus Dashboard Orchestrator that does not have the shadow annotation, the shadow tag will not display even for shadow EPGs.
-
In the Endpoints, Forwarding, and the Policy tables, you can click a fabric for specific anomaly details.
-
The Anomalies table displays individual, aggregated, or inter-fabric anomalies based on the queries that you have selected.
Create a Can Query in Nexus Dashboard Orchestrator Inter-Fabric
You must complete running assurance analyses against the fabrics in your Nexus Dashboard Orchestrator deployment.
-
Click Search and Explore.
-
To perform a can query, select a Nexus Dashboard Orchestrator fabric from the drop-down list and start typing can.
-
Once you start typing auto-suggest results are displayed. Select a query from the suggested results and click Go.
-
By default, search results for Active Now are displayed. From the Date and Time selector, select the time range to view results for a specific time.
-
The can query results are displayed in a graphical format. In the Can Source Talk to Destination area, you can confirm whether source can talk to destination.
-
Click Reverse Query to reverse the source and destination entities for a query.
-
In the Which entities Can Talk? area, under View Control, click EPGs to view the communication between the EPGs. The EPG view displays connectivity information between different EPGs.
-
In the radial view, the colors of the arced lines correspond to the severity of the anomalies. Click the appropriate arrow inside the radial to view further details in the page.
-
In the How do they talk? area, view how the entities communicate with one another.
CAN Query Results
For a Can Query, the results are displayed in a radial in the Which Entities Can Talk area.
The results display if the queried EPGs can communicate with one another. The color of the arrow represents the maximum severity for the connection. If the query results are large, the message “The query returned too much data to display” is shown.
Select a single resource from the Would you like to check connectivity of a single resource drop-down list to create a specific query. When you click a specific connection in the radial view, you view the details for the connection in the tables that follow.
You can see the policy that is programmed as part of the EPG. You can verify the prefixes that are part of the connection. You can also view which endpoints are affected because of this communication.
For Nexus Dashboard Orchestrator Inter-Fabric Assurance Explore, the Policy, Forwarding, and Endpoints tables, display an additional Fabrics column. The connectivity information for each fabric, that is part of your query, is displayed here. For each of these fabrics, if there are any anomalies that are generated, you can view them here. For example, as a part of endpoints if there is a Major anomaly, you can click to choose it and click Analyze to view the details for the anomaly.
The details are provided in the Nexus Dashboard Orchestrator context. You can learn what is being programmed by Nexus Dashboard Orchestrator across multiple fabrics and you can verify the query and check the communication between different EPGs that are used. The inter-fabric view displays Nexus Dashboard Orchestrator associated Fabric anomalies.
Copyright
THE SPECIFICATIONS AND INFORMATION REGARDING THE PRODUCTS IN THIS MANUAL ARE SUBJECT TO CHANGE WITHOUT NOTICE. ALL STATEMENTS, INFORMATION, AND RECOMMENDATIONS IN THIS MANUAL ARE BELIEVED TO BE ACCURATE BUT ARE PRESENTED WITHOUT WARRANTY OF ANY KIND, EXPRESS OR IMPLIED. USERS MUST TAKE FULL RESPONSIBILITY FOR THEIR APPLICATION OF ANY PRODUCTS.
THE SOFTWARE LICENSE AND LIMITED WARRANTY FOR THE ACCOMPANYING PRODUCT ARE SET FORTH IN THE INFORMATION PACKET THAT SHIPPED WITH THE PRODUCT AND ARE INCORPORATED HEREIN BY THIS REFERENCE. IF YOU ARE UNABLE TO LOCATE THE SOFTWARE LICENSE OR LIMITED WARRANTY, CONTACT YOUR CISCO REPRESENTATIVE FOR A COPY.
The Cisco implementation of TCP header compression is an adaptation of a program developed by the University of California, Berkeley (UCB) as part of UCB’s public domain version of the UNIX operating system. All rights reserved. Copyright © 1981, Regents of the University of California.
NOTWITHSTANDING ANY OTHER WARRANTY HEREIN, ALL DOCUMENT FILES AND SOFTWARE OF THESE SUPPLIERS ARE PROVIDED “AS IS" WITH ALL FAULTS. CISCO AND THE ABOVE-NAMED SUPPLIERS DISCLAIM ALL WARRANTIES, EXPRESSED OR IMPLIED, INCLUDING, WITHOUT LIMITATION, THOSE OF MERCHANTABILITY, FITNESS FOR A PARTICULAR PURPOSE AND NONINFRINGEMENT OR ARISING FROM A COURSE OF DEALING, USAGE, OR TRADE PRACTICE.
IN NO EVENT SHALL CISCO OR ITS SUPPLIERS BE LIABLE FOR ANY INDIRECT, SPECIAL, CONSEQUENTIAL, OR INCIDENTAL DAMAGES, INCLUDING, WITHOUT LIMITATION, LOST PROFITS OR LOSS OR DAMAGE TO DATA ARISING OUT OF THE USE OR INABILITY TO USE THIS MANUAL, EVEN IF CISCO OR ITS SUPPLIERS HAVE BEEN ADVISED OF THE POSSIBILITY OF SUCH DAMAGES.
Any Internet Protocol (IP) addresses and phone numbers used in this document are not intended to be actual addresses and phone numbers. Any examples, command display output, network topology diagrams, and other figures included in the document are shown for illustrative purposes only. Any use of actual IP addresses or phone numbers in illustrative content is unintentional and coincidental.
The documentation set for this product strives to use bias-free language. For the purposes of this documentation set, bias-free is defined as language that does not imply discrimination based on age, disability, gender, racial identity, ethnic identity, sexual orientation, socioeconomic status, and intersectionality. Exceptions may be present in the documentation due to language that is hardcoded in the user interfaces of the product software, language used based on RFP documentation, or language that is used by a referenced third-party product.
Cisco and the Cisco logo are trademarks or registered trademarks of Cisco and/or its affiliates in the U.S. and other countries. To view a list of Cisco trademarks, go to this URL: http://www.cisco.com/go/trademarks. Third-party trademarks mentioned are the property of their respective owners. The use of the word partner does not imply a partnership relationship between Cisco and any other company. (1110R)
© 2017-2024 Cisco Systems, Inc. All rights reserved.