
First Published: 2024-07-23
Americas Headquarters
Cisco Systems, Inc.
170 West Tasman Drive
San Jose, CA 95134-1706
USA
http://www.cisco.com
Tel: 408 526-4000
800 553-NETS (6387)
Fax: 408 527-0883
New and Changed Information
The following table provides an overview of the significant changes up to the current release. The table does not provide an exhaustive list of all changes or the new features up to this release.
| Feature | Description | Release | Where documented |
|---|---|---|---|
|
Bug descriptions included for Bug Scan |
The table of bugs in the Bugs area of Bug Scan now includes a description of each bug. |
6.5.1 |
|
|
Template-based compliance rule enhancement |
This feature allows you to define the state of the specific object in the template. STATUS defines the state of the specific object in the template, whether an object exists or does not exist. |
6.5.1 |
|
|
Sustainability report top 5 devices |
The sustainability report now shows the top 5 devices for the highest estimated cost, most energy consumed, and highest estimated greenhouse gas (GHG) emissions. |
6.5.1 |
|
|
Traffic Analytics for Cisco ACI |
You can now use Traffic Analytics for Cisco ACI. |
6.5.1 |
|
|
Use of the Cisco Energy Manager instead of Electricity Maps |
Nexus Dashboard Insights now obtains the energy cost and greenhouse gas (GHG) emissions data from the Cisco Energy Manager instead of from Electricity Maps. Using the Cisco Energy Manager provides a more robust method for collecting the data by avoiding a possible single point of failure or absence of data for a region. |
6.5.1 |
|
|
UI enhancements for Connectivity Analysis |
Connectivity Analysis UI has be redesigned. |
6.5.1 |
|
|
Terminology change |
The term "sites" is renamed to "fabrics". |
6.5.1 |
Entire document |
This document is available from your Nexus Dashboard Insights GUI as well as online at www.cisco.com. For the latest version of this document, visit Cisco Nexus Dashboard Insights Documentation.
Compliance
Compliance
Compliance enables user to define set of rules to enforce communication and configuration standards or expectations of the user.
Navigate to Manage > Rules > Compliance Rules > Create Compliance Rule.

An alternate way to get to the rule creation page, is to click the Create Compliance Rule button in Compliance in Analysis Hub. This will take you to rule creation.
The state of any rule can be changed after they have been created. If the rule is in Enabled state, the rule will be used to generate the Compliance Report, the next time it gets generated. If the rule is in Disabled state, it will not be used.
Go to Configure > Rules and enable or disable the specific rule from the Rule State column in the table. Click the Actions menu for the row and click Edit to open Edit Compliance Rule. In the State field, change the state to Enabled and click Save.
Types of compliance
There are two Compliance Types - Communication and Configuration Compliance. Configuration enables and enforces the configuration to meet best practices and business requirements.
Communication enables communication or isolation between network objects that meet business and regulatory purposes. To create a compliance communication rule, see Create compliance communication rule.
-
Communication Compliance consists of the following Compliance Rule Types:
-
Service Level Agreement (SLA) Compliance: You can set up rules for entities that must talk with other entities. You can use the Compliance feature to set up regulatory compliance rules.
-
Traffic Restriction Compliance: You can specify restrictions on protocols and ports for communication between objects.
-
Segmentation Compliance: You can establish walled areas around a set of entities that must not communicate with other entities.
-
-
Configuration Compliance helps perform a configuration compliance check against a specified configuration.
Configuration compliance can be further classified into four types:
-
Snapshot Settings Compliance: This is similar to the configuration compliance check method but you also select a snapshot. With this method, you can make sure that certain attributes of objects are not changed when going from one snapshot to another snapshot. To create a compliance rule with snapshot selection, see Create compliance rule with snapshot selection.
-
Manual Configuration: You can configure this for certain objects such as BD, VRF, EPG, Contract, Subject, and Filter. All objects types are not supported. To create a compliance rule with manual configuration, see Create compliance rule with manual configuration.
-
Template based Compliance: With template-based compliance, you have the flexibility to select objects based on any attributes and provide different types of matching criteria that are not supported when you configure other compliance tasks. To create a template-based compliance, see Create template-based compliance.
Template-based compliance allows you to configure a template and specify types of queries to select objects and attributes that enforce specific conditions when enabled. The Template Query Language enables you to select any configurable object and define what attributes to apply to the compliance.
-
With other types of Compliance configurations releases you can upload a JSON/XML file and all the attributes in the file will be matched as is. Alternatively, you can also select a few specific objects based on name matches, and you can configure select attributes supported for those specific objects. This allows you to search for existing or future objects matching the names that are checked for compliance for the specified parameters.
+
-
Import Configuration Compliance: You can perform an import configuration against a specified configuration. You specify a configuration file or snapshot, and Cisco Nexus Dashboard Insights continuously checks against it and enables you to identify changes for the objects and configurable attributes defined in Cisco APIC. If the configuration deviates from the specified configuration, then violations are raised. For each violation, there will be a separate violation anomaly displayed. Additionally, a single anomaly will be raised that includes every variable for every object of the tenant that is not a violation. To create an import configuration compliance, see Create import configuration compliance.
Examples of compliance
-
Example of template-based compliance
-
The following is an example of a Template Based Configuration Compliance. In this example, choose all the contracts where name starts with Ctrct_(1-3). Then, match scope which must be context. Select contract subjects which have name as any (wildcard) and nameAlias must be ABC. The status MUST_EXIST means for all the parent nodes that exists, at least one of obj_type must exist. If a select is defined it should obey that condition.
{ "vzBrCP": { "attributes": { "STATUS": "MUST_EXIST", "SELECT(name)": "REGEX(Ctrct_[1-3])", "MATCH(scope)": "EXACT(context)" }, "children": [ { "vzSubj": { "attributes": { "SELECT(name)": "REGEX(.*)", "nameAlias": "ABC" }, "children": [ { "vzRsSubjFiltAtt": { "attributes": { "SELECT(tnVzFilterName)": "ENDS_WITH(3_1_1)", "MATCH(action)": "deny" } } } ] } } ] } } -
Does BD has a IPv4 subnet and an L3Out associated with it for specific tenants? This can be evaluated in the below template.
{ "fvTenant": { "attributes": { "SELECT(dn)": "OR(uni/tn-mgmt,uni/tn-tcam_comp_aepg_aepg,uni/tn-Corp102)" }, "children": [ { "fvBD": { "attributes": { "SELECT(name)": "REGEX(.*)" }, "children": [ { "fvSubnet": { "attributes": { "SELECT(ip)": "REGEX(^[A-Fa-f0-9]{1,4}\\:*)", "ctrl": "nd", "ipDPLearning": "enabled", "scope": "public" } } }, { "fvRsBDToOut": { "attributes": { "STATUS": "MUST_EXIST", "MATCH(tnL3extOutName)": "REGEX(L3Out_W02_[A-Za-z0-9])" } } }, { "fvRsCtx": { "attributes": { "MATCH(tnFvCtxName)": "REGEX(VRF_W02_[A-Za-z]*)", "STATUS": "MUST_NOT_EXIST" } } }, { "fvRsBDToNdP": { "attributes": { "STATUS": "MUST_EXIST" } } } ] } } ] } } -
EPG must not has a VMM Domain Configured. This can be evaluated in the below template.
{
    "fvTenant":
    {
        "attributes":
        {
            "SELECT(dn)": "STARTS_WITH(uni/tn-NAE_contract)"
        },
        "children":
        [
            {
                "fvAp":
                {
                    "attributes":
                    {
                        "SELECT(name)": "REGEX(.*)"
                    },
                    "children":
                    [
                        {
                            "fvAEPg":
                            {
                                "attributes":
                                {
                                    "floodOnEncap": "disabled",
                                    "hasMcastSource": "no",
                                    "MATCH(name)": "REGEX(^EPG_W02_[A-Za-z0-9_-]*)",
                                    "pcEnfPref": "unenforced",
                                    "prefGrMemb": "include",
                                    "MATCH(prio)": "REGEX(^level[0-9])",
                                    "shutdown": "no"
                                },
                                "children":
                                [
                                    {
                                        "fvRsDomAtt":
                                        {
                                            "attributes":
                                            {
                                                "instrImedcy": "lazy",
                                                "resImedcy": "pre-provision",
                                                "STATUS": "MUST_NOT_EXIST"
                                            },
                                            "children":
                                            [
                                                {
                                                    "fvAEPgLagPolAtt":
                                                    {
                                                        "attributes":
                                                        {
                                                            "annotation": ""
                                                        },
                                                        "children":
                                                        [
                                                            {
                                                                "fvRsVmmVSwitchEnhancedLagPol":
                                                                {
                                                                    "attributes":
                                                                    {
                                                                        "MATCH(tDn)": "ENDS_WITH(LACP_SDN)"
                                                                    }
                                                                }
                                                            }
                                                        ]
                                                    }
                                                }
                                            ]
                                        }
                                    }
                                ]
                            }
                        }
                    ]
                }
            }
        ]
    }
}
-
-
Invalid Example of template-based compliance
-
In the following invalid example, if there is a BD named ABCXYZ, it will be selected by both the child object templates snippets for fvBD. This is a violation because you cannot allow two SELECT criteria to coexist for the same object time because as can lead to two different ways of selection and validation of objects. So type can either be regular or fc.
-
{
  "fvTenant":
  {
    "attributes":
    {
      "SELECT(name)": "EXACT(tenantABC)"
    },
    "children":
    [
      {
        "fvBD":
        {
          "attributes":
          {
            "MATCH(type)": "EXACT(regular)",
            "SELECT(name)": "REGEX(.*ABC.*)"
          }
        }
      },
      {
        "fvBD":
        {
          "attributes":
          {
            "MATCH(type)": "EXACT(fc)",
            "SELECT(name)": "REGEX(.*XYZ.*)"
          }
        }
      }
    ]
  }
}
Compliance rules
Compliance rules are created to generate anomalies where compliance can be violated or satisfied. Once you create compliance rules, you can generate the Compliance Report to check how much the fabrics and networks align to the rules.
Click Manage > Rules > Compliance Rules. This is where all the created rules are listed. The Compliance Rules page allows you to view all the rules created in one place.
You can perform the following actions on this page:
-
Edit or Delete a rule with the "…" button
-
Select multiple rules by clicking the checkbox and delete/edit them collectively
-
Create a new rule from the Create Compliance Rule button.
-
Filter the rules using search by the following attributes:
-
Name
-
Description
-
Rule Type
-
State
-
Last Modified Time
-
-
Click on any rule to view the slide-in that brings up the rule summary. It displays the following information:
-
General - Rule description, Fabric, and State
-
Settings - Rule type, objects used to create the rule, and the configuration compliance rules used.
-
-
Actions allows you to edit, delete and disable the rule.
Interpretation of Compliance Rules
The following table lists some examples of compliance rules and what condition they create.
|
Compliance Rule |
Condition Created |
|
Contains EPGs in tenants with names that start with "a" or ending with "z" |
EPGs in tenants such as "abz" that satisfy both criteria are included only once. |
|
Contains EPGs in tenants with names that start with "a" and are also in VRF instances where the tenant is "xyz" and the VRF instance name contains "c" |
When an EPG under tenant "abc" that is in a VRF instance with DN uni/tn-xyz/ctx-abcde is selected, verify that both the tenant and the VRF instance criteria match. An EPG under tenant "abc" that is in a VRF instance with DN uni/tn-xyz1/ctx-abcde is not selected because the VRF instance tenant does not match. |
|
Contains all EPGs under tenants that begin with "a" except those that contain "d" |
An EPG under tenant "abc" is selected. An EPG under tenant "abcd" is not selected. |
|
Contains all EPGs under tenants that begin with "a" except those EPGs that are also in the VRF instance with DN uni/tn-rrr/ctx-sss |
An EPG under tenant "abc" that is in a VRF instance with DN uni/tn-rrr/ctx-sss is selected because the VRF instance tenant matches. |
Compliance analysis
The Actions button allows you to re run the analysis.
The Summary displays the number of violations, the top rules by anomaly count, the anomalies from violations and the violations by rule type. You can click on any of the rules in 'Top rules by Violation' to view more details and click the count under 'Number of anomalies from violations' to view the list of anomalies.
The Anomalies from Violations lists all the anomalies that were triggered by the rules created. Click any rule in the 'Grouped' view to see the list of anomalies categorized under that group. If you click any rule in the 'Ungrouped' view, you will be redirected to the compliance rule detail page. This can be listed in a group view for all fabrics or individual view for a specific fabric. The table lists the severity level of the anomaly, the type of rule that triggered the anomaly, the detection time, and the status.
When you click any rule, it takes you to a slide-in that gives you a summary of your rule ( What’s wrong, What triggered this anomaly, What’s the impact?, How do I fix it? ).
Use search to filter by attributes like App Profile Name, BD Name, Category, Compliance Object Name, Compliance Object Type, Contract Name, EPG Name, Filter Name, L2 Out Name, L3 Out Name, Level, Rule Name, Subject Name, Tenant Name, and VRF Name. The gear icon is used to customize the columns in the table.
The Compliance Rules table shows a summary of the rules enforced and violated along with the number for each rule type. The table lists all the rules used to generate the current report. The table specifies whether it’s a configuration rule or a communication rule and the number of anomalies from violations for each rule.
Use search to filter by attributes like Name, Rule Type, Enforcement Status, and Verified. The Create Compliance Rule button takes you to the rule creation page.
Compliance anomalies
In the UI, you specify your compliance rules and Cisco Nexus Dashboard Insights will verify in the subsequent snapshots, whether the compliance rules are satisfied by the policy that is configured on Cisco APIC.
The number of anomalies raised is defined by the number of rules associated with a snapshot. For example, if an assurance group runs a compliance analysis on a snapshot every 15 minutes, and there are two rules associated with the snapshot, two anomalies will be raised.
Guidelines and limitations for compliance
Guidelines for compliance
-
A single compliance rule can be associated with multiple fabrics.
-
You can have a maximum of 30 active Communication Compliance rules and 600 active Configuration Compliance rules per fabric. If you exceed this limit, you cannot add more requirements in the Manage Compliance area.
-
When a compliance job is in progress for one or more fabrics, it is recommended that you do not start a bug scan for those fabrics.
-
Fabric list can be modified at any point in time.
-
Name of the rule is unique across fabrics.
-
Compliance is supported in the following Cisco APIC releases:
-
3.2(x) release
-
4.0(x) release
-
4.1(x) release
-
4.2(x) release
-
5.0(x) release
-
5.1(x) release
-
5.2(x) release
-
5.3(x) release
-
6.0(x) release
-
Guidelines for
-
When you create a compliance rule, you can add a custom description, which appears in the compliance violation anomaly.
-
Compliance Rules are created at the fabric level.
-
A compliance rule can either be offline or online.
Guidelines for
-
You can check the box to allow addition of new configuration objects. This will raise a violation for every new object which is missing in the uploaded configuration file.
Guidelines for compliance rule naming
-
Name should be a minimum of three characters
-
Name should not include special characters
-
Name should be unique.
-
No two rules can have the same name.
Verified scalability guidelines for
-
Number of Template rules are 5 for APIC with total configurable objects of 150,000.
-
Each template selects 15,000 objects on an average.
-
Number of tenants per template is 30 tenants, with each tenant selecting 500 objects on an average.
-
You may create more than 5 templates (the upper limit is 30 total rules), if the total objects selected by all the templates are less than 5*15,000 and the total configurations in APIC are < 150,000 objects.
-
You can have a maximum of 30 active Communication Compliance rules and 600 active Configuration Compliance rules per fabric.
Guidelines for
-
The template follows the same structure as used in APIC files. It has objects, attributes, and children.
-
The template file size that you upload can be up to 15 MB including white spaces. Pretty JSON files will have white spaces to support indentation. To reduce the file size, you can remove white spaces and upload the file.
-
In a template, defining attributes is mandatory because the Compliance is applied on the attribute.
-
In a template, defining children is optional. If children are defined in the query, the selection is applied to the real children of the selected objects.
-
In a template, you can include the same object type only once per child array. This prevents the possibility of creating requirements that will result in conflicting compliance rules that result in violation anomalies.
-
A JSON file is currently supported. XML file is not supported.
-
The template file size that you upload can be up to 15 MB. The view feature will not be available if the file size is greater than 5 MB. If the file size is greater than 5 MB, you can download the file and view the contents.
Limitations for Compliance Analysis
-
No telemetry is available for offline analysis.
-
The Compliance Rules table and Anomalies from Violations table will not be available for reports generated prior to release 6.4(1). You will have to run the analysis again to view the tables.
-
The compliance report is generated once every two hours.
Create compliance communication rule
-
Provide the name and description for your rule. You can choose to enable or disable the rule.
-
Select the fabrics you would like to apply the rule to. You can pick one, or many, or all fabrics.
-
In the Compliance Rule Type field, choose Communication.
-
Under Criteria, for the Communication Type field, choose the appropriate communication type. The options are Must Talk To, Must Not Talk To, May Talk To. The communication types are applied between two different object groups.
-
In the Object Type fields and the Traffic Selector area, choose the appropriate objects and traffic selector.
-
Select the appropriate criteria for both groups. Select any object type and the corresponding matching criteria object. See Matching criteria for the available object types and to understand how the various matching criteria objects can be defined.
-
After you define the criteria in the Add Criteria area, click the View Selected Objects link, and verify that the selected objects are appropriate. Based upon your selections of communication type and traffic selector rules, the compliance rule type that you defined will be displayed. See Communication compliance for more information about the communication types and the traffic selectors.
-
After you complete defining the objects, criteria, traffic restrictions as appropriate for your fabric/s, you can view the entire overview of the rule create and click Save Rule to complete the configuration.
-
When the rule is saved, you see the post success screen. You can choose to View compliance rules, View Compliance, or Create another Compliance rule from this page.
You can view/edit Direction based traffic settings from the Direction settings column.
Create compliance rule with snapshot selection
-
Under Compliance Rule Type, choose Configuration.
-
In the Base Configuration Settings field, choose Snapshot Settings.
-
In the Time of Snapshot field, choose the desired snapshot time, and click Apply.
-
In New Rule, click Save. Cisco Nexus Dashboard Insights starts performing a check.
-
To download the snapshot, click the Download link from Settings.
Create import configuration compliance
-
Under Compliance Rule Type, choose Configuration.
-
In the Base Configuration Settings field, choose Import Configuration. You cannot edit the configuration rules when you upload a JSON/XML file. In such a case, after uploading a file, you can view or download it by navigating from Actions.
-
Drag and drop your file into the provided field to upload. Click Save.
Create compliance rule with manual configuration
-
Provide the name and description for your rule. You can choose to Enable or Disable state.
-
Select the fabrics you would like to apply the rule to. You can pick one, or many, or all fabrics.
-
In the Compliance Rule Type field, choose Configuration
-
In the Base Configuration Settings field, choose Manual Configuration.
-
Under Object Selection, select the Object Type and add the criteria as appropriate. You can also view the selected objects with the 'View Selected Objects' button. Select any object type and the corresponding matching criteria object. See Matching criteria for the available object types and to understand how the various matching criteria objects can be defined. See Manual configuration compliance for information about the attribute requirements.
-
Add the rules for the matching criteria selected above here. Click 'Add Rule' and select the Attribute, Operator and Value for the rule.
The name and name alias attribute requirement has an additional option to select Matches Regular Expression.
-
You can view the entire overview of the rule you want to create and click Save Rule. Cisco Nexus Dashboard Insights to start performing a check based on the Naming compliance requirements that you specified.
-
When the rule is saved, you see the post success screen. You can choose to View compliance rules, View Compliance, or Create another Compliance rule from this page.
For BDs in context to VRFs, an extra requirement is needed. The EPG association requirement is to be added which requires an EPG association count. This can be equal to/at least/at most. However you can choose to add either the EPG Association Requirement or the Name and Attribute Requirement for BD. You cannot have all the attributes selected. See Manual configuration compliance.
Create template-based compliance
-
In the Base Configuration Settings field, choose Template Based Compliance.
-
In the Choose a file or drag and drop to upload area, upload your template based file.
-
After the file upload is complete, you can click the View icon to review the contents of the file that you uploaded.
-
Click Save.
For more information about template syntax, see Templates to configure object selectors. For information on how to configure object selectors for the template, see Templates to configure object selectors.
Trigger a compliance analysis
The Compliance Analysis will internally trigger assurance analysis and generate compliance anomalies.
-
Navigate to Analyze > Analysis Hub > Compliance.
-
Select a fabric from the dropdown menu.
-
Select the date for which you would like to see the report.
Templates to configure object selectors
When you create a configuration rule using manual configuration, only a few specific object selectors are supported (such as BD, EPG, VRF). By using a template, you can select any object and apply match criteria on its attributes.
An object can be any managed object from Cisco APIC, and its selection is based on the distinguished name of the object. If you prefer to have a different attribute as the selection criteria, you can use any valid attribute of that object. You can configure object selectors for selection and match criteria and based on tags and annotations.
Selection, status, and match criteria
For naming compliance, the compliance rules are on the name and nameAlias fields that are indicated by MATCH.
-
STATUS defines the state of the specific object in the template, whether an object exists or does not exist. The STATUS criteria can be defined using one of the following keywords.
-
MUST_EXIST
-
MUST_NOT_EXIST
The following is a syntax example:
{ "vzBrCP": { "attributes": { "STATUS": "(<status selected>)", "SELECT(name)":"<KEY_WORD>(<value>)", "MATCH(nameAlias/name)":"<KEY_WORD>(<value>)" } } } -
-
The SELECT and MATCH criteria can be defined using one of the following keywords. The MATCH criteria is used to define the Compliance rule. SELECT allows to define a criteria to select group of objects and MATCH allows to define attributes and values that those selected objects must have. These compliance rules will be applied on objects that are selected using the SELECT criteria.
-
STARTS_WITH
-
ENDS_WITH
-
EXACT
-
OR
-
REGEX
Syntax for SELECT:
SELECT(<attribute_name>): KEY_WORD(<value>)
Syntax for MATCH:
MATCH(<attribute_name>): KEY_WORD(<value>)
Attribute_name can be any attribute of the object. REGEX(<value>) - where the value must follow the standard regex expression syntax "SELECT(name)": "REGEX(Ctrct_[1-3])". For more details about keyword regular expressions, see Summary of Regular-Expressions Constructs.
The following is a syntax example:
{
   "<object>":
   {
      "attributes":
      {
         "SELECT(dn)":"<KEY_WORD>(<value>)",
         "MATCH(nameAlias/name)":"<KEY_WORD>(<value>)"
      }
   }
}
If SELECT is not specified for an attribute, then rn and dn will be considered as SELECT by default.
-
The following is a syntax example where if the KEY_WORD is not defined, the default behavior is EXACT. When you use MATCH(dn) and MATCH(rn), they are defined as match criteria.
If an attribute (other than dn and rn) does not have MATCH or SELECT specified, it will be considered as MATCH by default.
{
  "fvAEPg":
  {
    "attributes":
    {
      "SELECT(dn)": "uni/tn-aepg_vzanycons_imd_ctx_pass_7/ap-CTX1_AP1/epg-CTX1_BD1_AP1_EPG7",
      "MATCH(isAttrBasedEPg)": "EXACT(no)",
      "prio": "OR(unspecified, prio1)"
    }
  }
}
In the above example, by default, "prio" will be a MATCH.
Example template to configure a Naming Compliance to match selected objects to name or nameAlias:
{
   "vzSubj":
   {
      "attributes":
      {
         "SELECT(dn)":"EXACT(subj1)",
         "MATCH(nameAlias)":"STARTS_WITH(ABC)"
      }
   }
}
As the attribute dn is always considered as SELECT by default and any other attribute is always considered as MATCH, the above template can be simplified as displayed in the example below. Additionally, if the keyword is not defined, the default behavior is EXACT.
{
   "vzSubj":
   {
      "attributes":
      {
         "dn":"subj1""nameAlias":"STARTS_WITH(ABC)"
      }
   }
}
In the above template, you can use any object instead of "vzSubj", and you can use any attribute instead of "dn".
-
Template Syntax for {}
The following is a syntax example of a generic template where the KEY_WORD is {}. You can use this template to customize your requirements, select attributes, regular expresssions.
The KEY_WORD values can be as follows:
-
STARTS_WITH
-
ENDS_WITH
-
EXACT
-
OR
-
REGEX
{ "<MO type>": { "attributes": { "SELECT(<attribute>)": "KEY_WORD(<expression>)", "MATCH(<attribute>)": " KEY_WORD (<value>)" }, "children": [ { "<MO type>": { "attributes": { "SELECT(<attribute>)": " KEY_WORD (<value>)", "MATCH(<attribute>)": " KEY_WORD (<value>)" }, "children": [ { "<MO type>": { "attributes": { "SELECT((<attribute>)": " KEY_WORD (<value>)", "MATCH(<attribute>)": " KEY_WORD (<value>,<value>)" } } } ] } } ] } } -
-
Template With Attribute Value NULL or EMPTY
The following are examples of templates where the attribute value is null or empty.
"REGEX(^.{0}$)"
"EXACT()"
"OR(test, )" <— use space
{ "fvTenant": { "attributes": { "MATCH(annotation)": "OR(orchestrator:msc, )", "SELECT(name)": "REGEX(aepg_aepg_imd_tnt_pass_[0-9]+)", } } }
For the procedure to configure Object Selectors for Naming Compliance using the above template, see Create template-based compliance.
Tags and annotations
As an APIC user, you can create tags on managed objects (MOs) that result in creating child objects of type tagInst or tagAnnotation (based on which APIC version is in use).
Therefore, if you select objects based on a tag created in APIC, you can follow the templates provided in this section to configure object selectors on tags and annotations.
Example that displays the child object as type tagInst:
{
   "<object>":
   {
      "attributes":
      {
         "MATCH(<attribute_name>)":"<KEY_WORD(<value>)"
      },
      "children":
      [
         {
            "<tagInst>":
            {
               "attributes":
               {
                  "SELECT(<attribute_name>)":"<KEY_WORD(<value>)"
               }
            }
         }
      ]
   }
}
Example that displays the child object as type tagAnnotation:
{
   "<object>":
   {
      "attributes":
      {
         "MATCH(<attribute_name>)":"<KEY_WORD(<value>)"
      },
      "children":
      [
         {
            "<tagAnnotation>":
            {
               "attributes":
               {
                  "SELECT(<key or value>)":"<KEY_WORD(<value>)"
               }
            }
         }
      ]
   }
}
An object can be any valid APIC object with tagAnnotation or tagInst as a child. Object selection is defined in the tagInst or tagAnnotation object using SELECT on the name in the case of tagInst, and key or value in the case of tagAnnotation.
The selection criteria can be any of the following keywords:
-
STARTS_WITH
-
ENDS_WITH
-
EXACT
-
OR
-
REGEX
Compliance rules are defined at the parent object level using MATCH and the criteria can be defined using any KEY_WORD. tagInst or tagAnnotation do not participate in compliance rules as they only provide the selection criteria.
Example template where you SELECT all the fVBDs where the tag is “BDs_in_cisco”, and those BDs must have name as BD or app1BD.
{
   "fvBD":
   {
      "attributes":
      {
         "MATCH(name)":"OR(BD, app1BD)"
      },
      "children":
      [
         {
            "tagInst":
            {
               "attributes":
               {
                  "SELECT(name)":"EXACT(BDs_in_cisco)"
               }
            }
         }
      ]
   }
}
For the procedure to configure object selectors based on Tags and Annotations using a template, see Create template-based compliance.
When using the steps to Create template-based compliance, to configure object selectors for tags and annotations, you must perform an additional step. Before you click Save, in Create New Rule, you must check the checkbox for the field Enable Object Selection Based on tagAnnotation/tagInst. Therefore, if any object has a tag annotation or tagInst, the parent based on the selection criteria in these two objects will be selected.
Communication compliance
Communication types
-
Must Talk To: This allows you to configure objects where selector A must talk to objects selected by selector B under defined traffic restriction rules.
-
Must Not Talk To: Choose this configuration if your intention is that an object selected by object selector A must not talk to objects selected by object selector B using a defined type of traffic. The traffic restriction rule is optional in this configuration.
Two different types of communication compliances can be configured using this option:
-
Traffic Restriction compliance: You can specify a traffic selector rule that objects selected by selector A must not talk to objects selected by selector B, using a selected type of traffic that uses traffic restriction rules. This communication is restricted.
-
Segmentation compliance: By not defining a traffic selector rule, you can configure segmentation compliance where objects in selector A cannot talk to objects in selector B using any type of traffic. In this case, no traffic restriction rules are defined by you.
-
-
May Talk To: This allows you to create a traffic restriction compliance. Objects selected by selector A may talk to objects selected by selector B using only a specific type of traffic using traffic restriction rules.
As a Nexus Dashboard Insights user, to verify that EPG A can talk to EPG B using the traffic type TCP IP, configure the traffic restriction rule EPG A May Talk To EPG B using TCP IP.
Communication type and traffic selector rules selections with the resultant compliance rule type
| Communication Type | Select a Traffic Selector Rule? | Objects You Can Select | Compliance Requirement Type |
|---|---|---|---|
|
Must Talk To |
Mandatory to select |
EPG |
Service Level Agreement (SLA) |
|
Must Not Talk To |
Not mandatory to select |
|
|
|
May Talk To |
Mandatory to select |
EPG |
Traffic Restriction |
Traffic selector rules available
| Ether Type | Protocol Type |
|---|---|
|
ARP |
- |
|
FCOE |
- |
|
IP |
|
|
MAC_SECURITY |
- |
|
MPLS_UNICAST |
- |
|
TRILL |
- |
Manual configuration compliance
Attribute requirement that can be set according to the objects selected
| Object | Associated Attributes |
|---|---|
|
EPG |
The associated attributes are:
|
|
VRF |
The associated attributes are:
|
|
Bridge Domain (BD) |
The attributes are:
|
BD to EPG relationship configuration
With this feature, you can specify a BD selector to have a fixed number of EPGs. By configuring a BD compliance rule, you can set the maximum number of EPGs with which a BD can be associated.
As a result of this compliance rule, when the requirement set is not satisfied, a violation anomaly will be raised. If the requirement is satisfied, it will raise an enforcement anomaly. Only when the BD selector is not resolved, a warning anomaly will be generated.
The user can configure a requirement to verify that a specified number of EPGs are being associated with a BD. The supported operators for this requirement are At least /At most /Equal to. As an example, if a requirement is configured that the BD must have at least 5 EPGs associated, violation anomalies will be raised if the BD has less than 5 EPGs (0-4). However, if the BD has >= 5 anomalies, then an enforcement anomaly will be raised.
Matching criteria
Objects available as matching criteria for a selected object type
| Object Type | Matching Criteria Object |
|---|---|
|
EPG |
|
|
Tenant |
|
|
BD |
|
|
VRF |
|
|
Contract |
|
|
Subject |
|
|
Filter |
|
Define matching criteria objects
| Matching Criteria Object Type 1 | How to define |
|---|---|
|
Tenant |
tn - operator value Object type 2 (Could be either VRF or BD)
tn - operator value ctx - operator value
tn - operator value bd - operator value |
|
VRF |
tn - operator value ctx - operator value |
|
BD |
tn - operator value bd - operator value |
|
EPG |
tn - operator value ap - operator value epg - operator value |
|
App Profile |
tn - operator value ap - operator value |
|
L3 Out |
tn - operator value out - operator value |
|
L3 InstP |
tn - operator value out - operator value instp - operator value |
|
L2 Out |
tn - operator value l2out - operator value |
|
L2 InstP |
tn - operator value l2out - operator value instp - operator value |
|
Contract |
tn - operator value brc - operator value |
|
Subject |
tn - operator value brc - operator value subj - operator value |
|
Filter |
tn - operator value flt - operator value |
operator and value can be set to anything.
Operators for custom definitions
| Operator | Description |
|---|---|
|
Must Equal to |
This operator returns an exact match of the specified value. |
|
Must Not Equal to |
This operator returns all that do not have the same value. |
|
Must Contain |
This operator returns all that contain the specified value. |
|
Must not contain |
This operator returns all that do not contain the specified value. |
|
Must begin with |
This operator returns all that begin with the specified value. |
|
Must end with |
This operator returns all that end with the specified value. |
|
Must not begin with |
This operator returns all that do not begin with the specified value. |
|
Must not end with |
This operator returns all that do not end with the specified value. |
Conformance Report
Conformance Report
Conformance report enables you to visualize and understand the lifecycle of your hardware and software in the network. This assists you in planning upgrades and hardware refresh. Conformance Report is generated everyday for each fabric for hardware and software conformance and weekly for each fabric for scale conformance. In the report you can view the conformance status of software, hardware, combination of both software and hardware, and scale conformance status for fabrics.
You can use Conformance Report to view current and project the future status of software and hardware inventory in your network against known EoS and EoL notices to ensure conformance. You can also monitor scale conformance status for onboarded fabrics.
Conformance Report displays the summary of conformance status for software, hardware, and scale for selected fabrics.
In the Conformance report, for hardware and software conformance switches are classified into 3 severities based on the software release or hardware platform EoL dates and end of PSIRT dates. The severities include:
The End of SW Maintenance Releases Date in the End-of-Sale and End-of-Life Announcement and the end of PSIRT date is used as reference milestone to classify the inventory into a category of Critical, Warning, or Healthy.
In the Conformance report, the scale conformance status for fabrics is based on Cisco’s Verified Scalability Guidelines for the software version running in switches and controllers when applicable. The severities include:
Access Conformance Report
Navigate to Analyze > Analysis Hub > Conformance.
Choose a fabric from the drop-down list.
OR
Navigate to Manage > Fabrics.
Choose a fabric.
In the General section, click Conformance.
Click View Report.
View Conformance Report
You can save conformance report as a PDF with the browser print option (Only supported on Chrome and Firefox).
-
Navigate to a Conformance Report. See Access Conformance Report.
-
Choose a fabric or All Fabrics from the drop-down menu.
-
Choose a current month or a previous month from the drop-down menu. You can choose a previous month only if previous month reports are available.
Conformance Report displays the conformance summary, hardware and software conformance, and scale conformance.
-
The Summary page displays devices by hardware conformance status, devices by software conformance status and scale conformance status for fabrics or switches. Click View Conformance Criteria to learn more.
-
The Hardware or Software page displays conformance status, conformance outlook, and device details.
-
In the Conformance Outlook section, click Overall, or Software, or Hardware to view the conformance for software and hardware, software only or hardware only.
-
The Device Details lists details for hardware and software.
-
The details for hardware include device name, fabric name, hardware conformance status, model, role, hardware end of vulnerability support for a particular device. Click the device name to view additional details.
-
The details for software include device name, fabric name, software conformance status, model, software version, role, software end of vulnerability support for a particular device. Click the device name to view additional details.
-
Use search to filter by attributes such as device, fabric, hardware conformance status, software conformance status, model, software version, and role.
-
Use the gear icon to customize the columns in the table.
-
-
The Scale page displays all fabrics summary, scale conformance, and scale metrics.
-
The All fabrics Summary section displays overall scale conformance level, top 5 switches by scalability metric violations, scalability metrics for controller and switches, and total scalability metrics violations.
-
Click View Conformance Criteria to learn more.
-
The Scale Conformance section displays the scale conformance for controller and switch in the last 6 months if the scale reports for previous months are available.
-
The All Scale Metrics section displays the scale metrics details for fabrics and switches. The All Scale Metrics section displays if you choose All Fabrics from the drop-down menu.
-
The details for fabrics include fabric name, type, software version, controller metrics conformance, switch metrics conformance. Click the fabric name to view additional details.
-
The details for switches include switch name, fabric name, software version, model, forward scale profile, metrics conformance. Click the switch name to view additional details.
-
Use search to filter by attributes such as fabric, type, software version.
-
Use the gear icon to customize the columns in the table.
-
-
The Fabric Level Scale Metrics and Switch Level Scale Metrics displays the scale metrics details for a fabric and switches associated with the fabric. These sections are dispayed, if you choose one fabric from the drop-down menu.
-
The details for a fabric include metric, conformance status, and resource usage,
-
The details for switches include switch name, fabric name, software version, model, forward scale profile, metrics conformance. Click the switch name to view additional details.
-
-
-
From the Actions menu, click Run Report to run an on-demand report.
Policy CAM
About Policy CAM
The Policy CAM feature determines how and where resources in the fabric are used. Policy CAM provides information about the resource utilization in the network, and the amount of policy content-addressable memory (Policy CAM) utilization.
Navigate to Analyze > Analysis Hub > Policy CAM.
After you get to Policy CAM, choose a fabric, choose the appropriate snapshot of time within which to view the resource utilization, and click Apply.
Within the time range you chosen, the last snapshot is considered for each of the fabrics included in the fabric. Therefore, you get the latest state of the application within the chosen time range.
Policy CAM Analyzer displays the following information:
-
Associated Policies
-
Policy CAM Statistics
-
Policy CAM Rules
-
All Anomalies
In Nexus Dashboard Insights release 6.3.1.15, Policy CAM is not supported on Cisco Nexus 9000 FX3 switches. In Nexus Dashboard Insights release 6.3.1.40 and later, Policy CAM is supported on Cisco Nexus 9000 FX3 switches.
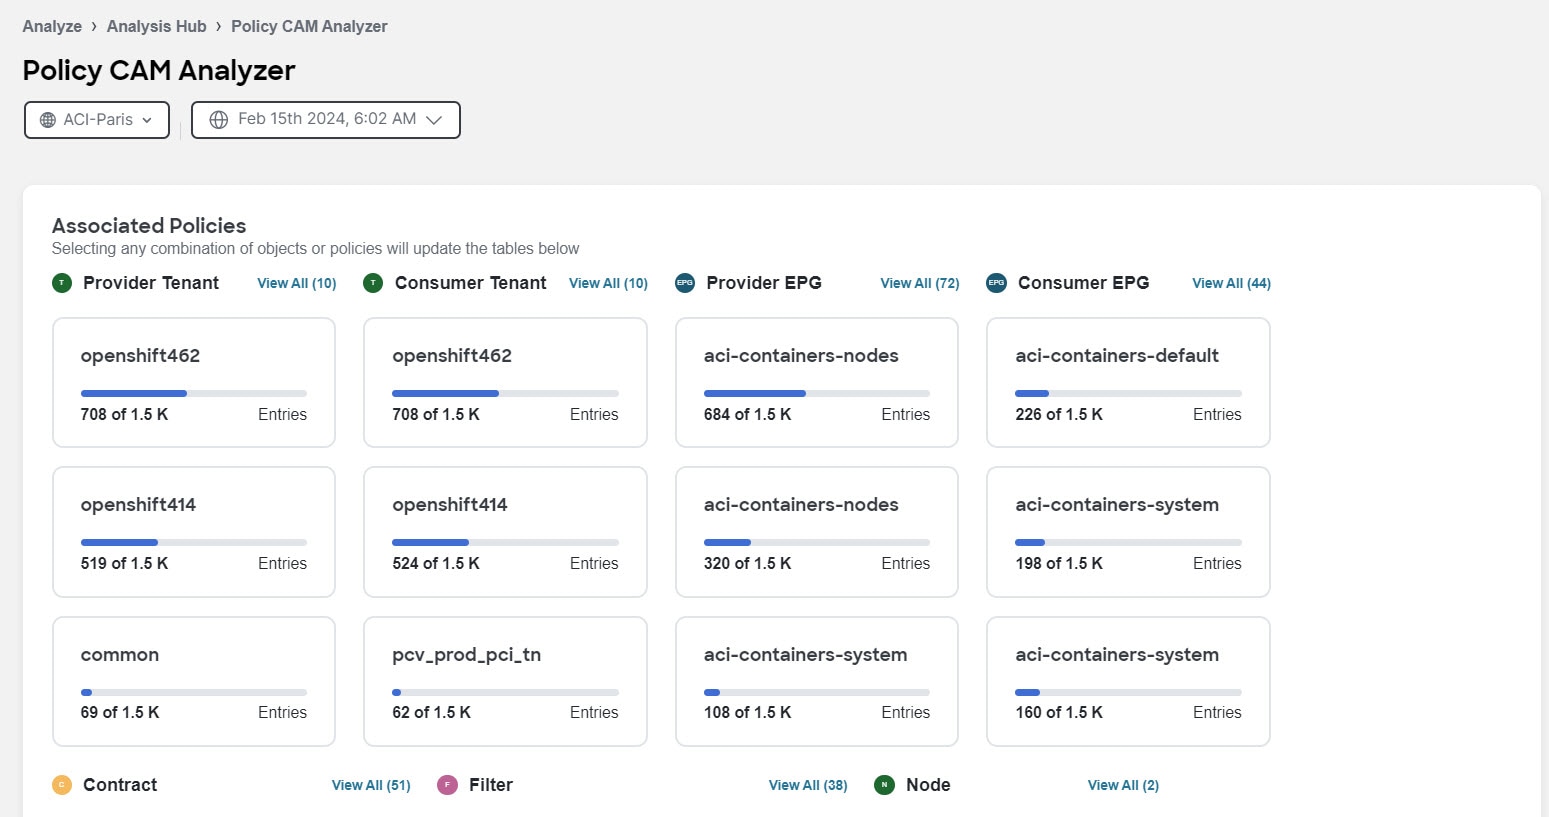
Associated Policies
Associated policies lists the various objects or policies available. When the policies are viewed in a top to down manner, the lists start with the node that has the maximum utilization followed by the next lower utilization. Each item in each column can be chosen to show relevant associations and relationships between the tenants, contracts, and EPGs.
Click View All to view all the nodes for the chosen object in a side panel.
The following objects or policies are available:
-
Provider Tenant
-
Consumer Tenant
-
Provider EPG
-
Consumer EPG
-
Contract
-
Filter
-
Node
Click any of the objects to show all related objects and policies.
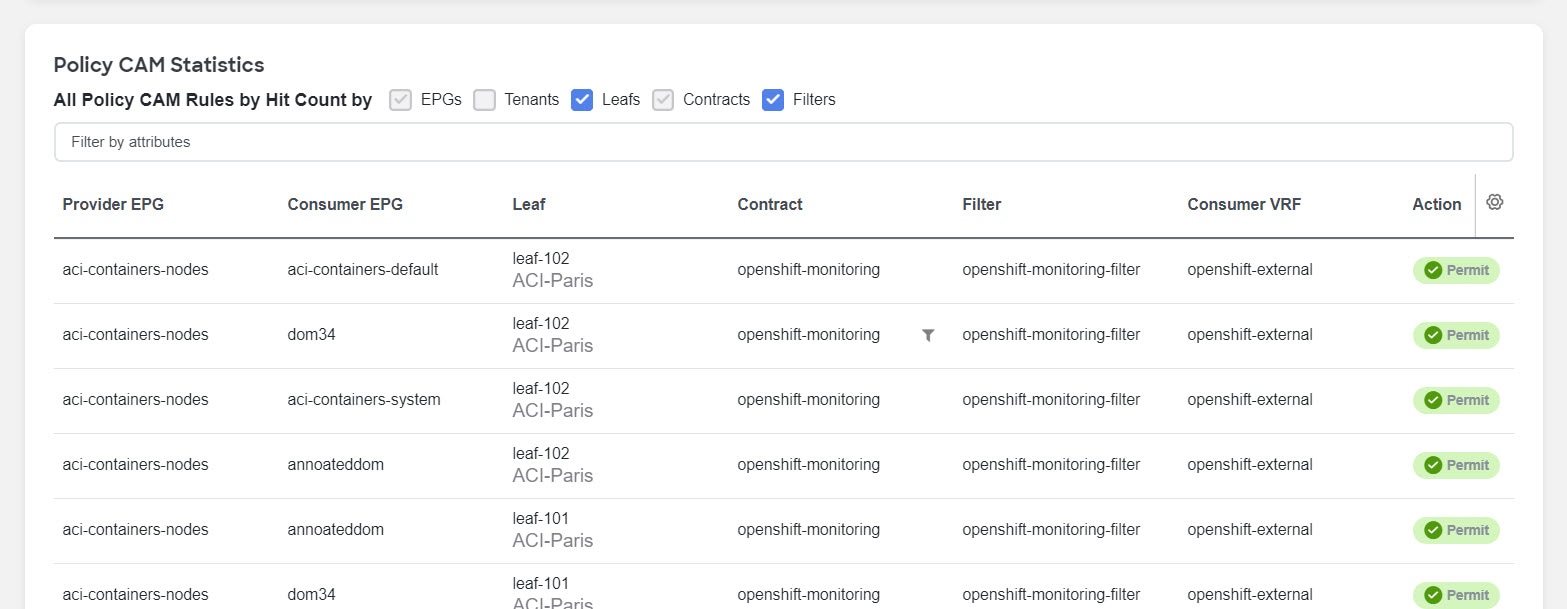
Policy CAM Statistics
The policy CAM statistics displays all the nodes and associated rules, and you can drill into details for a specific node here. Click the checkboxes for objects you want to see in the table.
The following objects are available:
-
EPGs
-
Tenants
-
Leafs
-
Contracts
-
Filters
You can filter the table based on the following attributes:
-
Provider EPG
-
Consumer EPG
-
Leaf
-
Contract
-
Filter
-
Consumer VRF
-
Action
The table also shows the hit count in the following timeline:
-
1 month
-
1 week
-
1 hour
-
Cumulative
The gear icon allows you to toggle columns to customize the table as per your view.
Policy CAM Rules
In the Policy CAM Rules table, you can view the listings for all of the nodes based on the chosen snapshot.
You can filter the table based on the following attributes:
-
Leaf
-
Provider EPG
-
Consumer EPG
-
Contract
-
Filter
-
Rule
-
Provider Tenant name
-
Consumer Tenant name
-
Consumer VRF
The following details are available in the Rules table:
-
Leaf
-
Provider EPG
-
Consumer EPG
-
Contract
-
Filter
-
Rule
-
Valid Hardware Entry Count
-
Provider Tenant name
-
Consumer Tenant name
-
Consumer VRF
The gear icon allows you to toggle columns to customize the table as per your view.
All Anomalies
In the Anomalies table, you can view the anomalies that are generated in the chosen snapshot of time, individually by nodes or as an aggregate.
You can filter the anomalies based on the following attributes:
-
Anomaly Level
-
App Profile Name
-
Attachable Access Entity Profiles name
-
BD Name
-
Concrete Device
-
Concrete Interface
-
Consumer App Profile Name
-
Consumer EPG name
-
Contract
-
Contract Name
-
Device Cluster
-
Device Cluster Interface
-
Device Selection Policy
-
EPG name
-
Encap VLAN
-
Fabric IP
-
Filter name
-
Interface Policy Group Name
-
Internal/External
-
L2 Out Name
-
L3 Out Name
-
Leaf Interface Profile Name
-
Leaf Profile Name
-
Logical Interface Context
-
Physical Domains Name
-
Provider App Profile Name
-
Provider EPG Name
-
Provider Tenant Name
-
Rule Name
-
Fabrics
-
Spine Name
-
Tenant Name
-
Virtual Port Channel
Connectivity Analysis
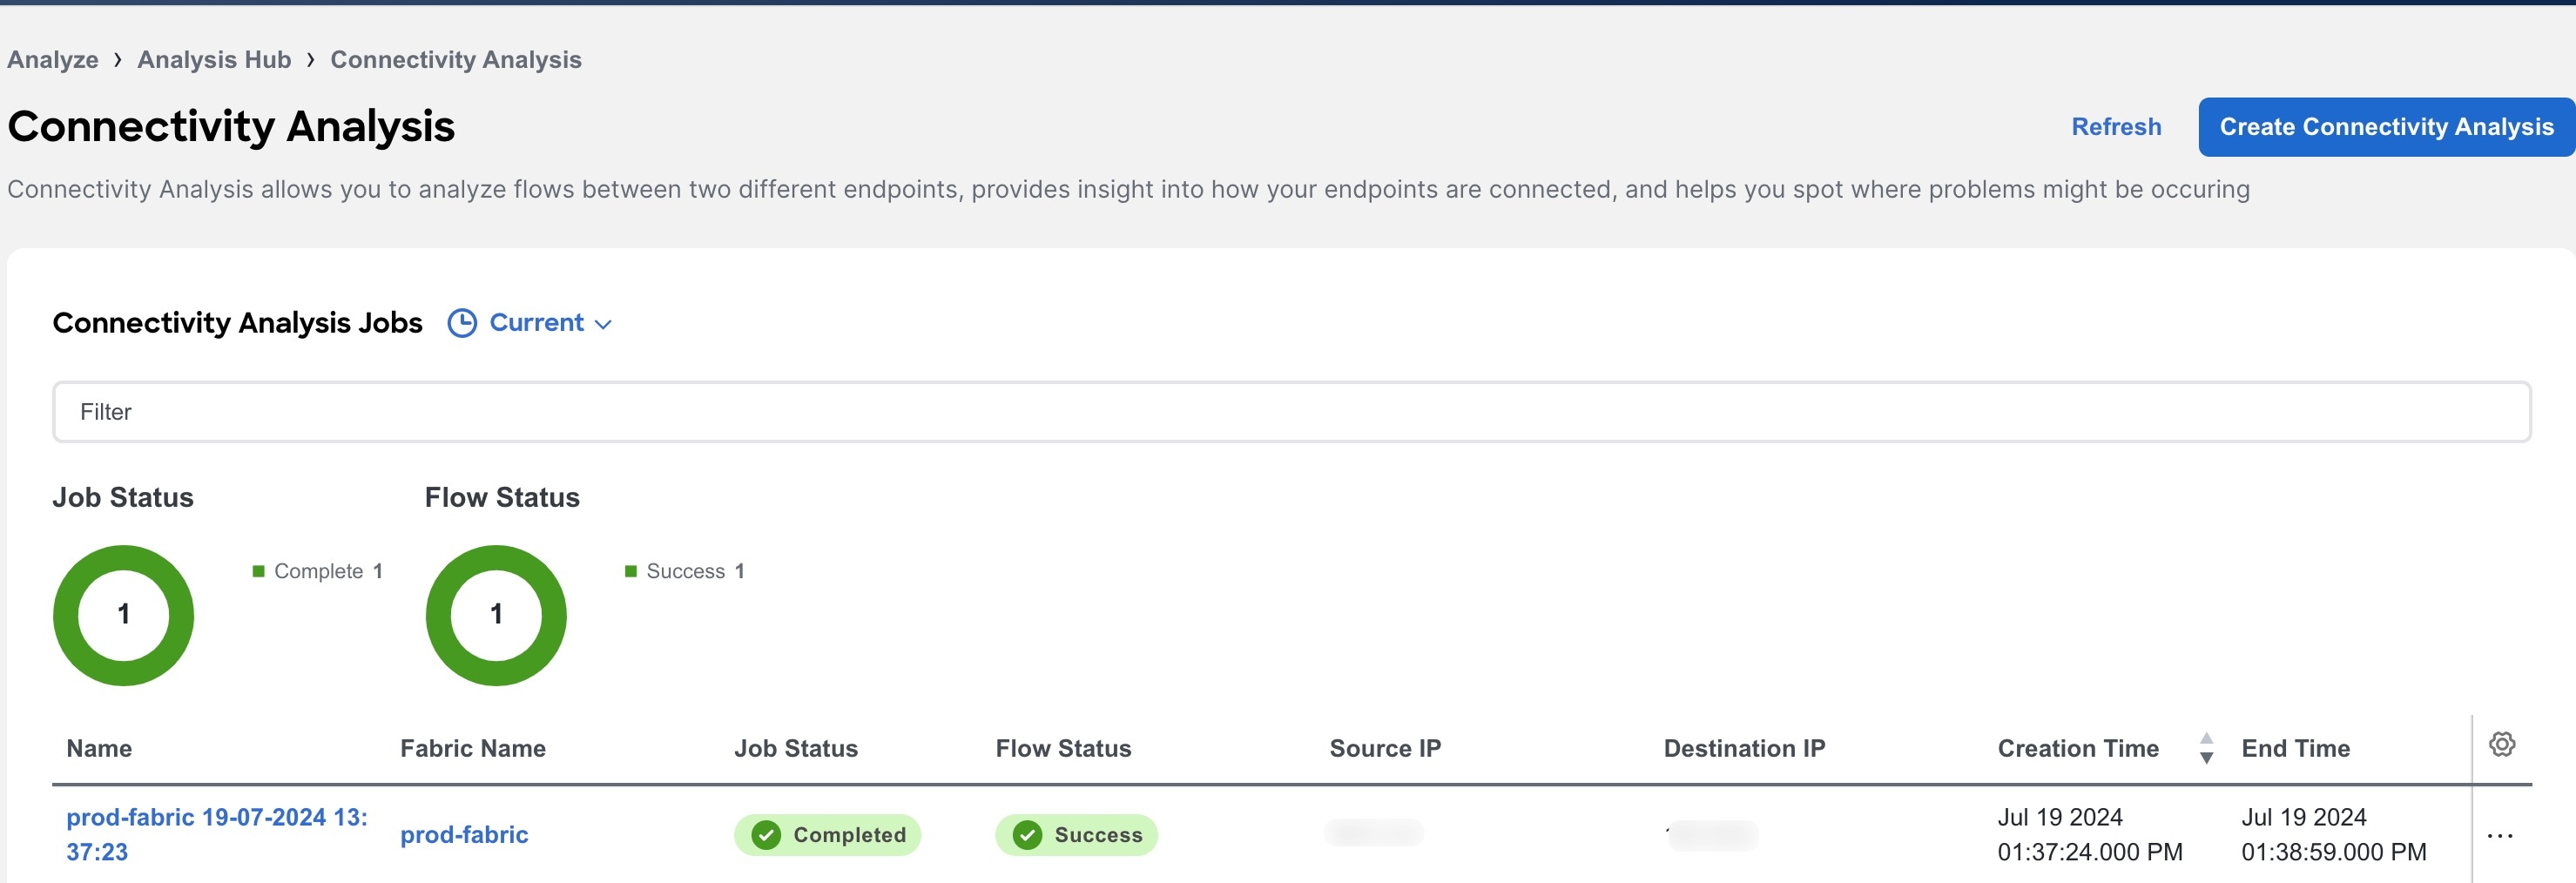
Connectivity Analysis
Connectivity Analysis allows you to analyze flows between two different endpoints, provide insight into how your endpoints are connected, and helps you spot where problems might be occurring.
Connectivity Analysis detects and isolates offending nodes in the network for a given flow and includes the following functionalities:
-
Traces all possible forwarding paths for a given flow across source to destination endpoints.
-
Identifies the offending device with issue, resulting in the flow drop.
-
Helps troubleshoot to narrow down the root cause of the issue, including running forwarding path checks, software and hardware states programming consistencies through consistency-checks, and further details related to packets walkthrough.
Connectivity Analysis Option
Embedded Logic Analyzer Module (ELAM) - ELAM is a diagnostic tool that helps troubleshoot ethernet traffic flows. It captures the packet from an active flow and analyzes the ethernet frames for packet drops. ELAM requires an active flow between the source and destination hosts. You can enable this option to analyze an available active flow.
The checks performed for Connectivity Analysis include:
-
Topology checks such as overall health, connectivity of leaf switch, spine switch, or remote leaf switch
-
VRF and BD mappings for endpoints
-
Interfaces connectivity such as PC, VPC, SVI, Breakouts, SubIfs
-
Routing tables, EPM, and EPMC tables
-
L3Out information and mapping
-
Adjacency (ARP) tables
-
Tunnel information
-
Synthetic routes (COOP) tables on spine switches
Guidelines and Limitations
-
You can submit up to 10 jobs per fabric.
-
At any point of time, you can run only 1 connectivity analysis job per fabric. You can stop a job in the queue and run another job.
-
Connectivity Analysis feature is supported on Cisco APIC release 6.0(2h) and Cisco ACI Switch release 16.0(2h) and later. Cisco Nexus Insights Cloud Connector (NICC) app version 3.0.0.350 is pre-packaged with Cisco APIC release 6.0(2h) and is required for this feature. If a latest release of NICC is available, a banner New version is available for update is displayed. We recommend that you update to the latest version.
-
You can run Connectivity Analysis only on online fabrics.
Supported Topologies
-
Endpoint combinations:
-
EP-EP
-
EP-L3Out
-
L3Out-EP
-
L3Out-L3Out
-
-
Conversation types:
-
L2, L3, L4 (TCP/UDP)
-
V4 and V6 support
-
Transit and Proxy flows
-
Shared Service
-
-
Topologies:
-
Single-Pod and Multi-Pod
-
Remote Leaf-Direct
-
M-Topology (stretched fabric design)
-
vPC
-
3-tier architectures
-
Create Connectivity Analysis.
-
Navigate to Analyze > Analysis Hub > Connectivity Analysis.
-
Click Create Connectivity Analysis.
-
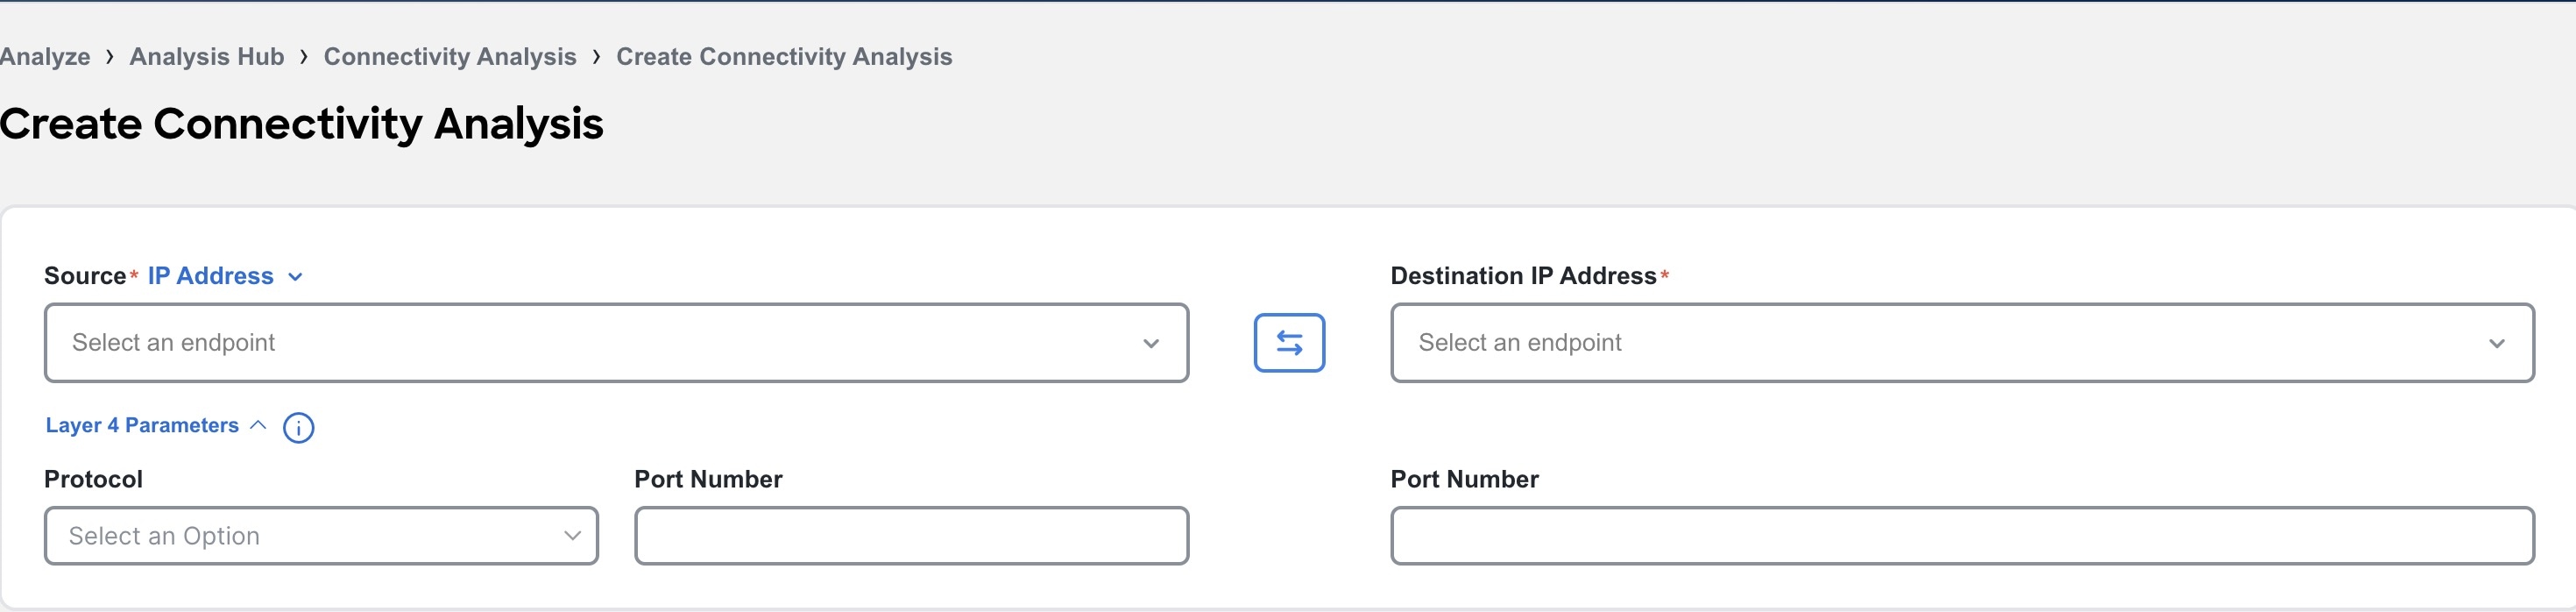
Complete the following for Layer2 and Layer 3 parameters.
-
From the Source drop-down list choose IP address or MAC address to analyze the flow between two endpoints.
-
Choose the source endpoint from the drop-down list or enter the endpoint. A maximum of 20 IP or MAC addresses are displayed at a given time.
-
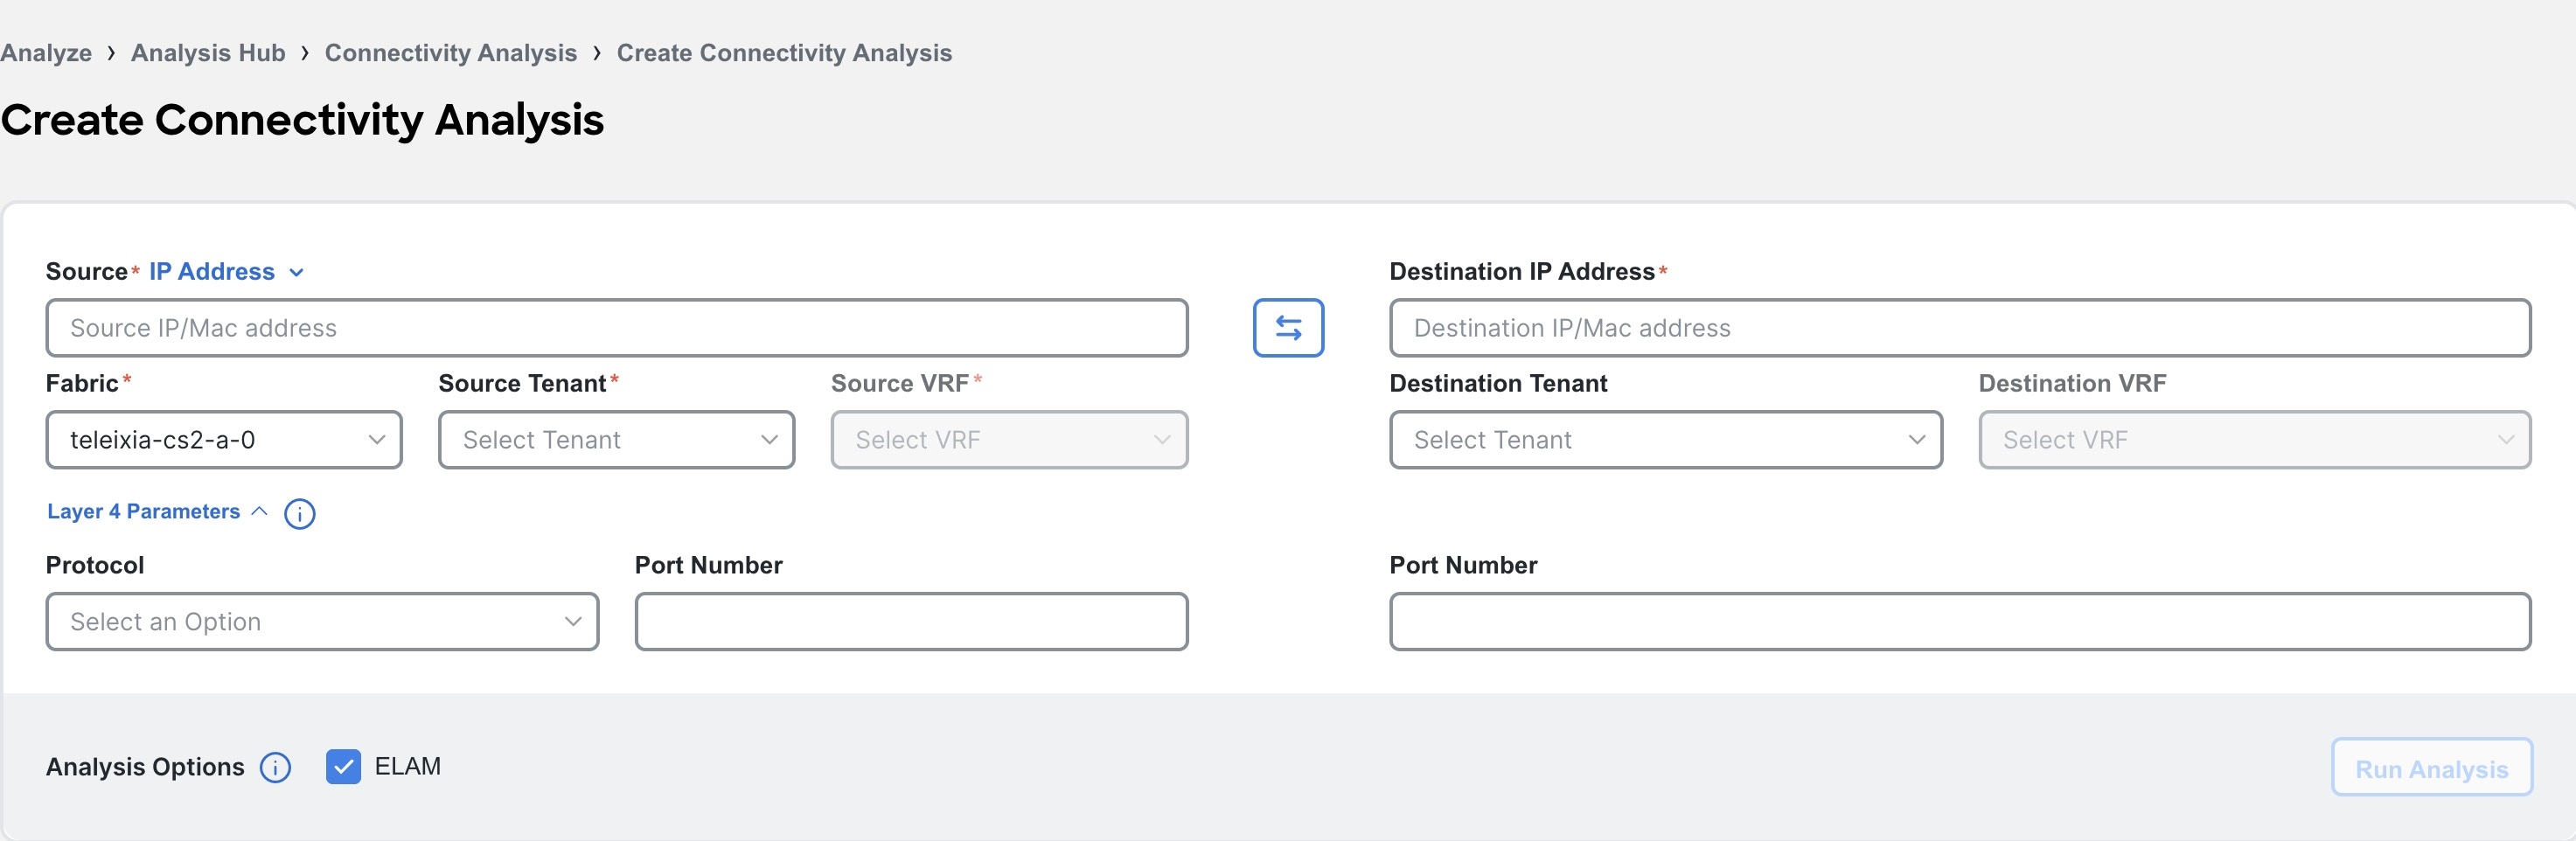
You can also manually populate the Layer2 and Layer 3 parameters. Click Edit Details Manually to enter the source IP or MAC address, destination IP or MAC address, fabric type, source tenant, source VRF, destination tenant, and destination VRF.
-
From the Destination drop-down list choose IP address or MAC address to analyze the flow between two endpoints.
-
Choose the destination endpoint from the drop-down list or enter the destination endpoint.
-
-
Complete the following for Layer 4 parameters.
-
From the Protocol drop-down menu, choose TCP or UDP protocol.
-
Enter the source and destination port number.
-
-
Select the Analysis Option.
-
Check ELAM option to analyze an available active flow.
-
-
Click Run Analysis.
-
After the Connectivity Analysis is completed, the analysis is displayed in the Connectivity Analysis Jobs table. Navigate to Analyze > Analysis Hub > Connectivity Analysis to view the Connectivity Analysis Jobs. The Analysis is assigned a default name and you can rename the analysis.
-
Select the analysis and then from the Actions drop-down menu click Rename Analysis to rename.
-
OR
-
Click on analysis name. In the View Connectivity Analysis page, from the Actions drop-down menu click Rename Analysis to rename.
View Connectivity Analysis
-
Navigate to Analyze > Analysis Hub > Connectivity Analysis. The Connectivity Analysis jobs are displayed.
-
Choose a time range from the drop-down menu.
-
The Summary area displays the overall status of the Connectivity Analysis jobs and the flow status.
-
Use the filter bar to filter the analysis. The Connectivity Analysis table displays filtered jobs.
-
Click the column heading to sort the jobs in the table.
-
Click the gear icon to configure the columns in the table.
-
Hover around a failed Flow Status to learn more.
-
-
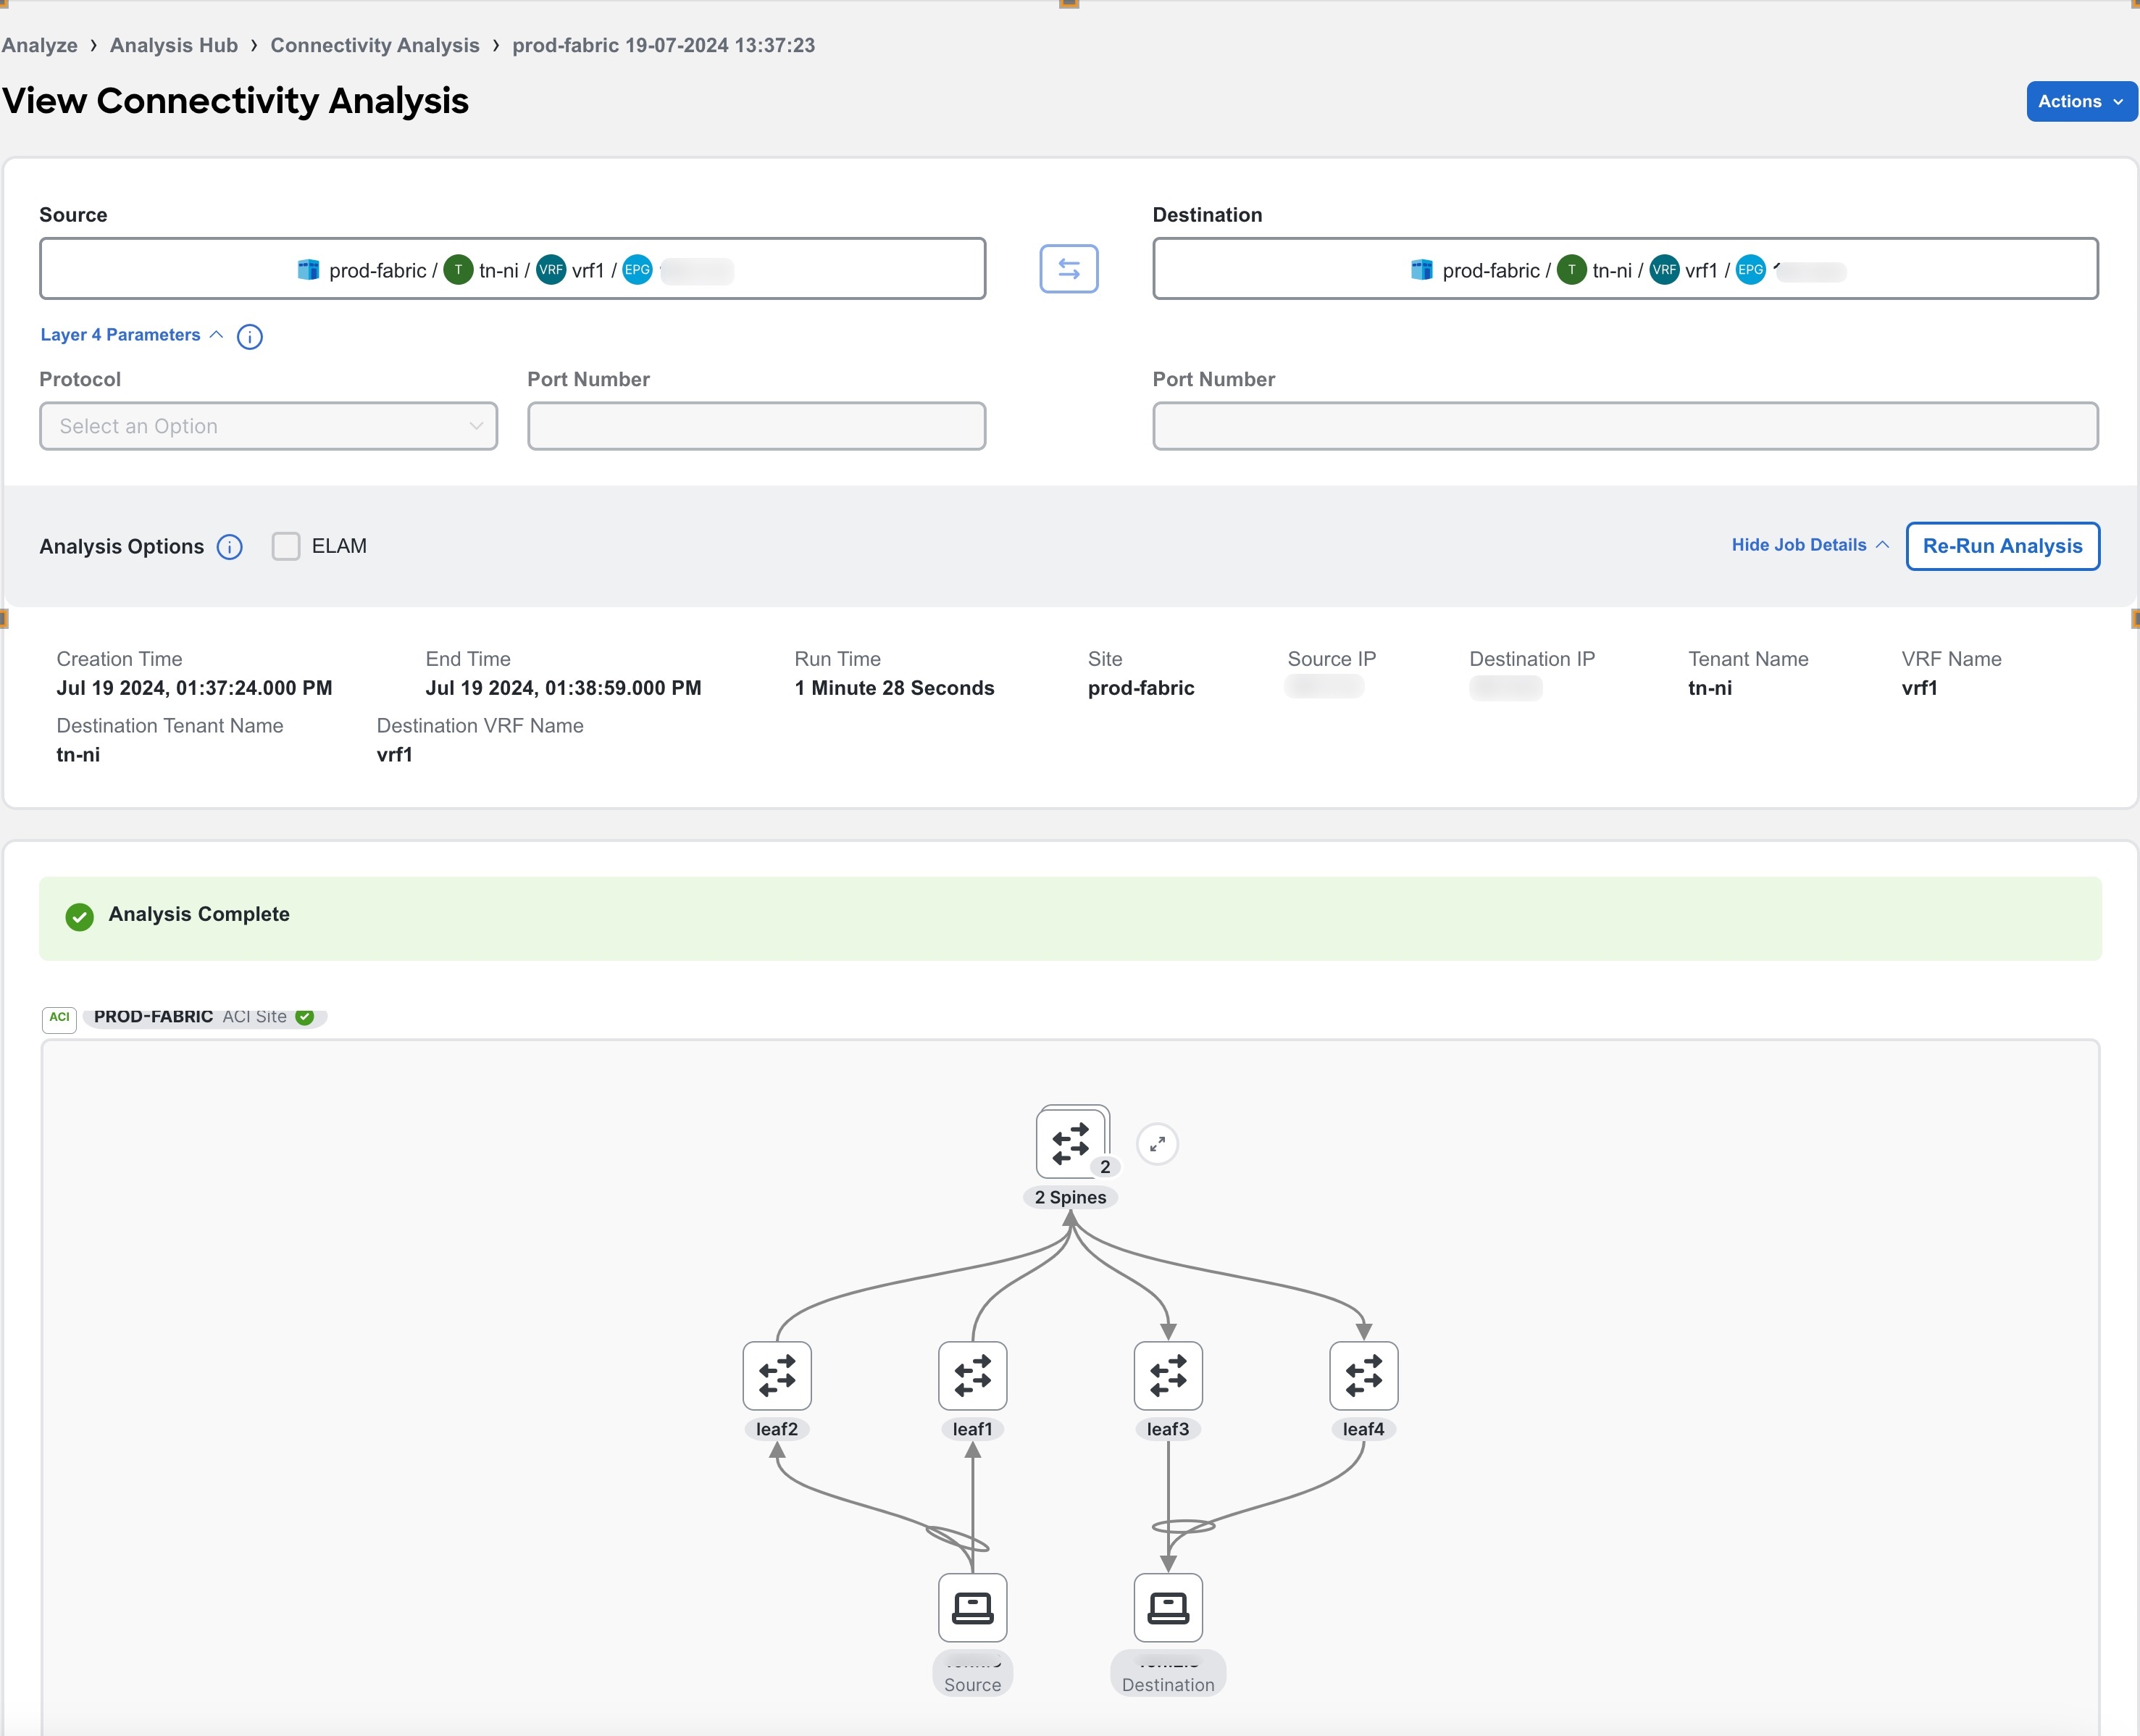
Click Name to view Connectivity Analysis details. The View Connectivity Analysis page displays the input parameters you had entered for the job, the job details, and topology.
-
Click Show Job Details to view the job details such as creation time, end time, run time, fabric, source IP, destination IP, source VRF name, source tenant name, destination tenant name, and destination tenant name. The banner displays the status of the job. A green banner represents a successful analysis and a red banner represents a failed analysis.
-
Click Re-run Analysis to run the analysis again.
-
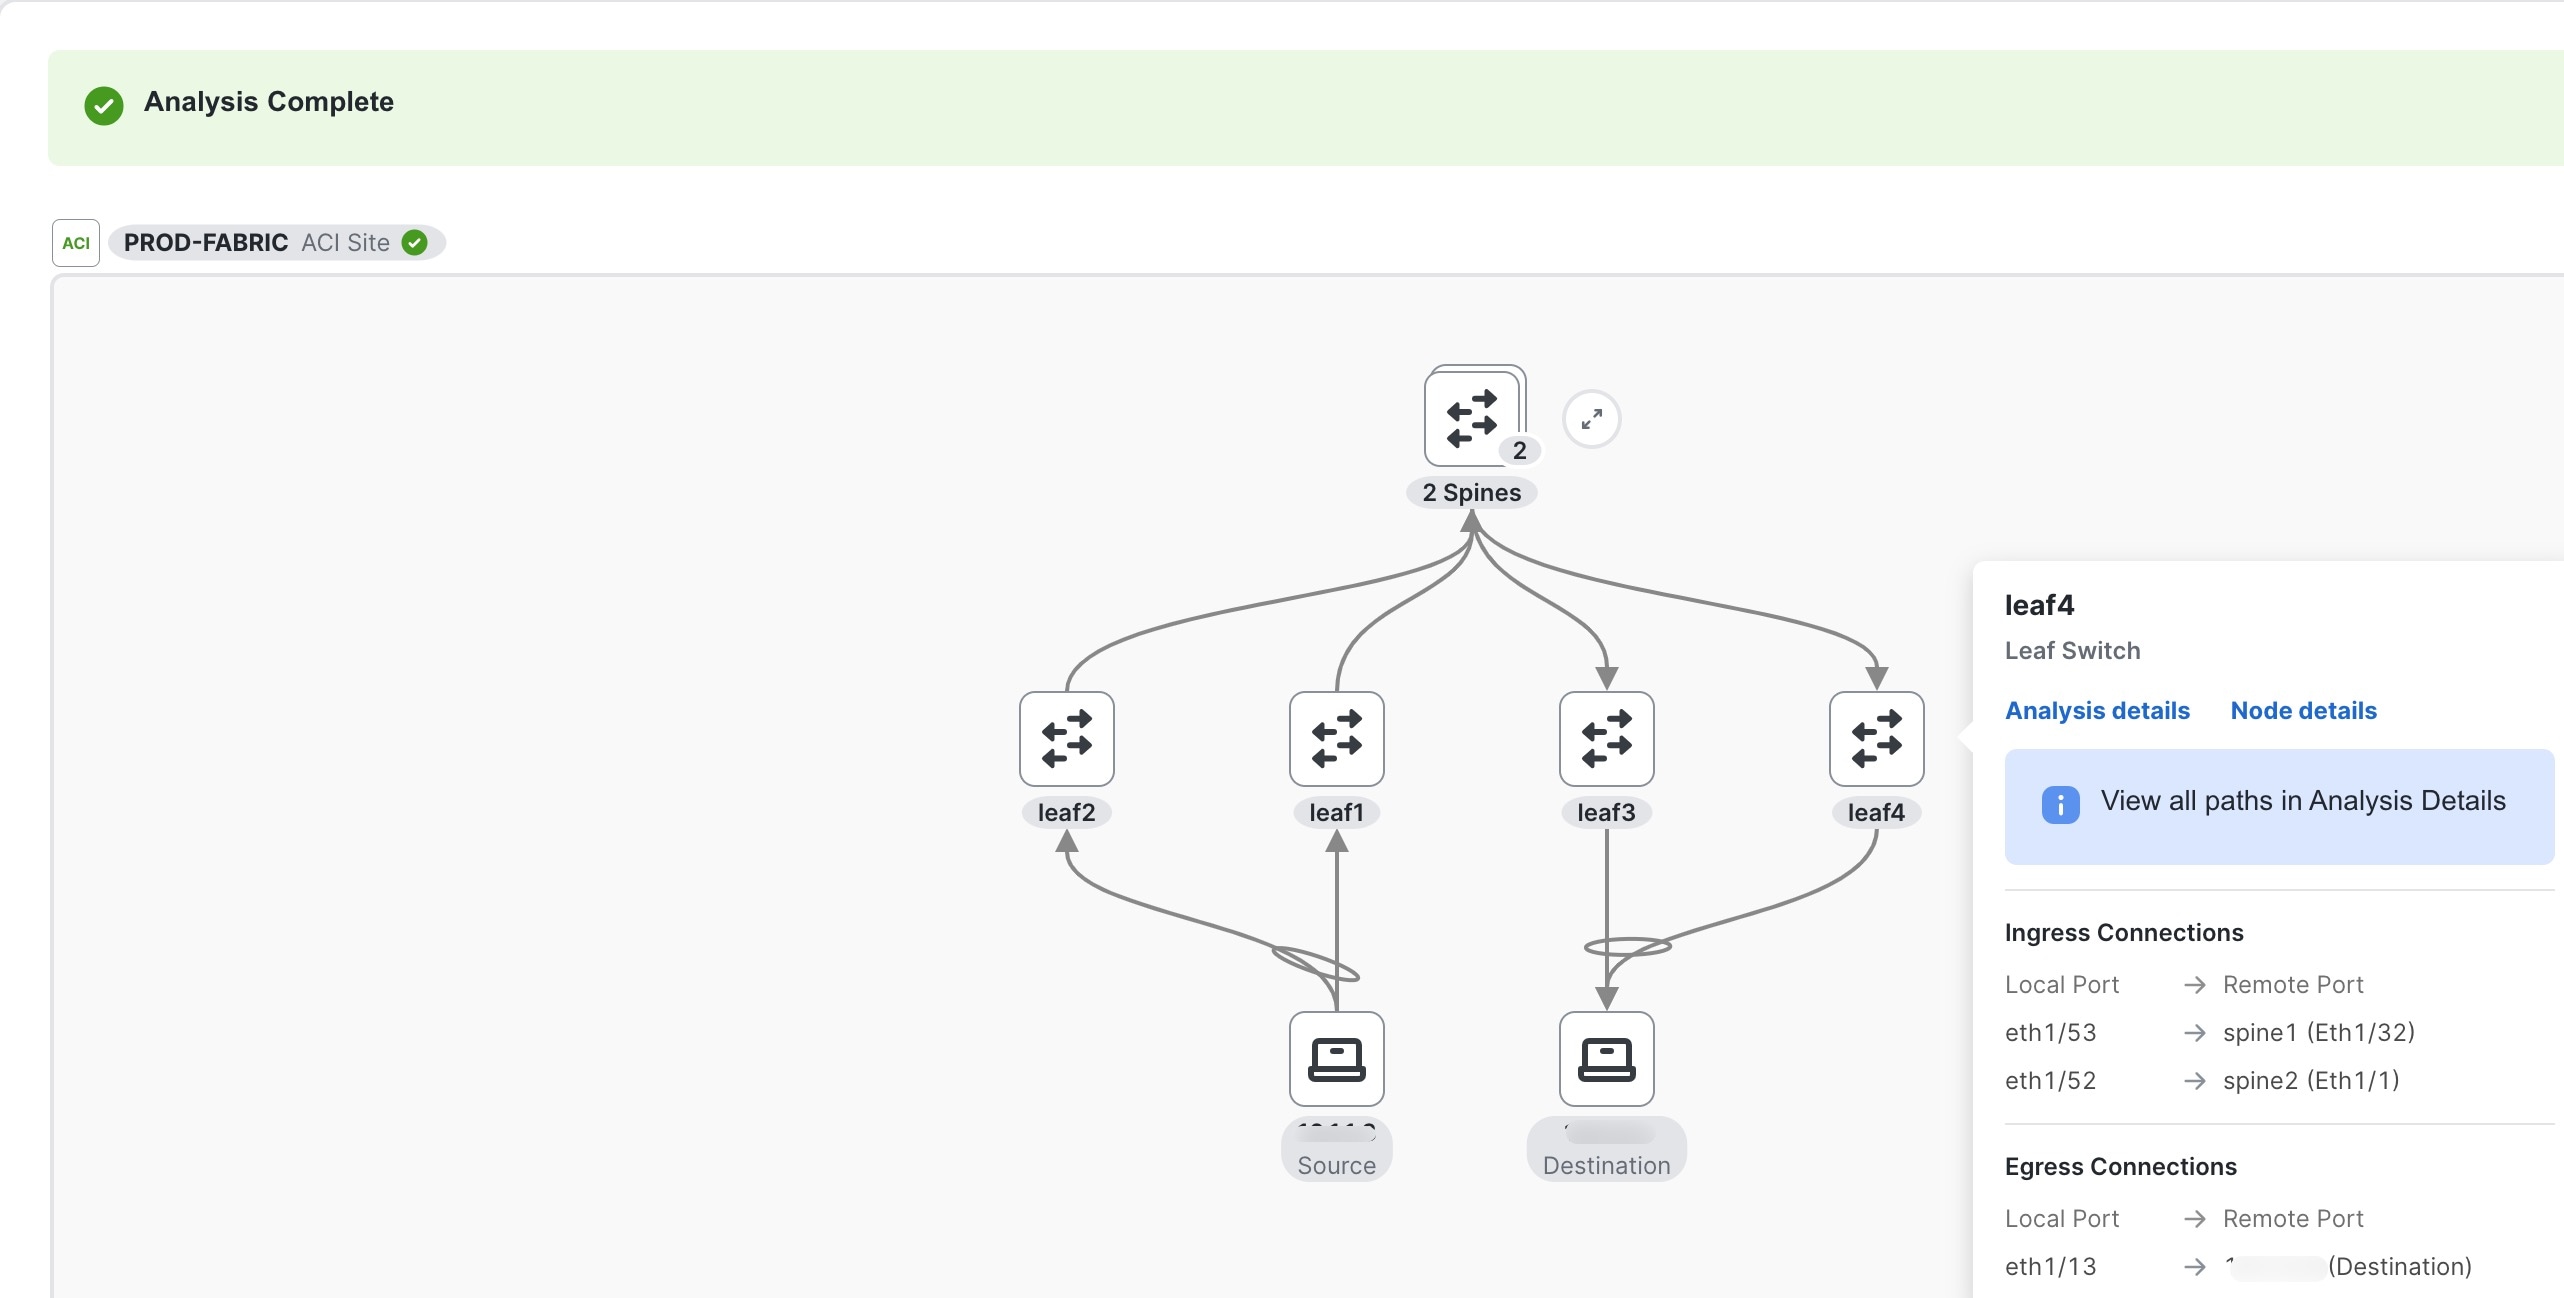
In the topology area, you can visualize hierarchial view of the fabric. You can double-click on the node to view interconnections of the nodes in the fabric. The active path between nodes is highlighted in green color. See Topology.
-
Click a node to view the tooltip. The tooltip displays the node name, node type, and the ingress and egress connections for that node. In the ingress and egress connections only physical interfaces are displayed.
-
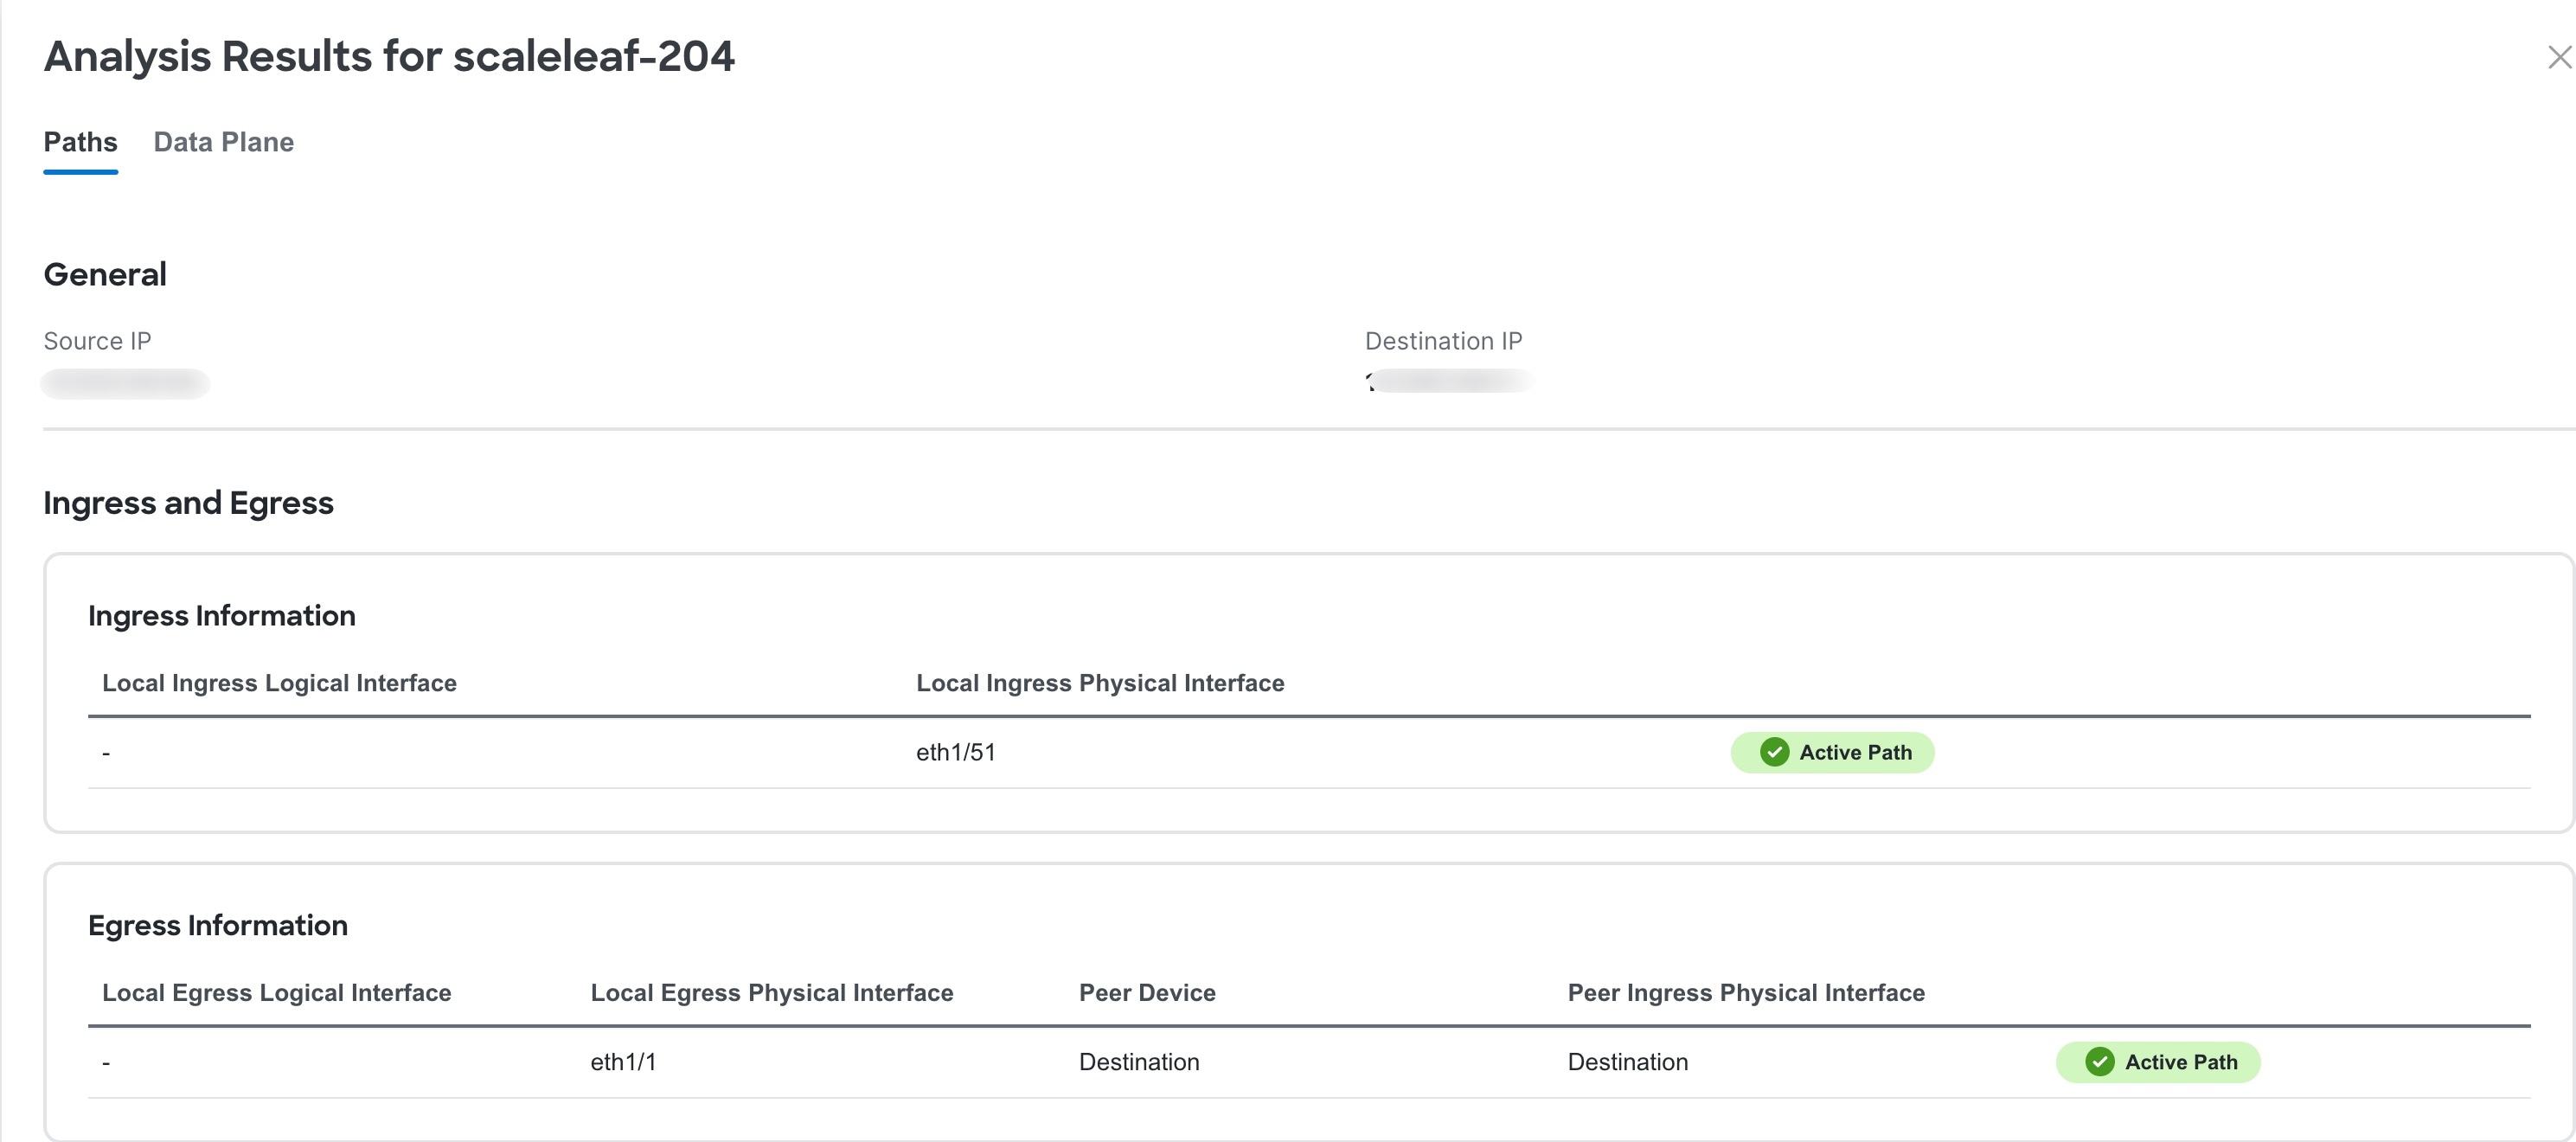
Click Analysis Details to view the path and data plane information.
-
Click Paths to view path details such as ingress and egress information. In the ingress and egress connections area logical interfaces are displayed.
-
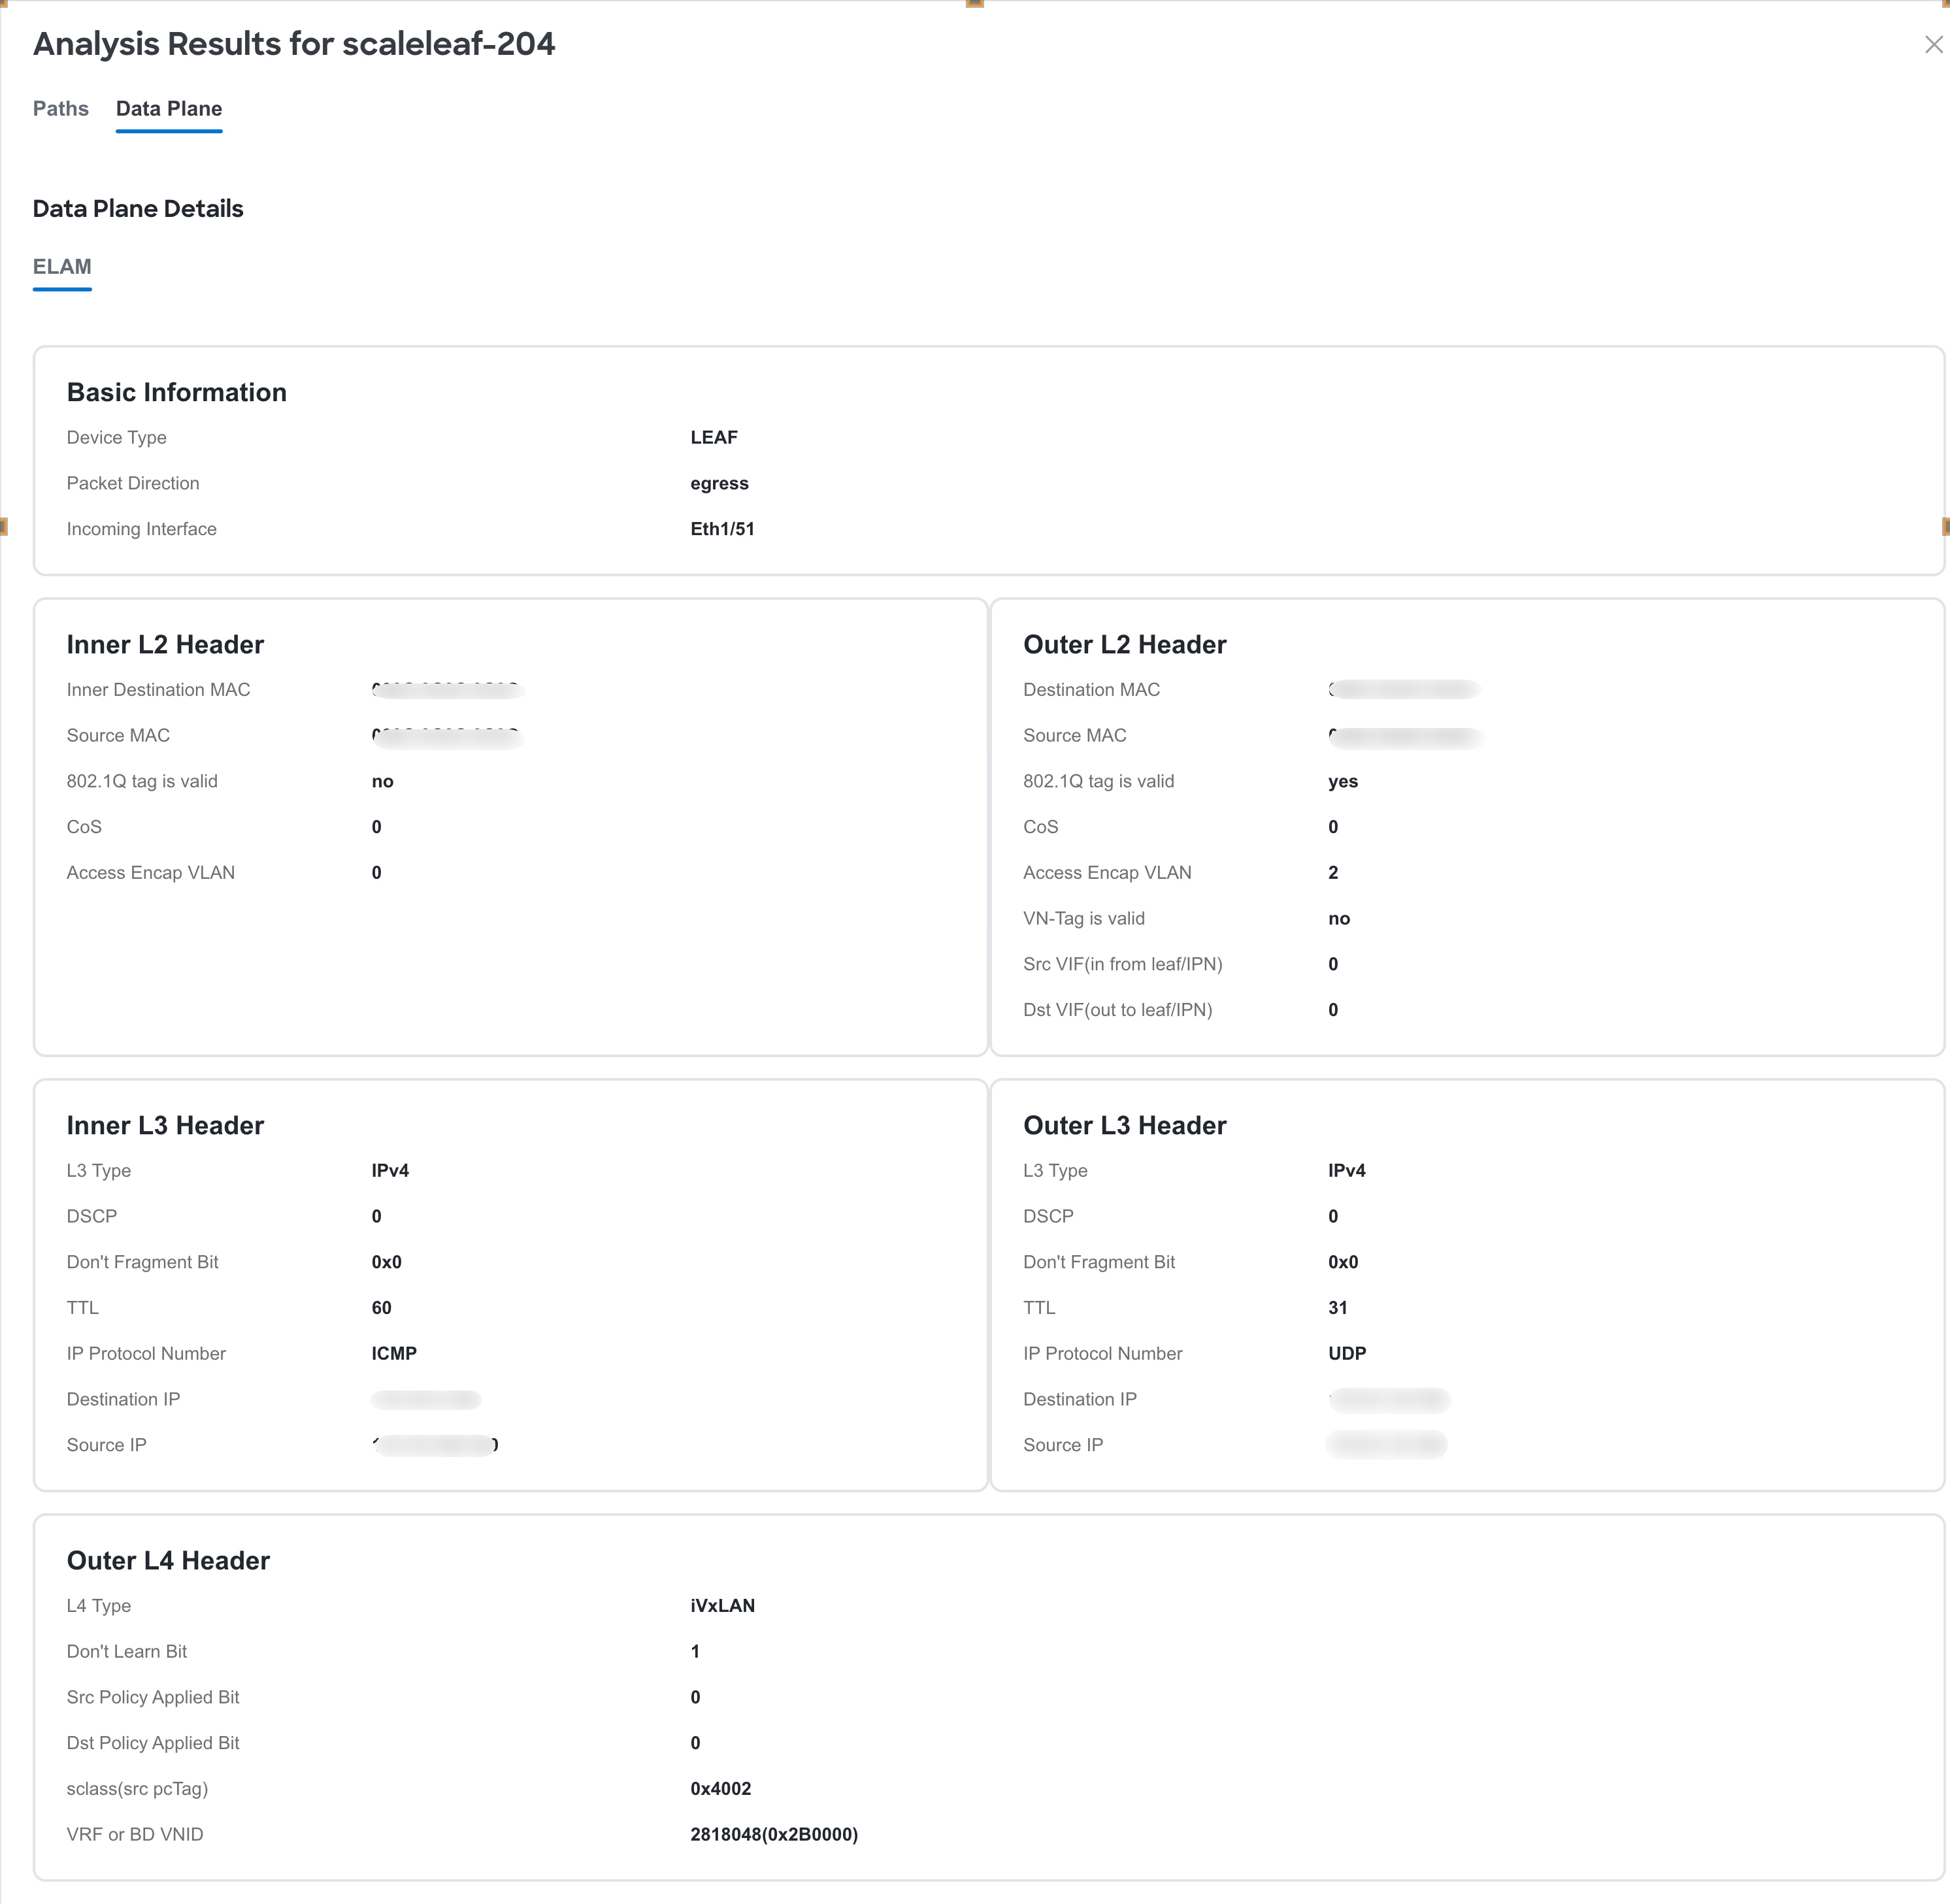
Click Data Plane to view the analysis options results.
-
Click ELAM to view the ELAM report. Click View Full Report to download the report.
-
-
Click Node Details to view the node details in inventory. See Inventory.
-
Manage Connectivity Analysis
-
Navigate to Analyze > Analysis Hub > Connectivity Analysis.
-
Click Name to view Connectivity Analysis details.
-
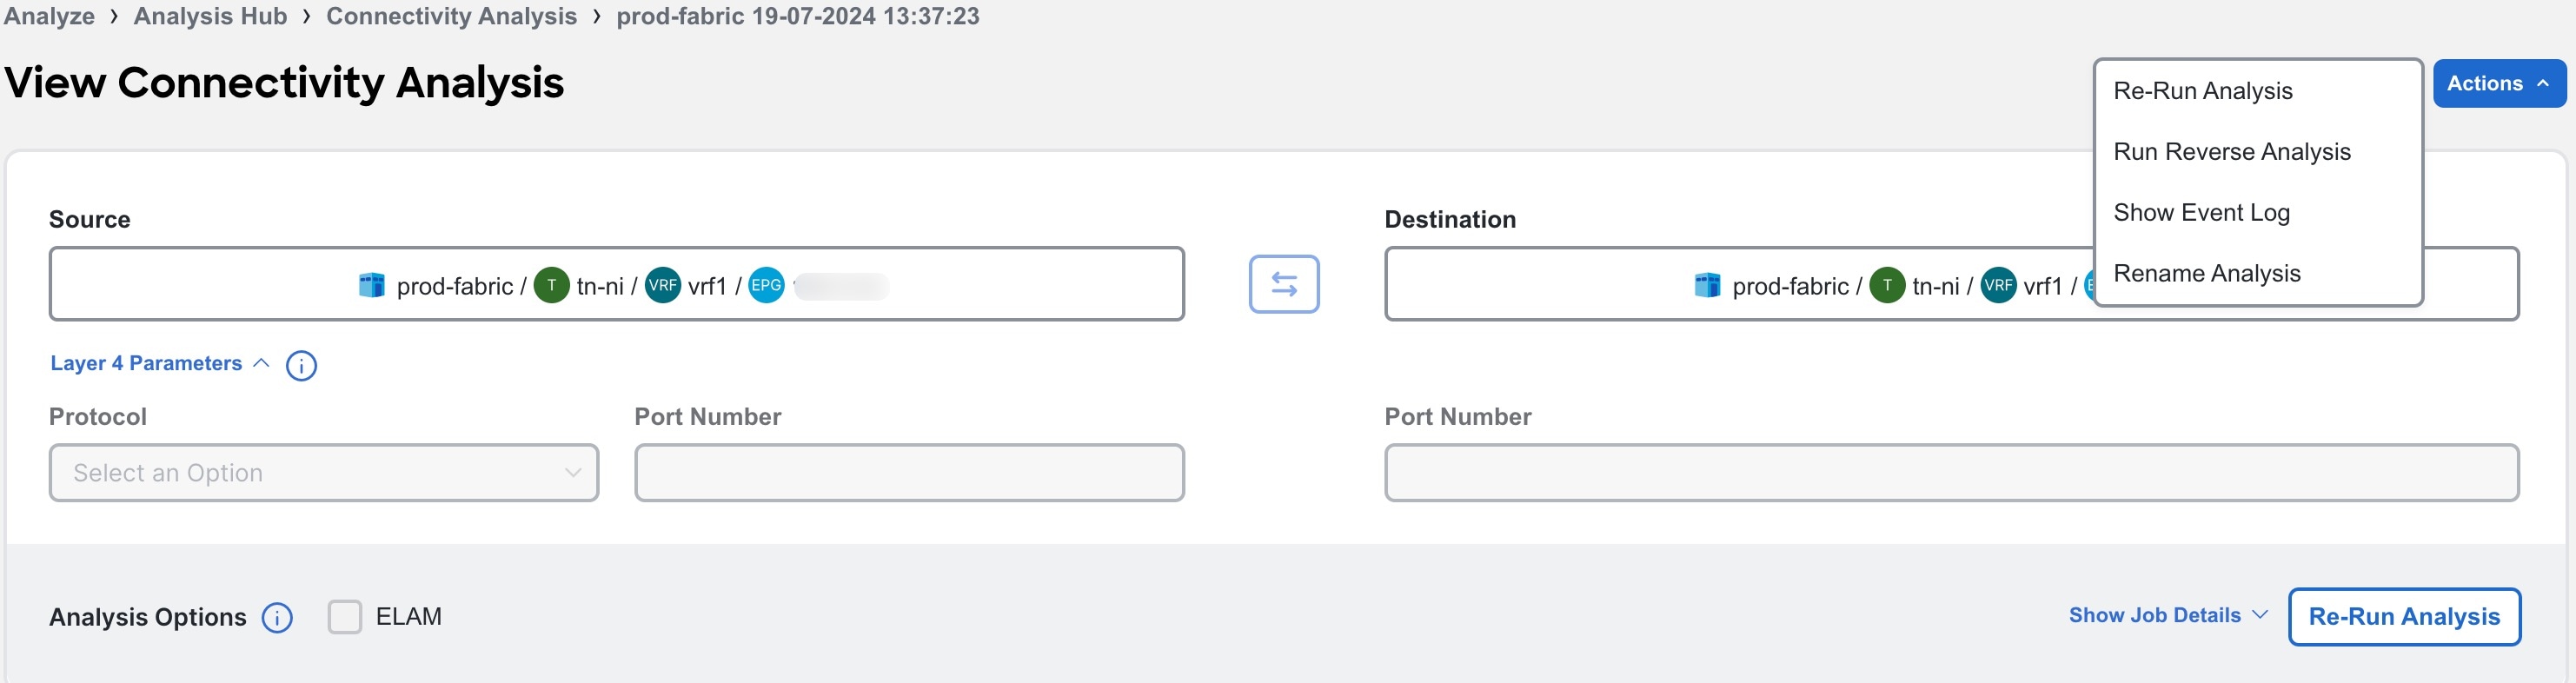
From the Actions drop-down menu choose Re-Run Analysis to run the analysis again.
-
From the Actions drop-down menu choose Run Reverse Analysis to run the analysis in the reverse direction.
-
From the Actions drop-down menu choose Show Event Log to view the logs for the analysis. In the event log, you can view the error message for a failed analysis.
-
From the Actions drop-down menu choose Rename Analysis to rename the analysis.
Filtering Information
In some cases, you might be able to filter results to find information more easily.
For example, you might have a situation where there a large number of endpoints under a single leaf switch, but you are only interested in endpoints that have a certain VLAN value.
You could filter the information to show only those specific endpoints in this situation.
Use the following operators for the filter refinement:
| Operator | Description |
|---|---|
|
== |
With the initial filter type, this operator, and a subsequent value, returns an exact match. |
|
!= |
With the initial filter type, this operator, and a subsequent value, returns all that do not have the same value. |
|
contains |
With the initial filter type, this operator, and a subsequent value, returns all that contain the value. |
|
!contains |
With the initial filter type, this operator, and a subsequent value, returns all that do not contain the value. |
|
< |
With the initial filter type, this operator, and a subsequent value, returns a match less than the value. |
|
< = |
With the initial filter type, this operator, and a subsequent value, returns a match less than or equal to the value. |
|
> |
With the initial filter type, this operator, and a subsequent value, returns a match greater than the value. |
|
> = |
With the initial filter type, this operator, and a subsequent value, returns a match greater than or equal to the value. |
Log Collector
Log Collector
The Log Collector feature enables you to collect and upload the logs for the devices in your network to Cisco Intersight Cloud. It also enables Cisco TAC to trigger on-demand collection of logs for devices on the fabric and pulls the logs from Cisco Intersight Cloud.
The Log Collector has two modes:
-
User initiated - The user collects the logs for devices on the fabric and then uploads the collected logs to Cisco Intersight Cloud after the log collection job is completed. You can automatically upload the log files to Cisco Intersight Cloud after the log collection job is completed.
-
TAC initiated - Cisco TAC triggers on-demand collection of logs for specified devices and pulls the logs from Cisco Intersight Cloud.
Device Connectivity Notifier for TAC Initiated Collector
Nexus Dashboard Insights uses the device connectivity issue notifier on Cisco Nexus Dashboard to communicate with the devices. The notifier checks for TAC triggered on-demand collection of logs. In case the fabric is not configured properly to communicate with the device, Nexus Dashboard Insights notifies the following:
-
The device is not configured for node interaction.
-
You can not run a Log Collector job on the device.
-
Nexus Dashboard Insights cannot connect to the device.
If the node interaction is not healthy on the device, you cannot choose the device for Log Collector to collect logs. In the GUI, the device is greyed out.
Log Collector Dashboard
Navigate to Analyze > Analysis Hub > Log Collector.
The Log Collector Dashboard displays a graph of Logs by Job status for a particular fabric and displays the latest log collections.
The filter bar allows you to filters the logs by Status, Name, Node, start time, and end time.
Use the following operators for the filter refinement:
| Operator | Description |
|---|---|
|
== |
With the initial filter type, this operator, and a subsequent value, returns an exact match. |
|
!= |
With the initial filter type, this operator, and a subsequent value, returns all that do not have the same value. |
|
contains |
With the initial filter type, this operator, and a subsequent value, returns all that contain the value. |
|
!contains |
With the initial filter type, this operator, and a subsequent value, returns all that do not contain the value. |
The page also displays the log collection jobs in a tabular format. The jobs are sorted by status. Choose the log collection job in the table to view additional details.
General
This displays the status of the job along with a graph showing the number of devices by status.
Details
The following information is listed:
-
Creation Time
-
End Time
-
Nodes
-
Job ID
Selected Nodes
This displays the list of nodes in a tabluar form along with the status of each job and the upload status for the files uploaded.
Upload All Files allows you to upload all the files.
TAC Initiated Log Collector
The TAC initiated log collector enables Cisco TAC to trigger on-demand collection of logs for specified user devices in the Cisco Intersight Cloud to the Device Connector.
When the TAC assist job is complete, the new job appears in the Log Collector table. Choose the log collection job in the table to display additional details. Log Collection status displays information such as status, general information, and node details.
You can save TAC assist job details as a PDF with the browser print option (Only supported on Chrome and Firefox).
Upload logs to Cisco Intersight Cloud
-
Ensure that Nexus Dashboard Insights is connected to Cisco Intersight Cloud.
-
Ensure that Nexus Dashboard Insights is connected to Cisco Intersight Device Connector.
Choose Analyze > Analyze Hub > Log Collector > New Log Collector.
-
Enter the name.
-
Click Select Fabric to choose a fabric.
-
(Optional) Check Auto Upload Log Files to automatically upload the log files to Cisco Intersight Cloud after the log collection job is completed.
-
Click Next.
-
Click Add Nodes and then choose the nodes from the Select Nodes menu.
-
Click Add. The nodes are displayed in the Select Nodes table.
-
Click Start Collection to initiate the log collection process.
When the job is complete, the new job appears in the Log Collector table.
-
Click the job in the table to display additional job details.
-
Click the
 icon to display Log Collection status.
 -
Choose the node and click
 icon.
icon. -
Click Upload File to TAC Assist to upload a single file for the chosen node manually.
-
Click Upload to upload all the log files generated for the chosen node manually.
The status of the upload is displayed in the Selected Nodes table.
Guidelines and Limitations
-
If the upload logs fails for some of the nodes and succeeds for the rest of the nodes, then in the Selected Nodes table, the status is displayed as Completed.
-
If the collection fails for some of the nodes, then the collection will continue for other nodes. After the collection is completed, the upload will start. In the Selected Nodes table, the combined status is displayed in the Status column.
-
If the collection succeeds for some of the nodes, but the upload fails, then in the Selected Nodes table, the status is displayed as Failed.
-
Auto Upload Log Files can be performed only on one node at a time.
Traffic Analytics
Traffic Analytics
Traffic Analytics enables you to monitor your network’s latency, congestion, and drops.
Traffic Analytics automatically discovers services running in your network by matching well-known TCP Layer 4 ports to their corresponding service endpoint categories. Nexus Dashboard Insights then assesses service performance based on thresholds for the following metrics:
-
Latency: Measures the overall time in microseconds it takes a packet to go between the ingress and egress leaf switches for specific traffic flow. Latency is tracked for both ingress and egress traffic between a service endpoint and its clients.
-
Congestion: Measures network bandwidth utilization, quality of service (QoS) activation mechanisms, and priority flow control (PFC) and explicit congestion notification (ECN) counters to determine if a service is experiencing network congestion.
-
Drops: Measures the score or number of dropped packets versus transmitted packets considering factors such as CRC errors, faulty cables, and other devices.
An anomaly is raised if there is any deviation in the performance metrics such as latency, congestion, and drops. The performance score is calculated for each conversation and aggregated to the service endpoint or endpoint level to raise anomalies.
The performance score is calculated based on the following:
-
Congestion - Consistent congestion avoidance active between endpoints is calculated.
-
Latency - Deviation from the average latency of the previous conversations is calculated.
-
Drops - Directly correspond to an issue with the conversation or service.
Using Traffic Analytics you can:
-
Monitor traffic pervasively.
-
Report performance issues using anomalies raised for performance metrics.
-
Sort top talking services and clients and determine the top talkers in the system.
-
Determine the SYN or RST counts per service.
-
Troubleshoot conversations or flows on-demand.
Traffic Analytics conversations
A TCP conversation is a 4-tuple including client IP address, server IP address, server port, and protocol. A non-TCP conversation is a 3-tuple including source IP address, destination IP address, and protocol. In case a single client establishes multiple communication flows initiated by multiple source ports towards a service endpoint, all related statistics would be aggregated as a single entry in the Traffic Analytics table. A service endpoint is defined by an IP address, a port, and a protocol.
An anomaly is raised after the conversation rate limit is exceeded. Navigate to Admin > System Settings > Flow Collection. In the Traffic Analytics status for the last hour area, you can view if the conversation rate approaches or exceeds the limits. You can also view if there are any Traffic Analytics record drops.
Traffic Analytics scale limits
The table shows the Traffics Analytics scale limits.
| Nexus Dashboard cluster | Unique conversations per minute | Concurrent troubleshoot jobs |
|---|---|---|
|
6 physical |
100,000 |
8 |
|
3 physical |
50,000 |
5 |
|
1 physical |
5,000 |
1 |
|
6 virtual |
10,000 |
5 |
|
3 virtual |
5,000 |
1 |
Guidelines and limitations for Traffic Analytics
-
Nexus Dashboard Insights supports Cisco Application Policy Infrastructure Controller (APIC) release 6.1(1) and later.
-
Nexus Dashboard Insights supports 5,000 conversations per minute in a virtual Nexus Dashboard, 50,000 conversations per minute in a 3-node physical Nexus Dashboard, and 100,000 conversations per minute in a 6-node physical Nexus Dashboard.
-
Traffic Analytics is not supported for Cisco ACI Multi-Site.
-
Traffic Analytics does not support multicast.
-
Traffic Analytics does not support EX switches.
-
Traffic Analytics is only available for traffic flows between IPv4 or IPv6 endpoints that are contained within the fabric. These endpoints should be visible in the Manage > Fabrics > Connectivity > Endpoints page. If the source or destination endpoint exists outside the fabric, then the Traffic Analytics conversation will not be displayed in the Traffic Analytics table.
-
Navigate to Analyze > Analysis Hub > Traffic Analytics to view information about TCP services and clients/conversations. Go to the Endpoint Traffic Analytics tab to view information about non-TCP services and clients/conversations.
-
Ensure that you have configured NTP and enabled PTP on Cisco APIC. See Cisco Nexus Dashboard Insights Deployment Guide and Precision Time Protocol (PTP) for Cisco Nexus Dashboard Insights for more information.
Configure Traffic Analytics
-
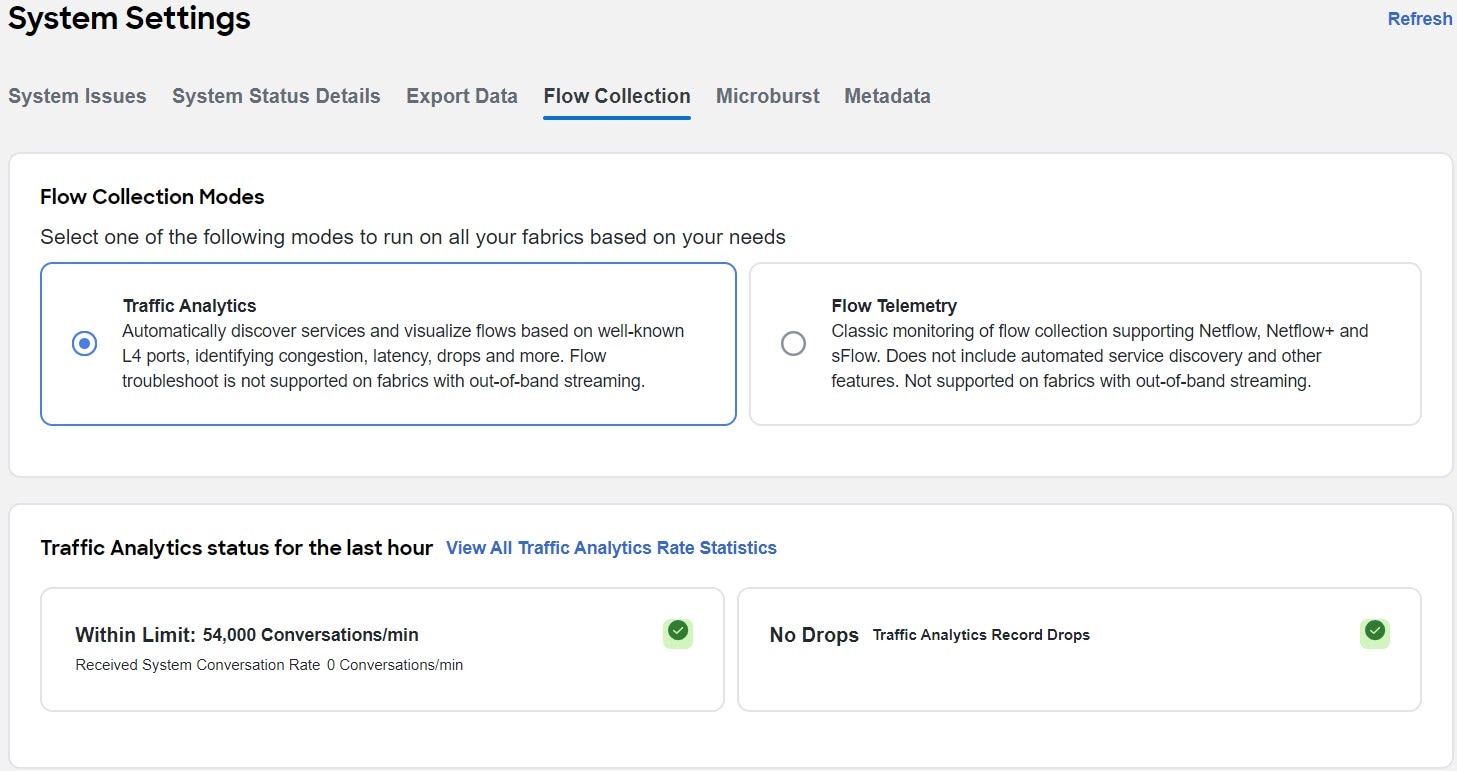
Navigate to Admin > System Settings > Flow Collection.
-
In the Flow Collection Modes area, choose Traffic Analytics.
-
In the Flow Collection per Fabric table, choose the fabric.
-
Click the ellipsis icon and then click Enable to enable Traffic Analytics.
If flow telemetry is already enabled on the fabric, you must first disable flow telemetry for all the fabrics and remove all flow rules before enabling Traffic Analytics.
-
In the Traffic Analytics Status For The Last Hour area you can see the number of conversations that are over limit and Traffic Analytics drops. You must make sure that you do not exceed the maximum conversation rate limit. If you exceed the maximum conversation rate limit you will see drops in flows records and it will impact the visibility.
-
Click View All Traffic Analytics Rate Statistics to view the statistics for each switch in a fabric.
View Traffic Analytics
View Traffic Analytics for an Individual Fabric
-
Navigate to Manage > Fabrics.
-
Click the fabric name.
-
Choose a time range from the drop-down menu. By default the Current time (last 2 hours) is chosen.
-
In the Analytics Summary area, click Traffic Analytics to view Traffic Analytics details for that fabric. In the Traffic Analytics page all the information is grouped as service categories for that fabric.
-
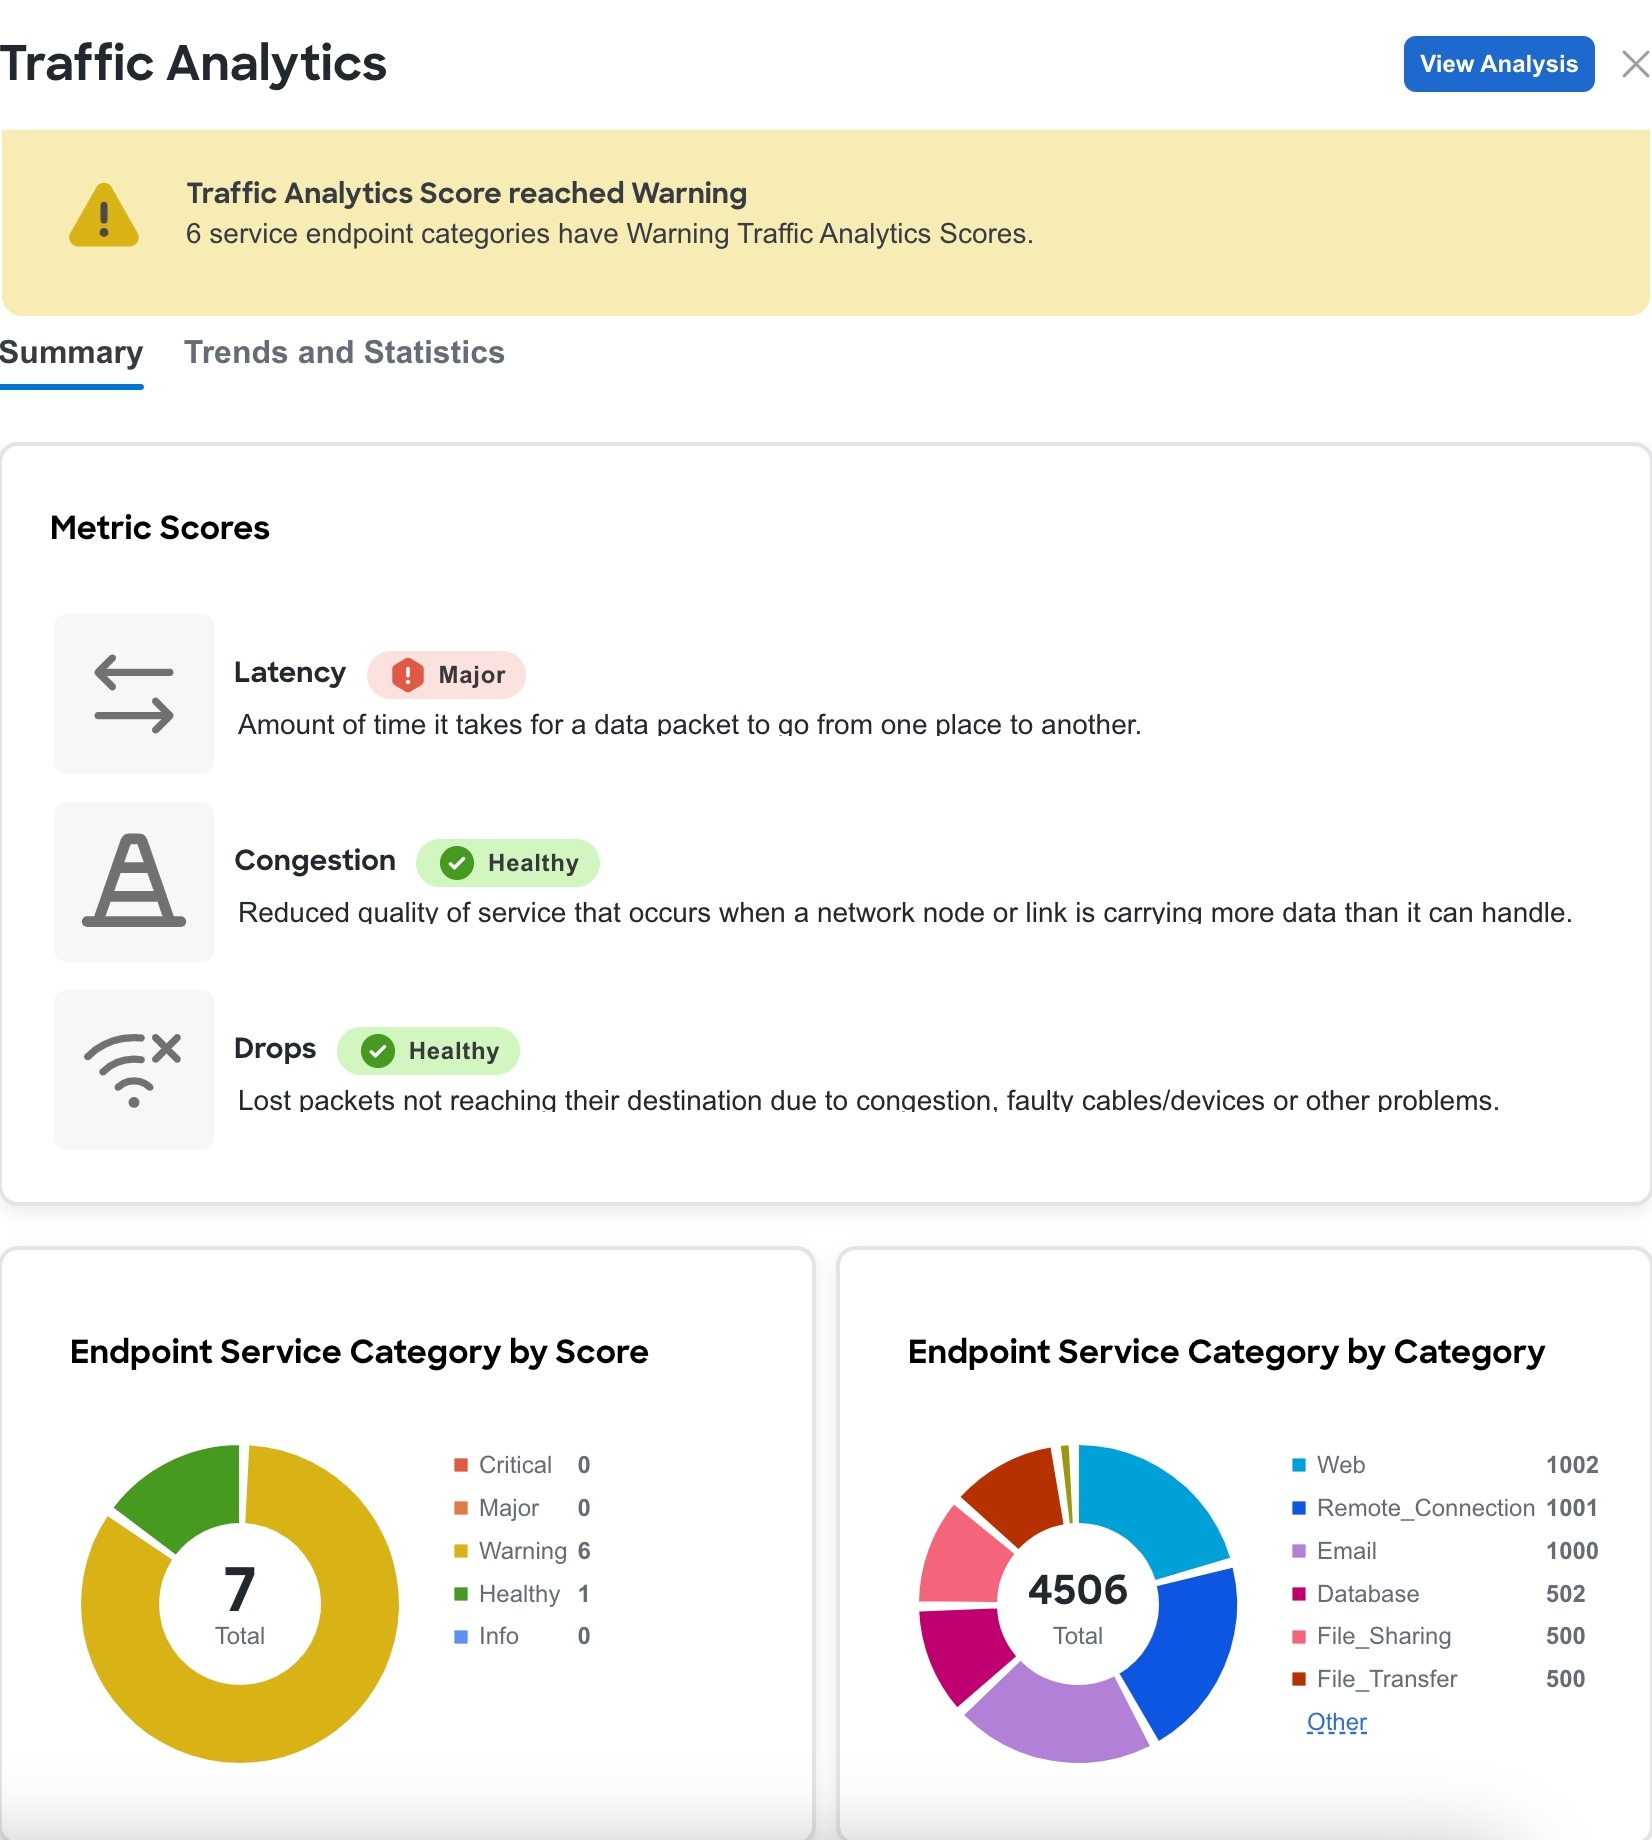
The Summary area displays the Traffic Analytics Score and how the metrics is determined. You can view the traffic profile for endpoint service category by score and category.
-
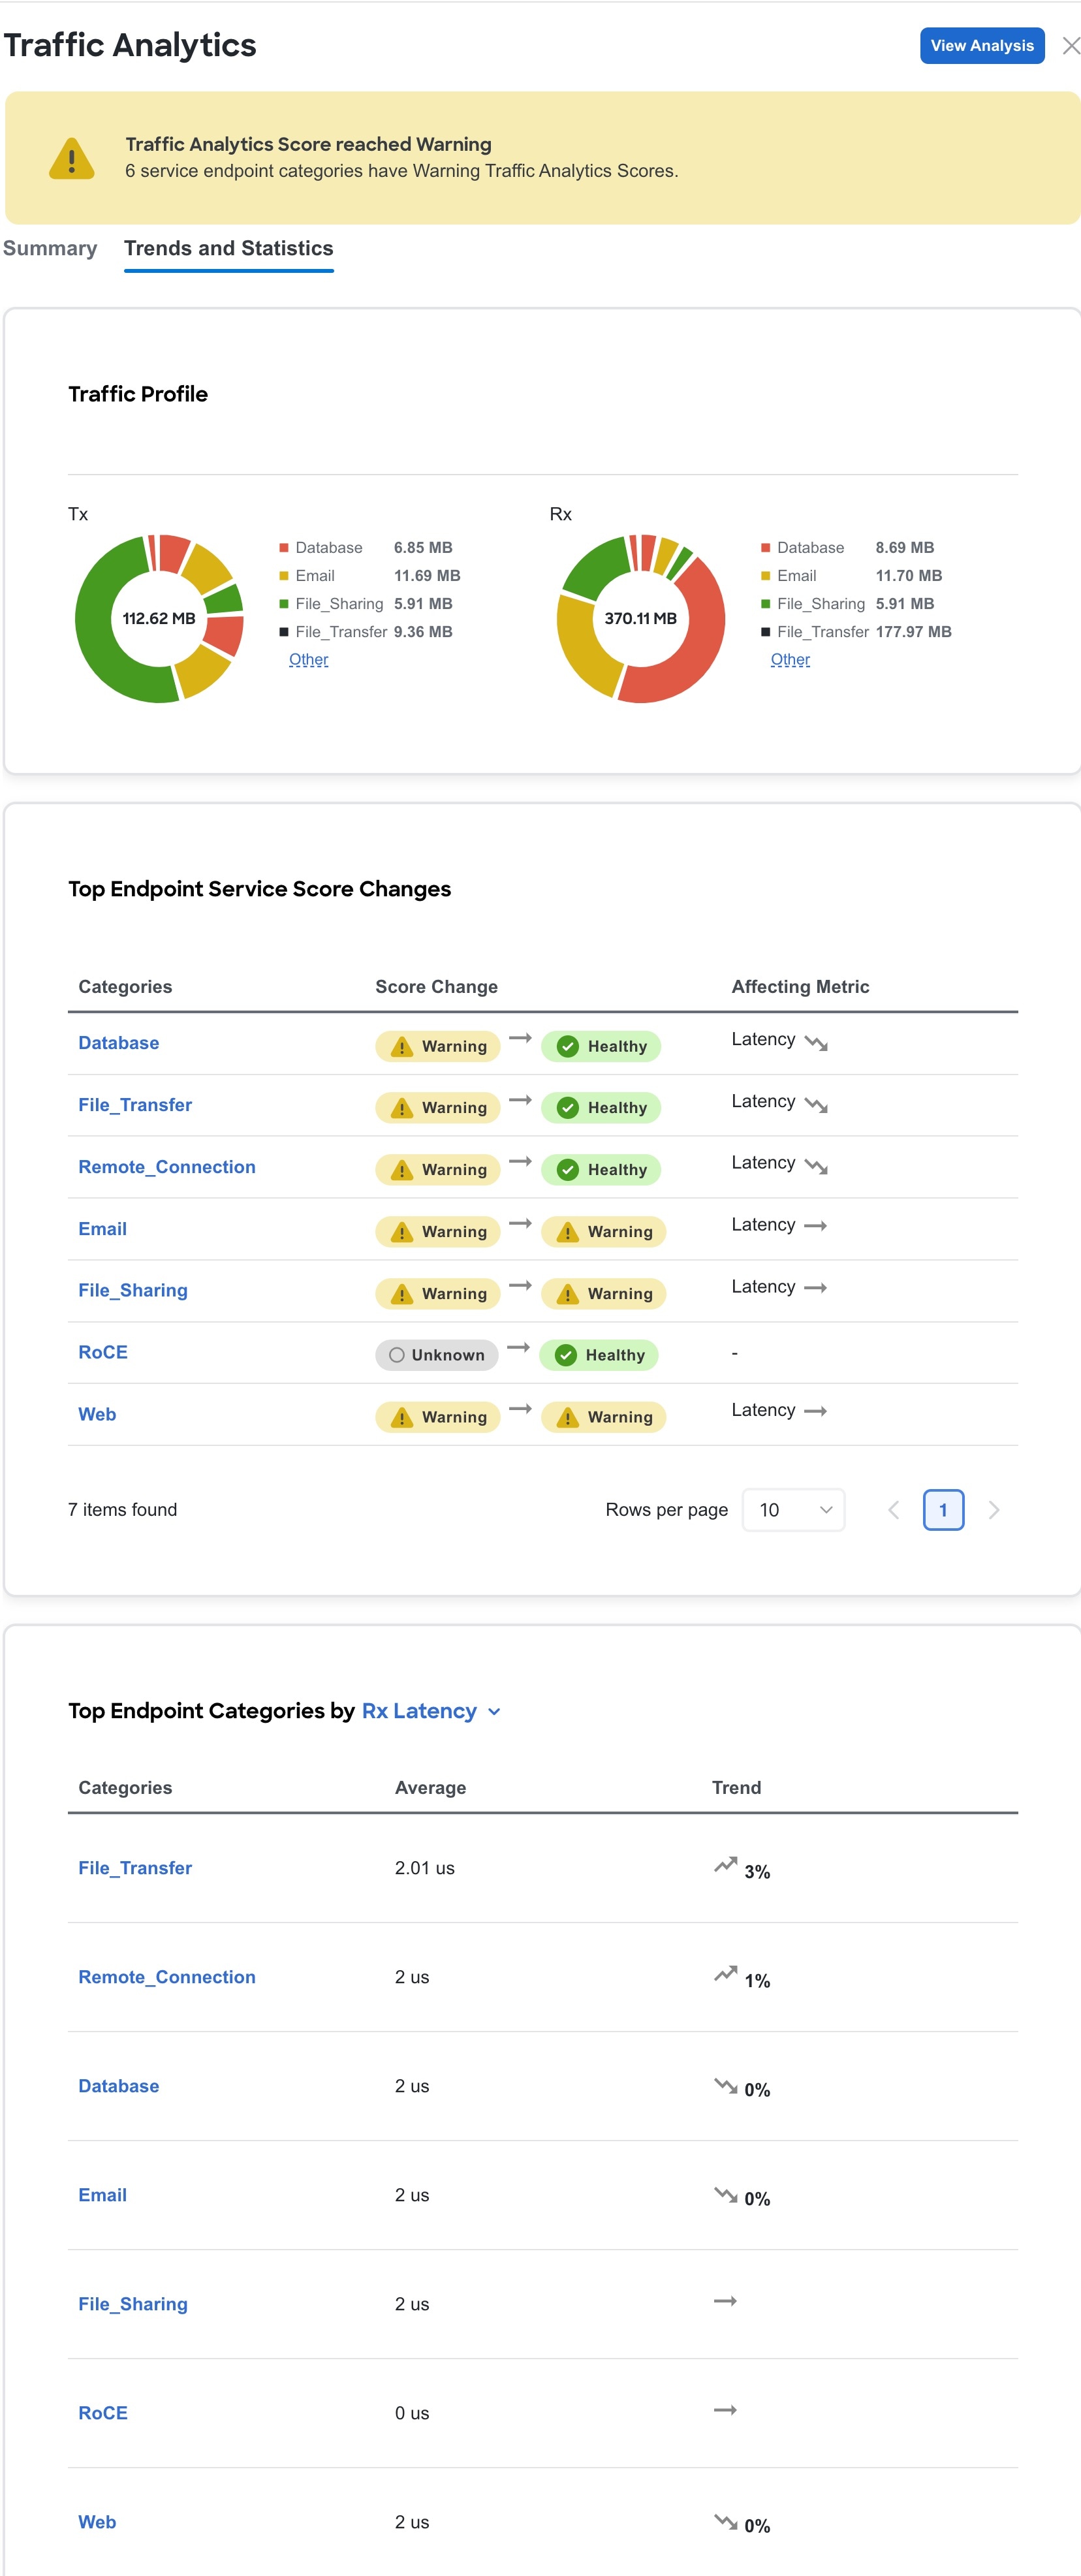
Click Trends and Statistics to view Traffic profile, Top Endpoint Service Score Changes, and Top Endpoint Categories.
-
In the Traffic Profile area you can view the traffic amount for the endpoint service category.
-
In the Top Endpoint Service Score Changes area, you can view the anomaly score change across the chosen time range and the metrics (such as latency, congestion, drops) affecting the score change.
-
In the Top Endpoint Categories by area you can see the top categories by Rx and Tx Latency, Congestion Score, and Drop Score.
-
-
Click View Analysis to view Traffic Analytics for all the fabrics.
View Traffic Analytics for all fabrics
-
Navigate to Analyze > Analyze Hub > Traffic Analytics.
-
Choose a fabric from the drop-down menu.
-
Choose a time range from the drop-down menu. The default is Current, which specifies that any issues observed over the last 2 hours are displayed.
-
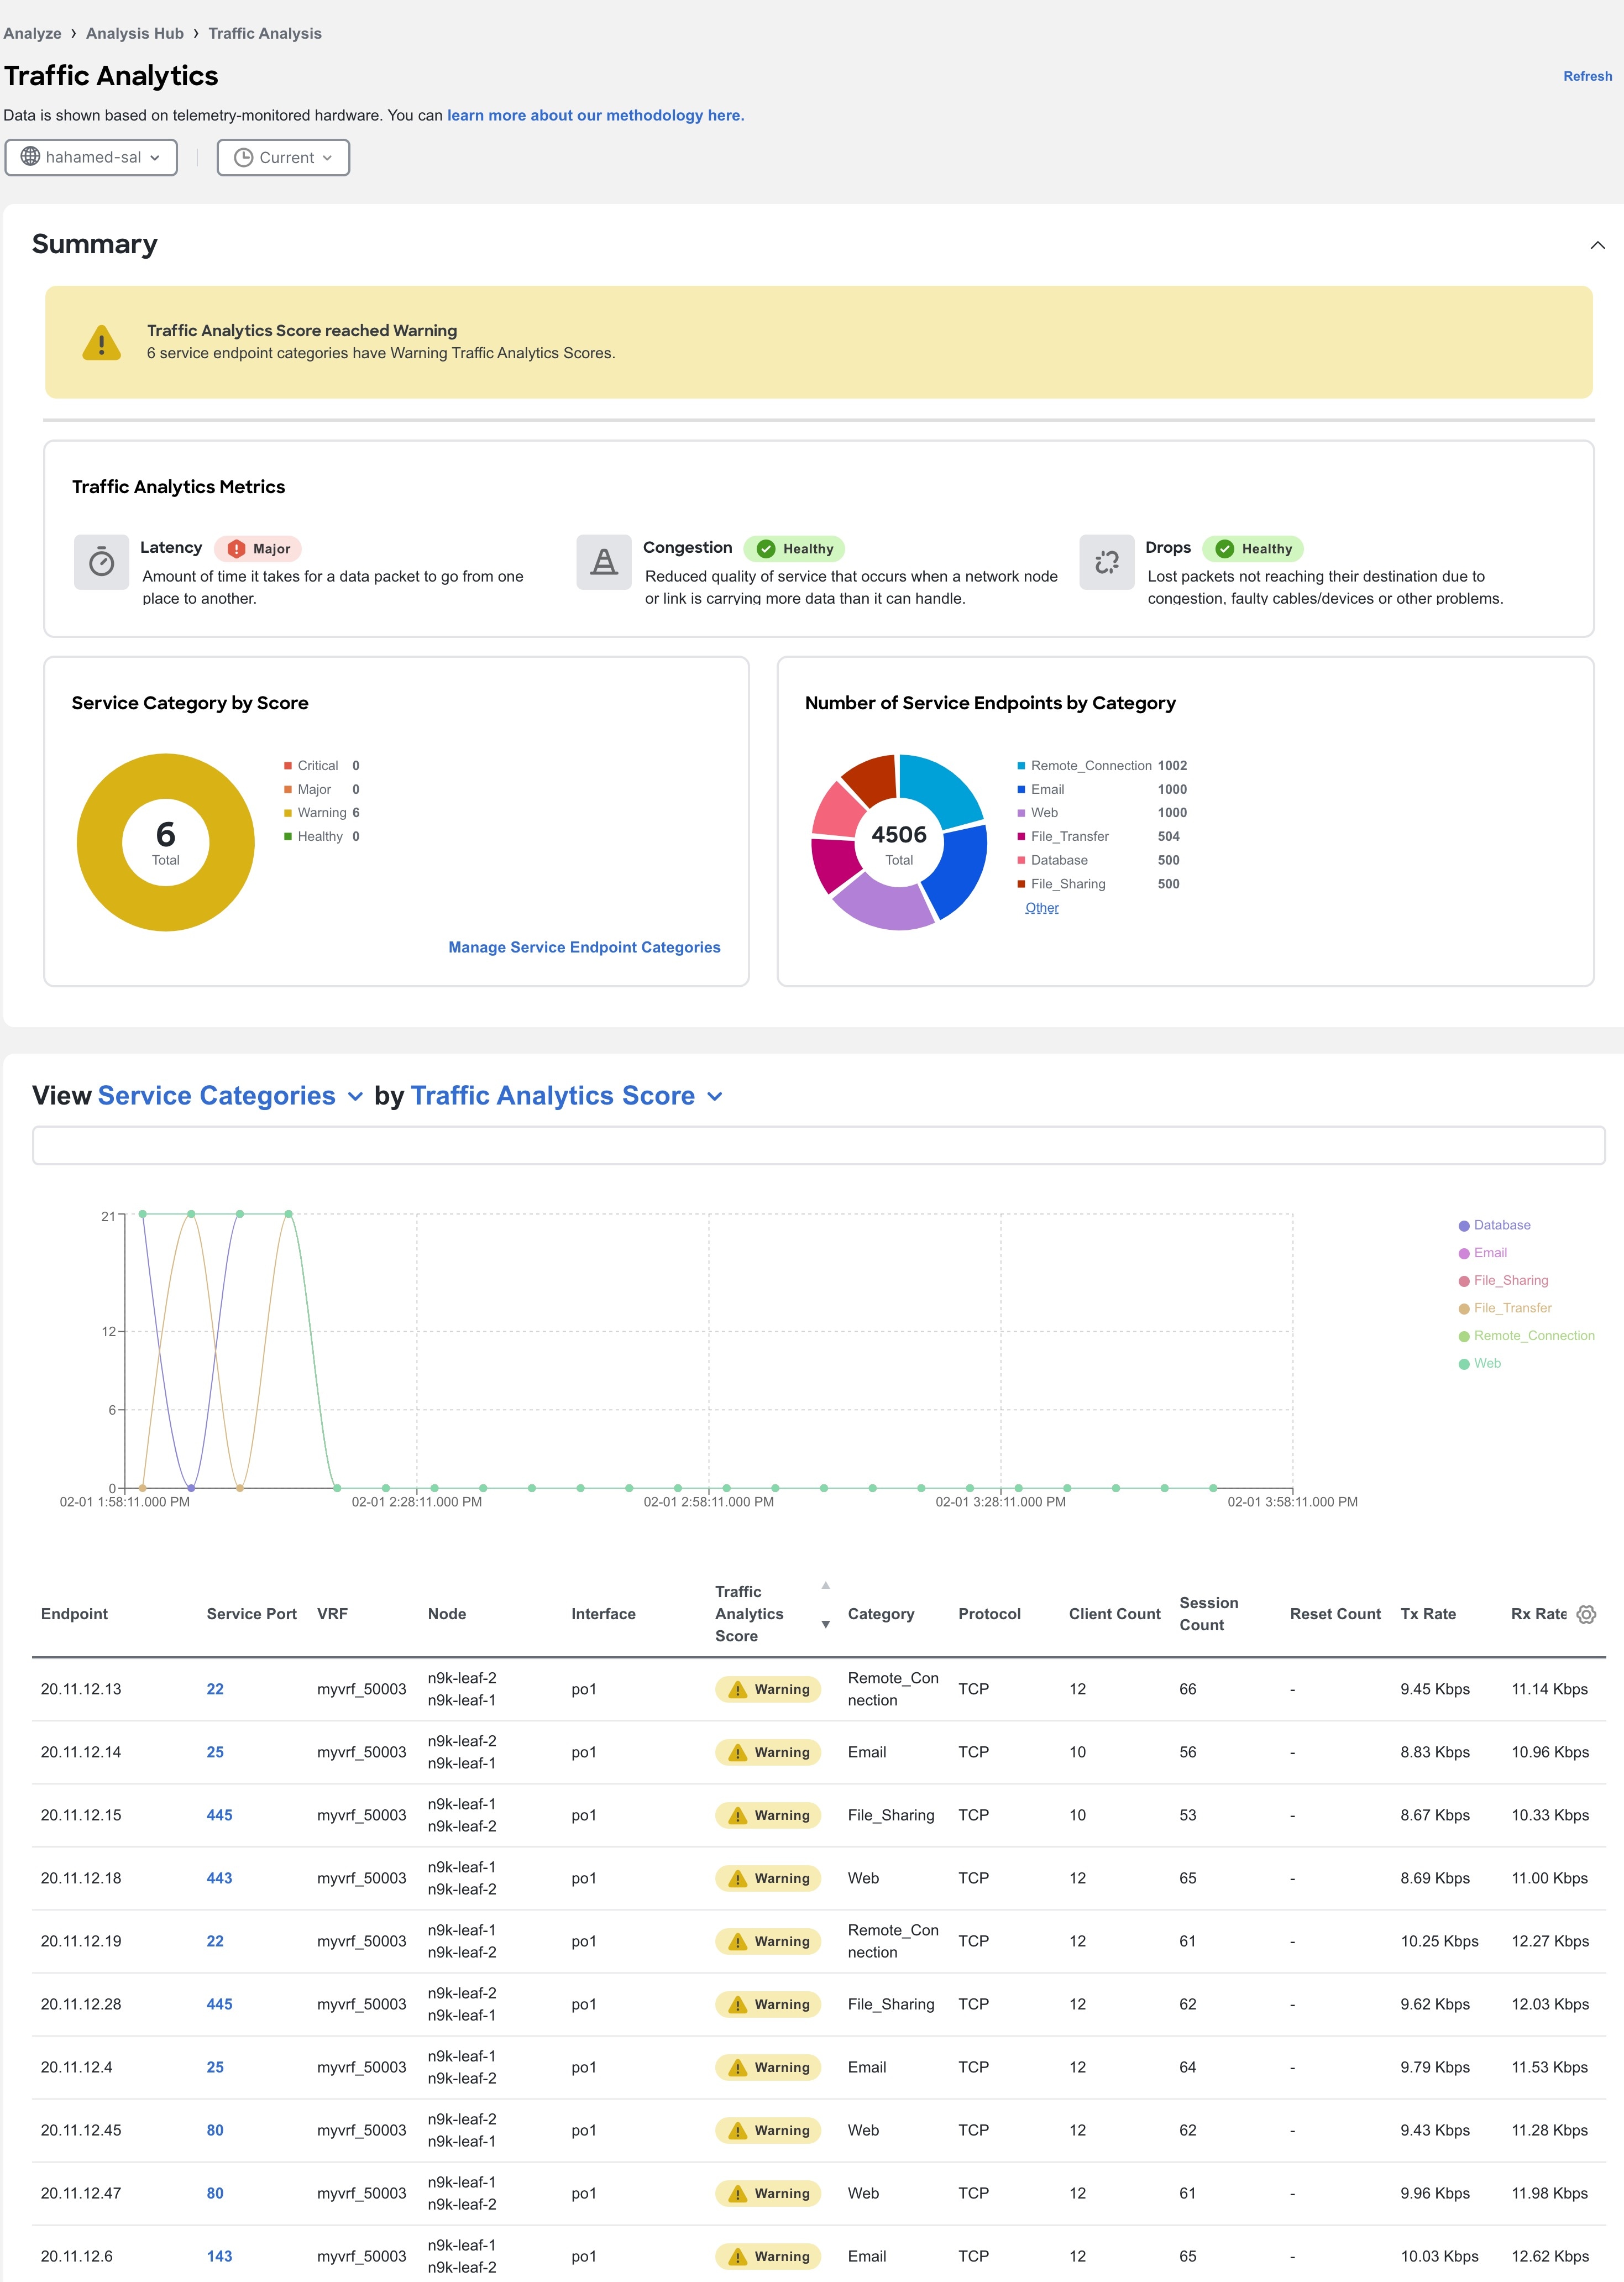
The Summary area displays the Traffic Analytics score and how the metrics are determined.
You can view the information for a service endpoint category by Score and Category. Service endpoint categories consist of ports that have been assigned to categories based on standard networking defaults and any categories you may have created. These categories are dynamic and can be updated any time. See Manage Service Endpoint Categories.
-
Use the drop-down list to view the Service Categories or Service Endpoints information for attributes such as Traffic Score, Congestion Score, Latency Score, and Drop Score in a graphical format. When you choose Service Endpoints, you can also view the top 10 endpoints for various attributes such as Traffic Analytic Score, Latency Score, Congestion Score, Drop Score, Session Count, Reset Count, TX Rate, and Rx Rate. For Current Time, when you choose view Service Categories for Traffic Analytics Score, you can use the graph to view the transition between healthy and unhealthy score.
-
In the Traffic Analytics table, you can view the service endpoints information. The Traffic Score information for service endpoints is a combination of congestion score, latency score, and drop score. When the score is calculated, congestion score has the lowest weighage, and drop score has the highest weighage.
-
You can hover on the Traffic Analytics Score column to view the Traffic Analytics Score breakdown for the service.
-
Use the search bar to filter by Service Categories, Service Endpoints values, or other values.
-
Click the gear icon to configure the columns in the Traffic Analytics table.
-
-
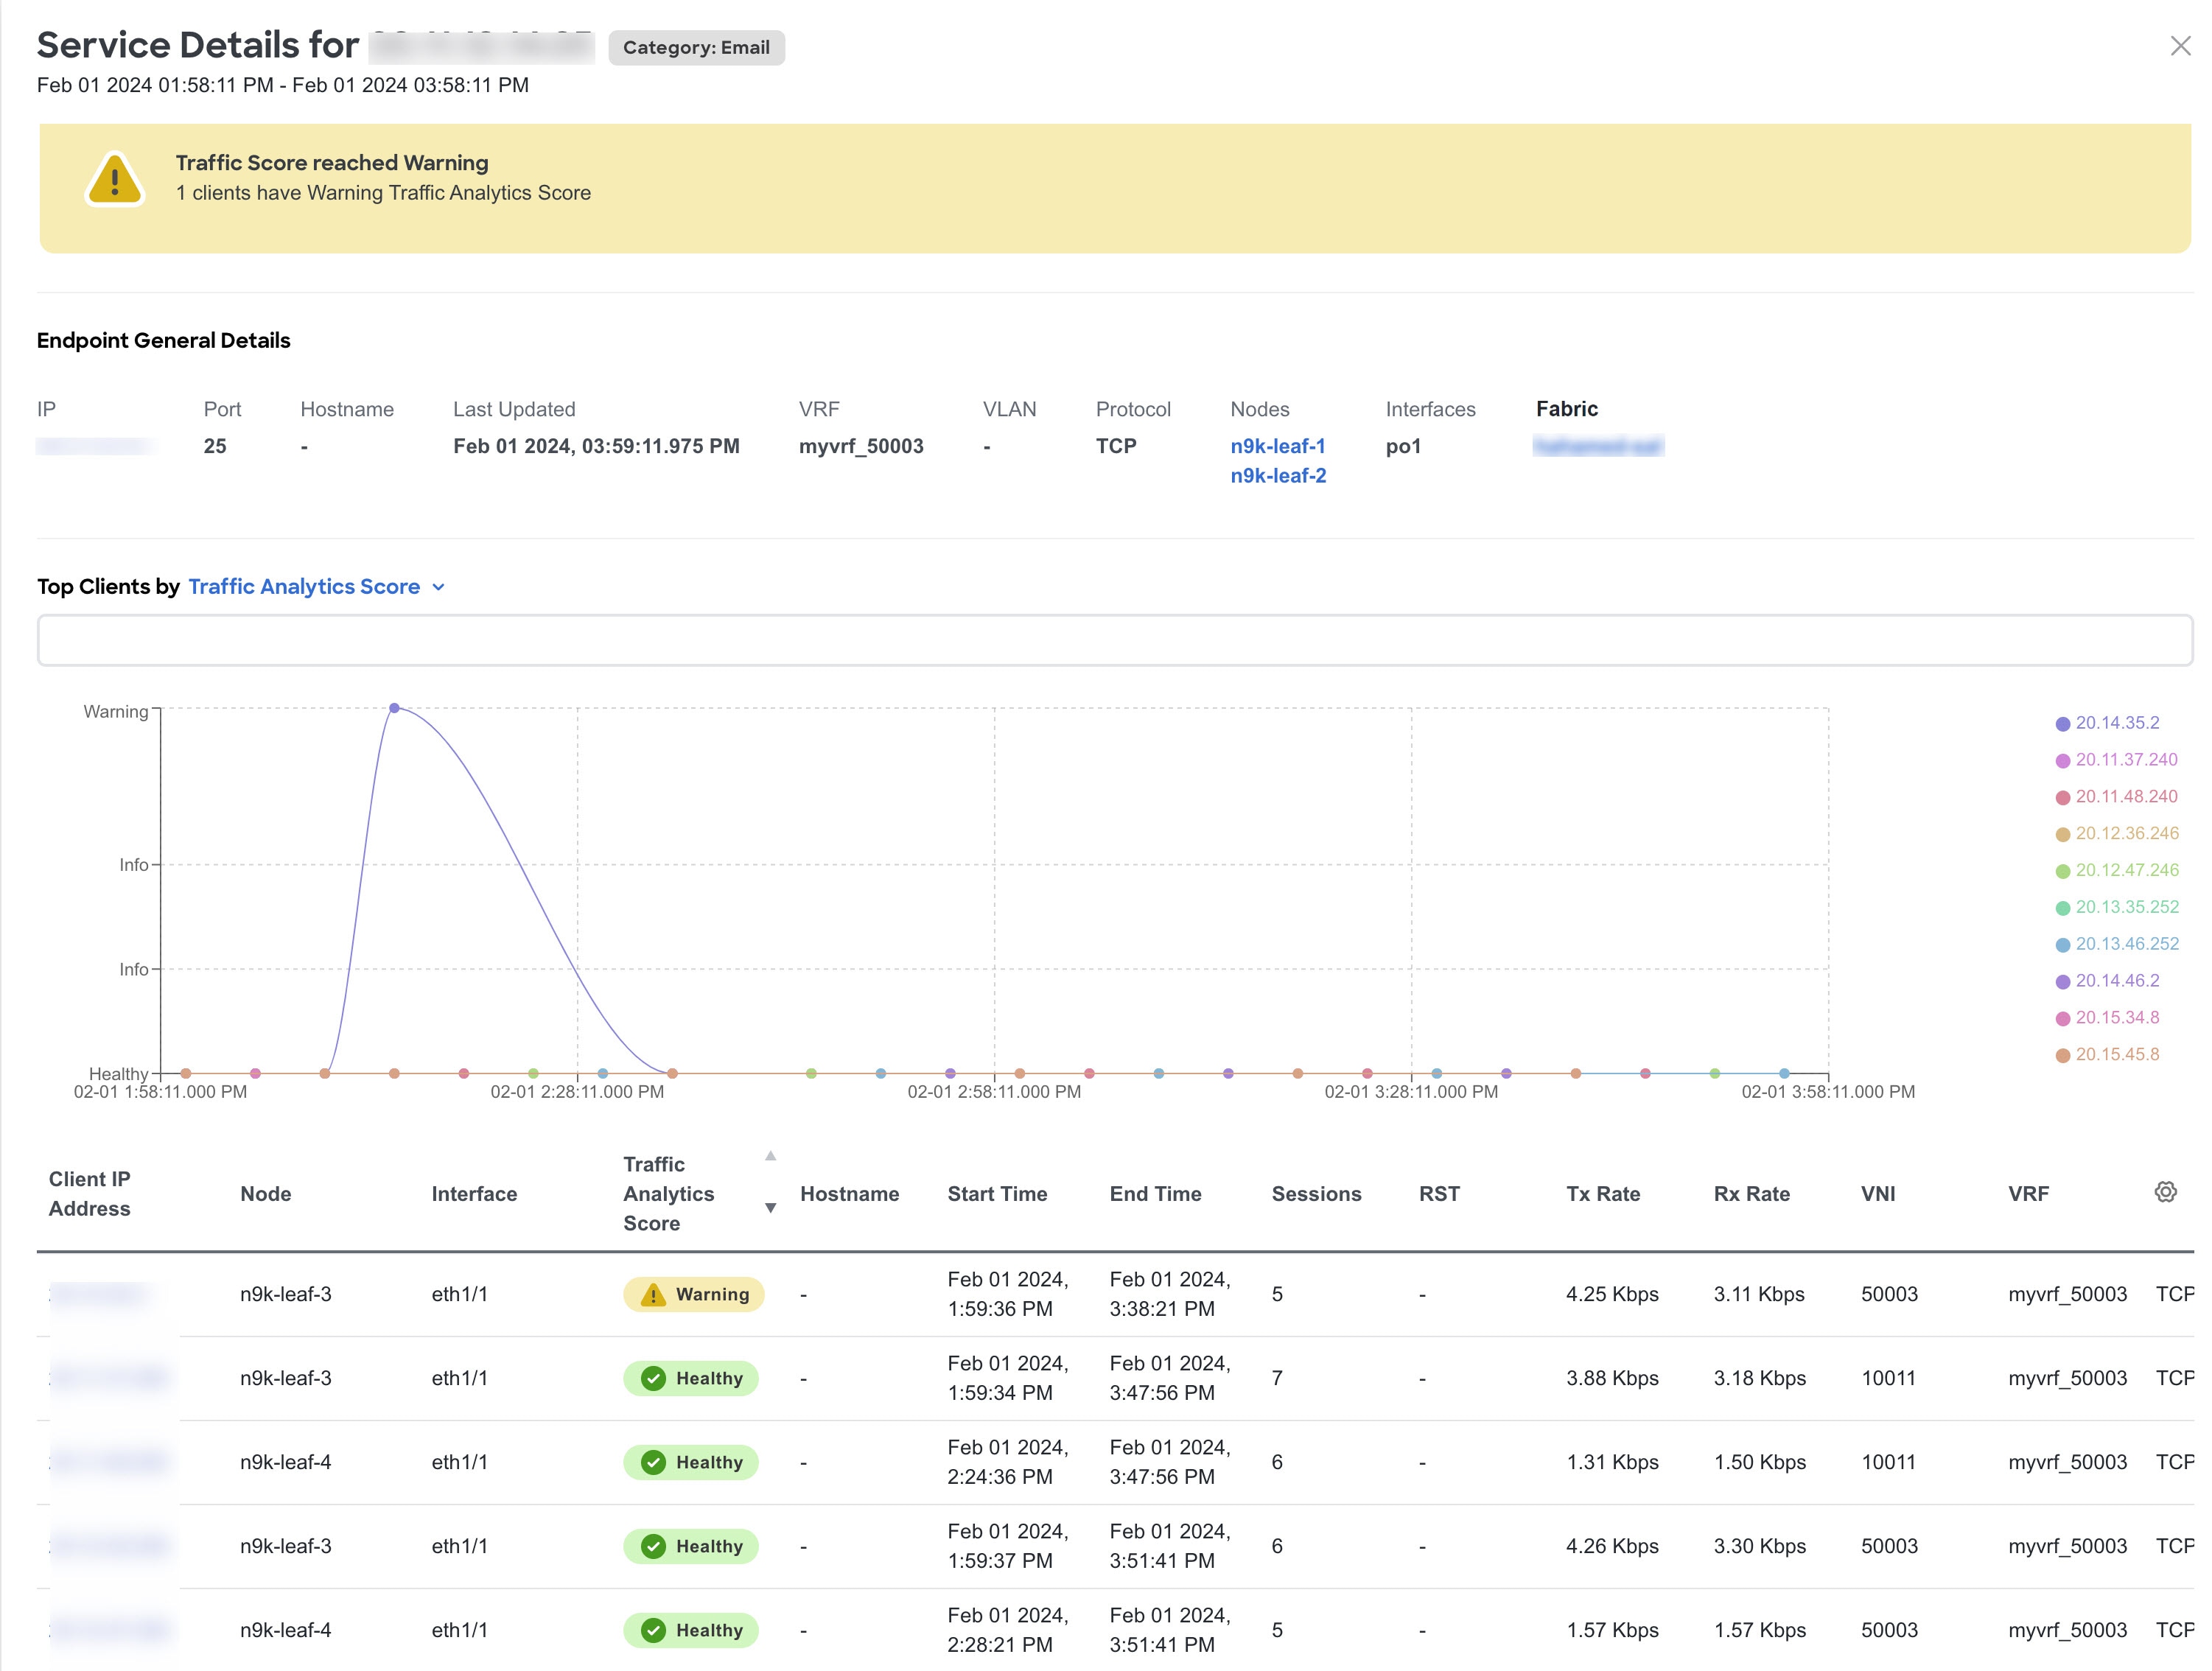
Click Service Port to view details and clients for the particular service.
-
In the Overview area you can view the endpoint details and client details such as top clients and conversation between a client and service.
-
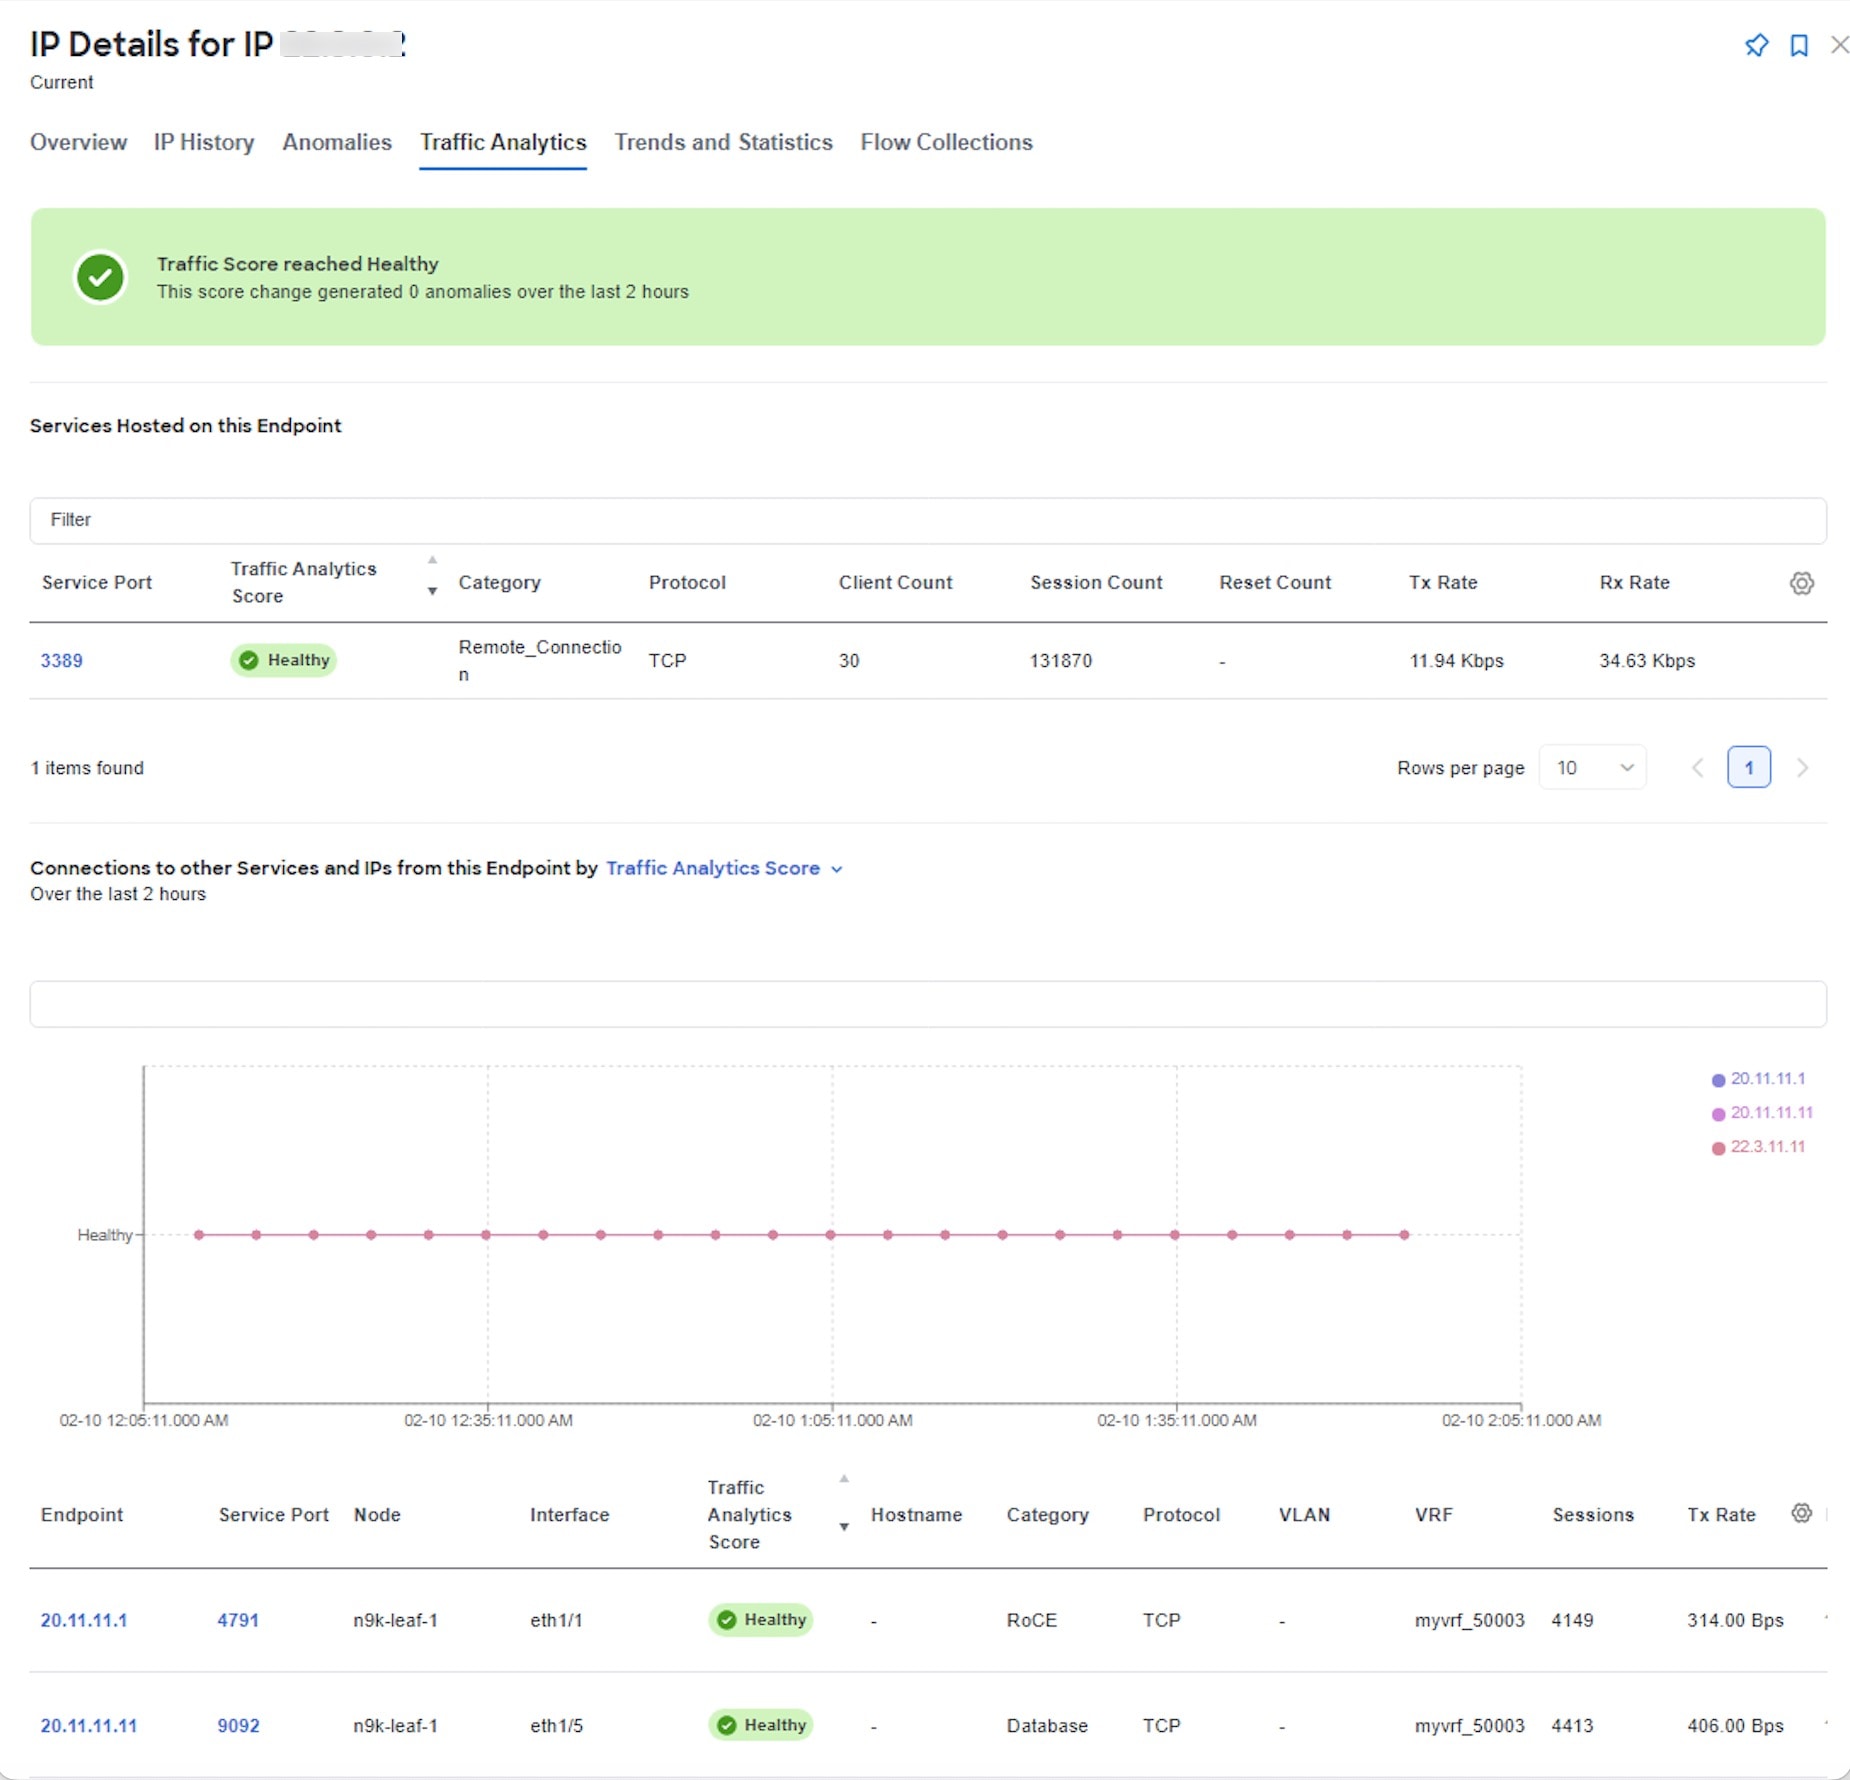
In the Endpoint General Details, click IP Address to view endpoint details. You can view all the services hosted on that endpoint and connections to other services and IP addresses from this endpoint.
-
Use the drop-down list to view the information for Top Clients by Traffic Analytics Score, Latency Score, Drop Score and others.
-
In the Clients table, hover on the Traffic Analytics Score to view the Traffic Analytics Score breakdown for that client.
-
-
In the Trends and Statistics area you the view the trends for values such clients, service, latency and others for that service.
-
In the Anomalies area, you can view the anomalies for the particular service endpoint based on traffic score.
-
In the Flow Collections area, you can view the flow collections for that service.
-
Manage Service Endpoint Categories
In the Manage Service Endpoint Categories area, you can view the ports that have been assigned to categories based on standard networking defaults and any categories you may have created. If a port has not been assigned to a category, you can assign it to one of the existing categories or create a new category. This helps you to organize and manage your network ports more efficiently.
-
Navigate to Analyze > Analyze Hub > Traffic Analytics.
-
Choose a fabric from the drop-down menu.
-
In the Service Category by Score area, click Manage Service Endpoint Categories.
-
To create a new category, click New Categories.
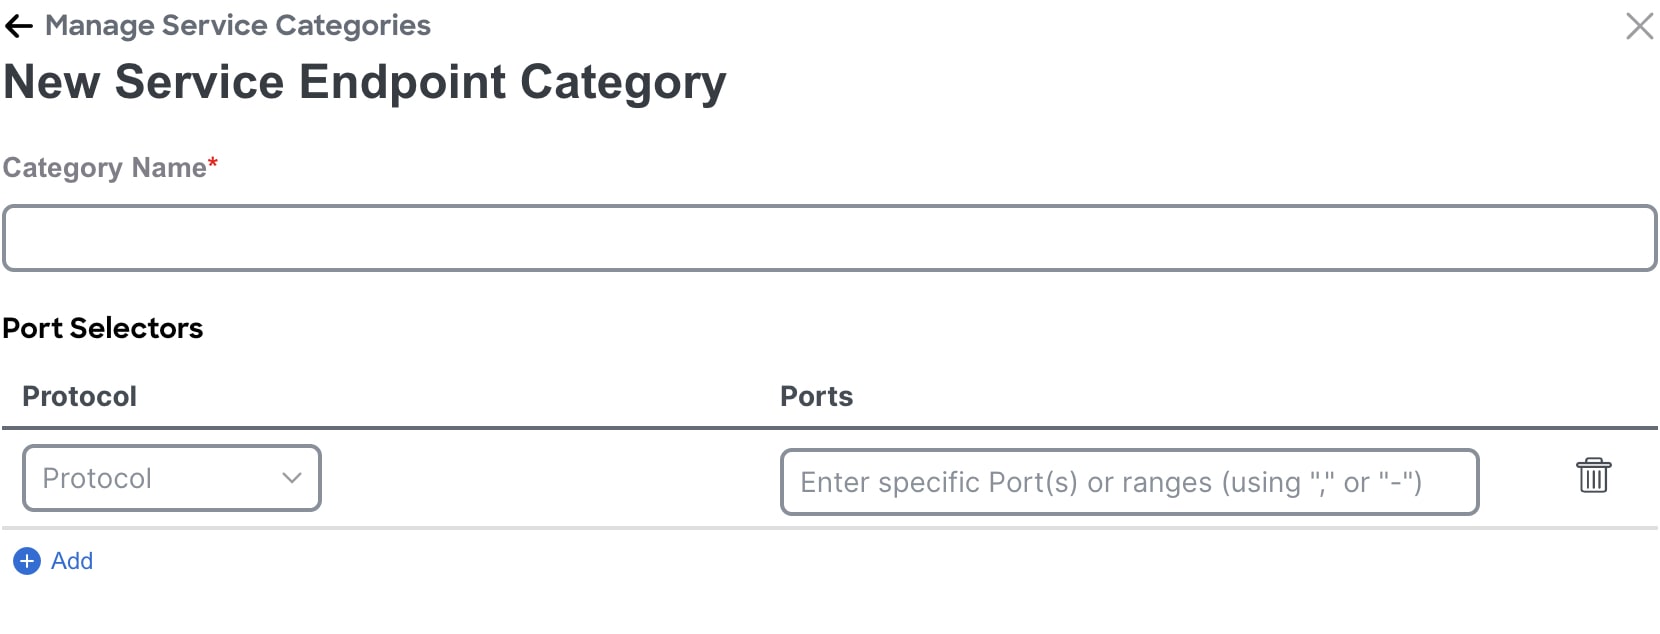
-
Enter the name of the category.
-
From the Protocol drop-down list, choose TCP.
-
In the Ports field, enter the ports or port range.
-
Click Add to add additional protocols.
-
Click Save.
-
To edit a category, click the ellipsis icon and choose Edit.
-
Edit the values and click Save.
-
-
To delete a category, click the ellipsis icon and choose Delete.
-
Click Confirm.
-
View Traffic Analytics for Endpoints
-
Navigate to Manage > Fabrics.
-
Click fabric name.
-
Navigate to Connectivity > Endpoints.
-
In the Endpoint table click an IP address.
-
In the IP Details page, click Traffic Analytics to display the Traffic Analytics view for endpoints.
Flow Troubleshoot Workflow
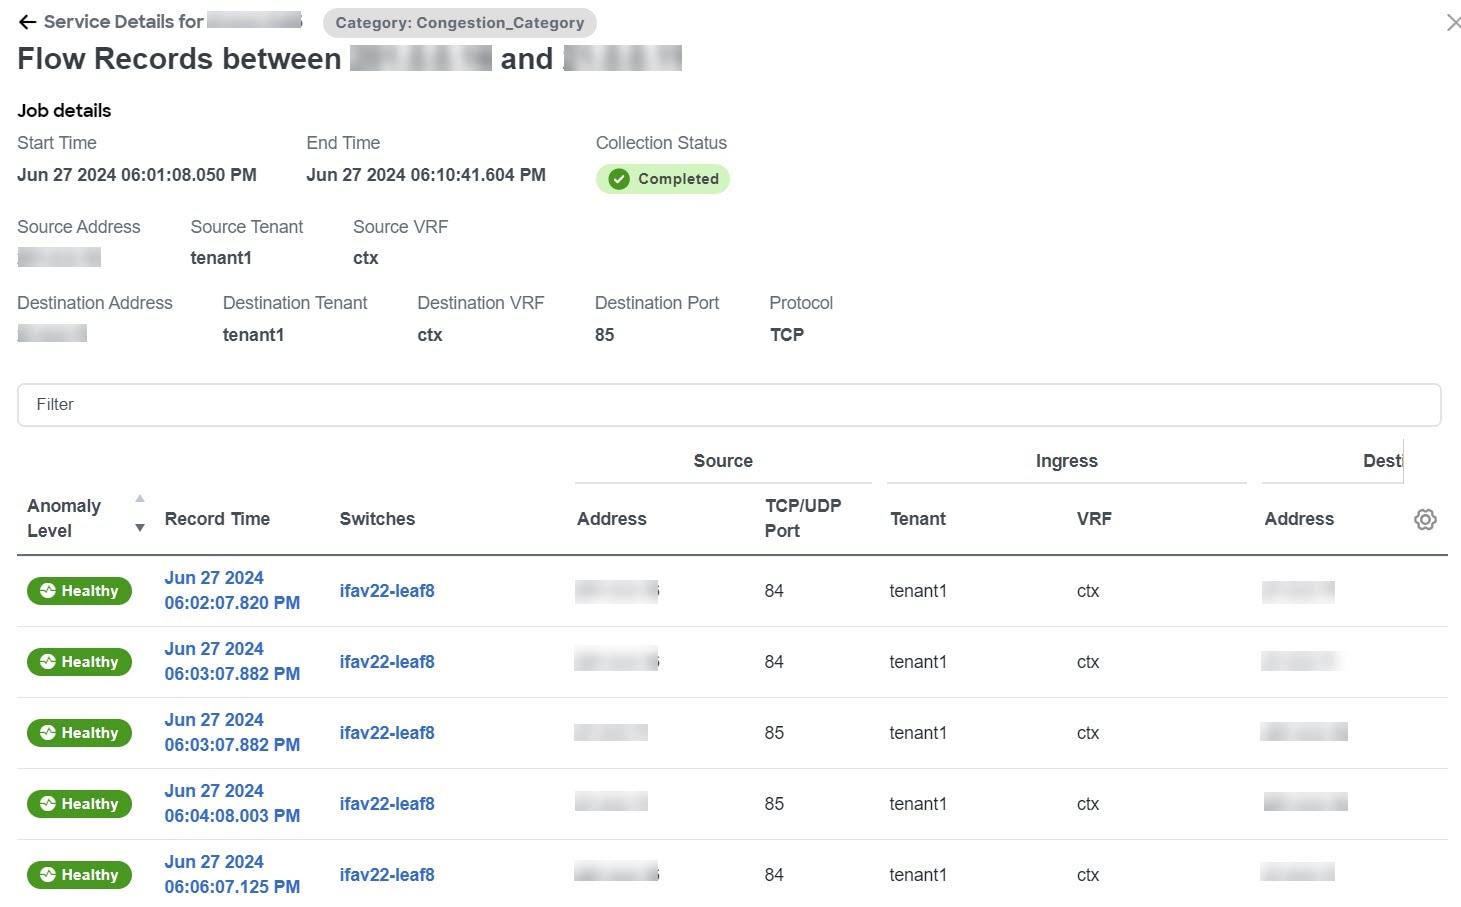
The flow troubleshoot workflow enables you to collect all the flow records between two endpoints. Nexus Dashboard Insights allows you to specify the duration for flow collection and then collect records between specific endpoints for the specified duration. As a result you can view the path visualization, 5-tuple flow information, and any issues seen on individual flows.
-
Navigate to Analyze > Analyze Hub > Traffic Analytics.
-
Choose a fabric from the drop-down menu.
-
Choose a time range from the drop-down menu. By default the Current time (last 2 hours) is chosen.
-
In the View x by y area’s table, choose an endpoint and click the endpoint’s port number under Service Port.
-
In the Service Details page, click the ellipsis icon for a client IP address and choose Start Flow Collection. You might need to scroll all the way to the right in the table of client IP addresses to see the ellipsis icon.
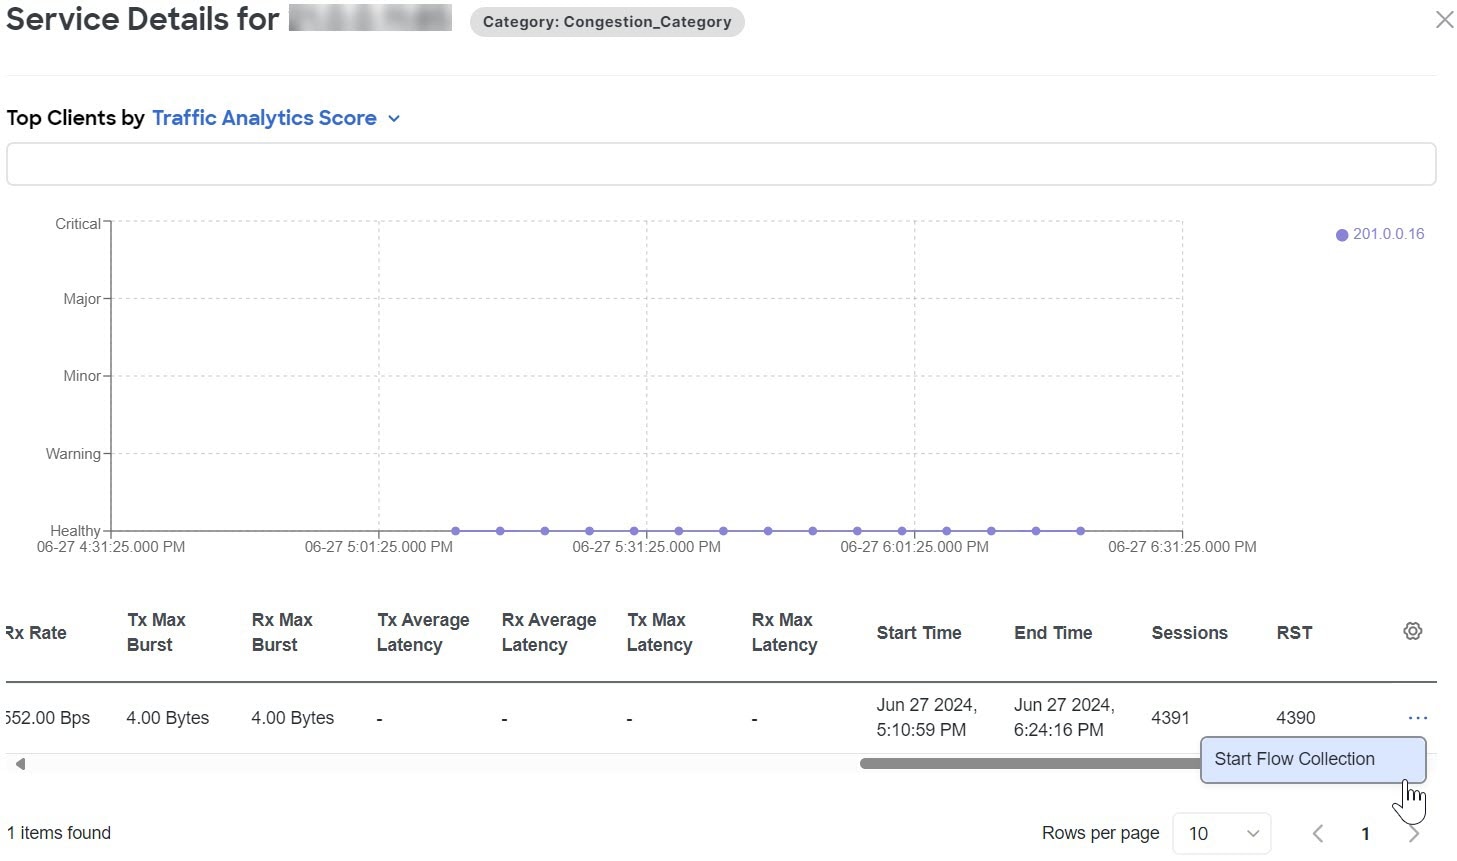
-
Choose the duration to collect flow records for a specific time period. Click Start and go to Flow Collections Tab.
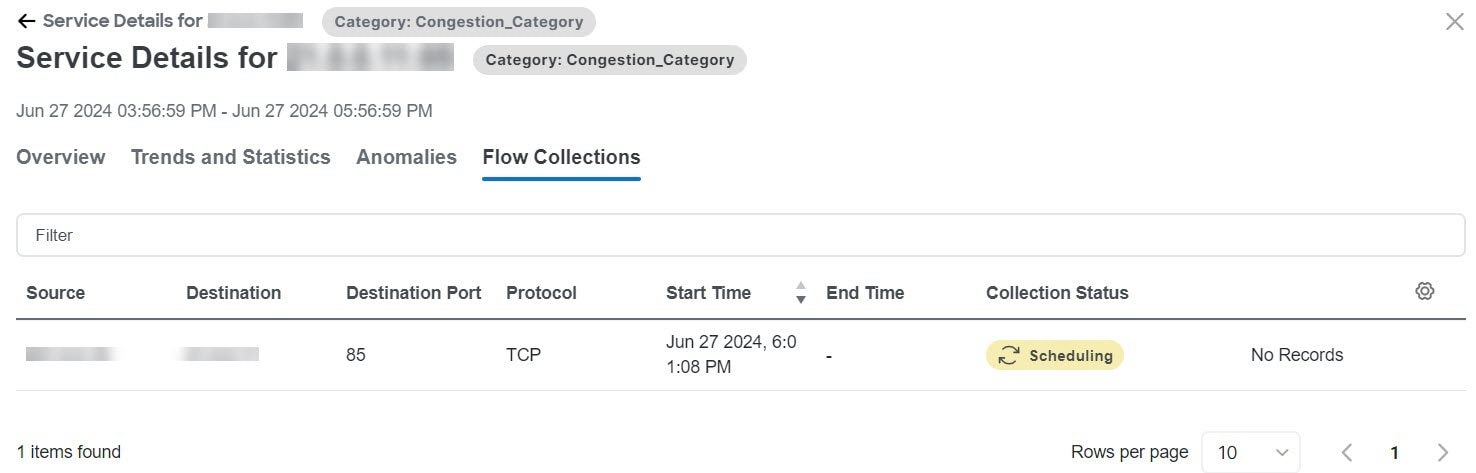
-
After the Collection Status displays Completed, click View Records to view the flow record details for that specific service endpoint.
-
To view the flow collection for a fabric, navigate to Manage > Fabrics, choose a fabric, and click Connectivity > Flow Collections.
-
To perform flow collection for non-TCP flows, perform these substeps:
-
In the endpoints table, click the service port for an endpoint. The Service Details page for that endpoint appears.
-
In the Endpoint General Details area, click the IP address. The IP Details page for that IP address appears.
-
Click the Traffic Analytics tab.
-
In the endpoints table, click the ellipsis icon for an endpoint and choose Start Flow Collection. You might need to scroll all the way to the right in the table of endpoints to see the ellipsis icon.
-
Flow troubleshoot may not show all the switches through which packet traverses for each record in the following scenarios:
-
When there are flow drops in Nexus Dashboard Insights
-
When there are table collisions in the hardware
Sustainability Report
Sustainability Report
The Cisco Nexus Dashboard Insights sustainability report helps you monitor, predict, and improve your network’s energy usage, its related carbon emissions, and its total energy cost. The sustainability report enables you to get insights on energy utilization, CO2 emissions, and energy cost for all your fabrics on a monthly basis.
The report is generated by calculating the monthly values for Power Consumption and by summing the usage data across all of your devices at each of your fabrics for every single day in the chosen month. This data is then combined with the Cisco Energy Manager to provide greater insight into what that usage means in terms of energy cost, estimated emissions, and estimated switch power consumption. For more information about the Cisco Energy Manager, see Cisco Energy Manager.
The summary area of the report contains information such as estimated cost, estimated switch power consumption, sources of emission, and estimated emissions.
-
Estimated Cost gives you insight into any expected increase or decrease in your fabrics' energy bills based on your monthly energy use.
-
Estimated Switch Power Consumption gives you insight into how efficiently your switches are using electricity. Estimated PDU Power Consumption gives you insight into how much electricity your devices or Panduit power distribution units (PDUs) are using.
-
Estimated Emissions gives you insight into the sustainability your fabrics have on your total CO2 emissions, based on the sources and amount of energy used.
If you have Panduit PDUs onboarded to Nexus Dashboard, you can use the Data Source toggle to see two different electricity values on the sustainability report: one for switches only, and one for PDUs.
-
Switch Data: Uses only the electricity data reported by individual switches added to a fabric.
-
PDU Data: Uses the electricity data reported by a supported PDU, which could include switches, fans, and any other devices physically plugged into the PDU.
Depending on which value you choose in the Data Source toggle, the values calculated for your other metrics, including estimated cost and emissions, will vary.
The retention time for the sustainability report in Nexus Dashboard Insights is 12 months.
Cisco Energy Manager
The Cisco Energy Manager is a service developed by Cisco that collects data from various data providers and consolidates the GHG emissions and the source of the energy from the data. The Cisco Energy Manager is hosted in a Cisco Intersight cloud.
View the sustainability report for switches
-
Navigate to Analyze > Analysis Hub > Sustainability Report.
-
Choose an online fabric or multiple online fabrics from the drop-down menu.
-
Choose a time range from the drop-down menu.
-
Use the Display data from toggle to display data from switches.
-
Click Prepare Report.
The sustainability report displays At A Glance, Cost, Energy, and Emissions information for a particular fabric in the chosen month.
-
Examine the At A Glance area to see a summary of the estimated cost, estimated switch power consumption, and estimated emissions in the chosen month. Click the Learn More icon for more information.
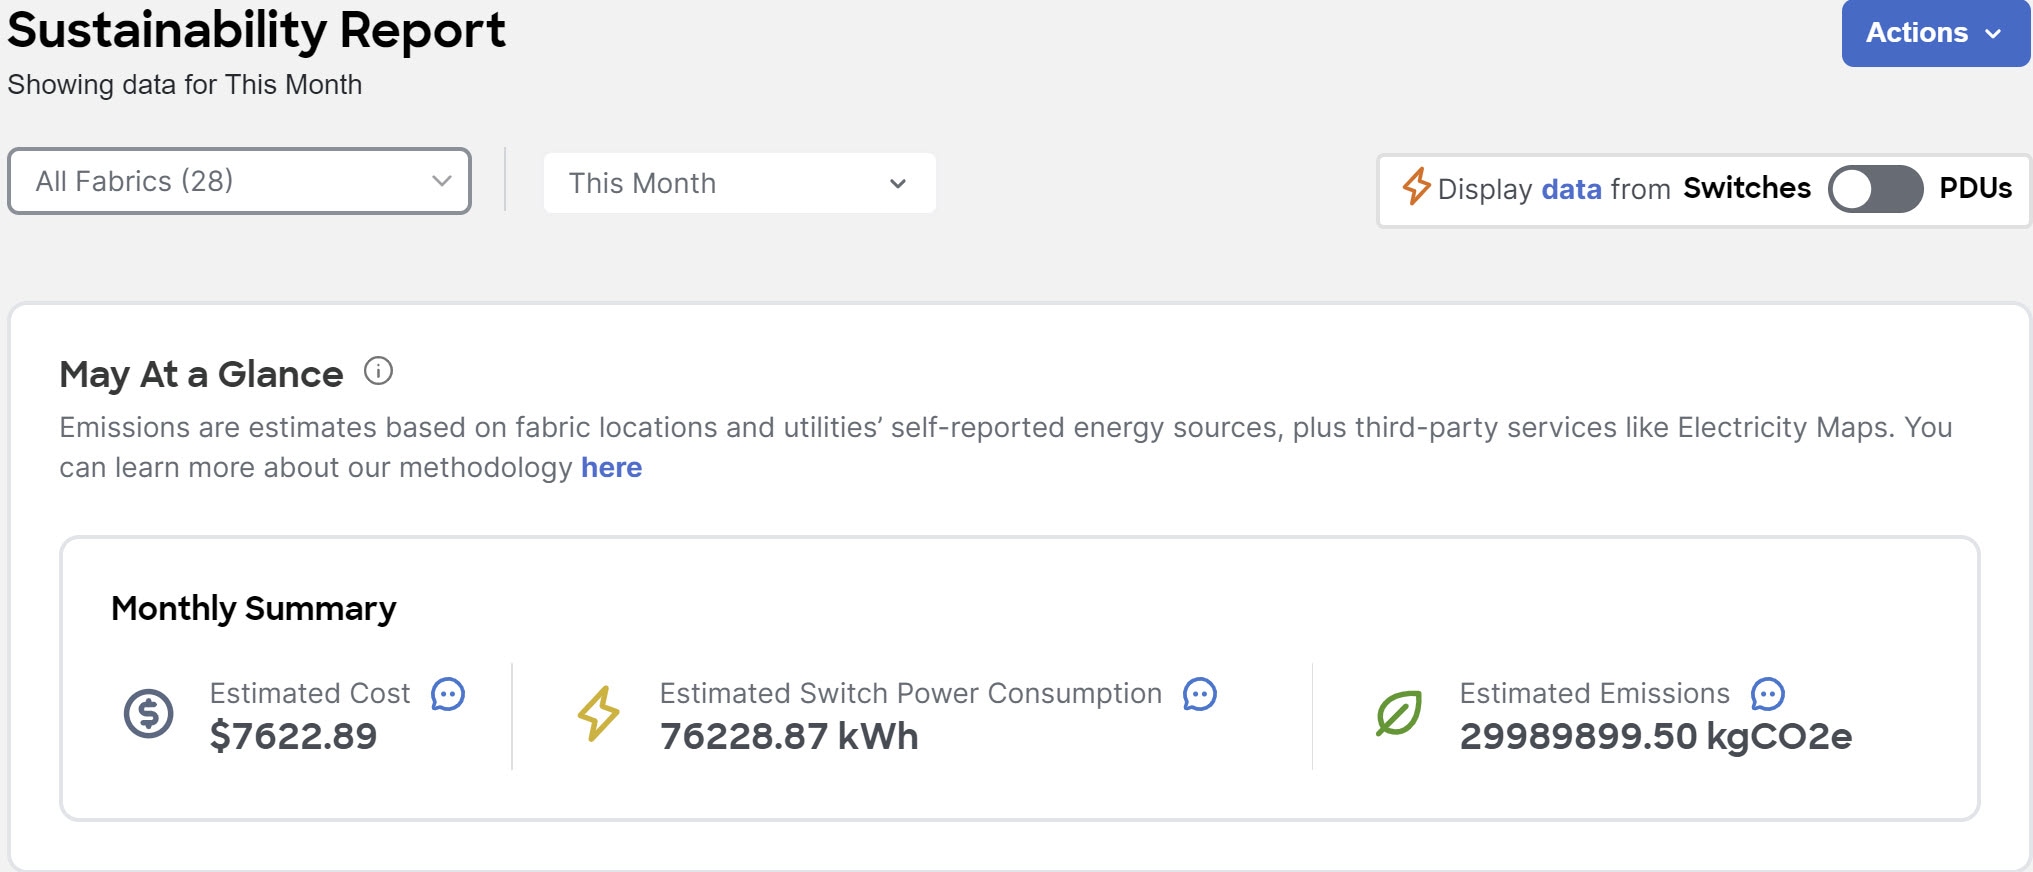
-
Examine the Cost area to see the estimated daily cost in the chosen month and share of daily cost per fabric.
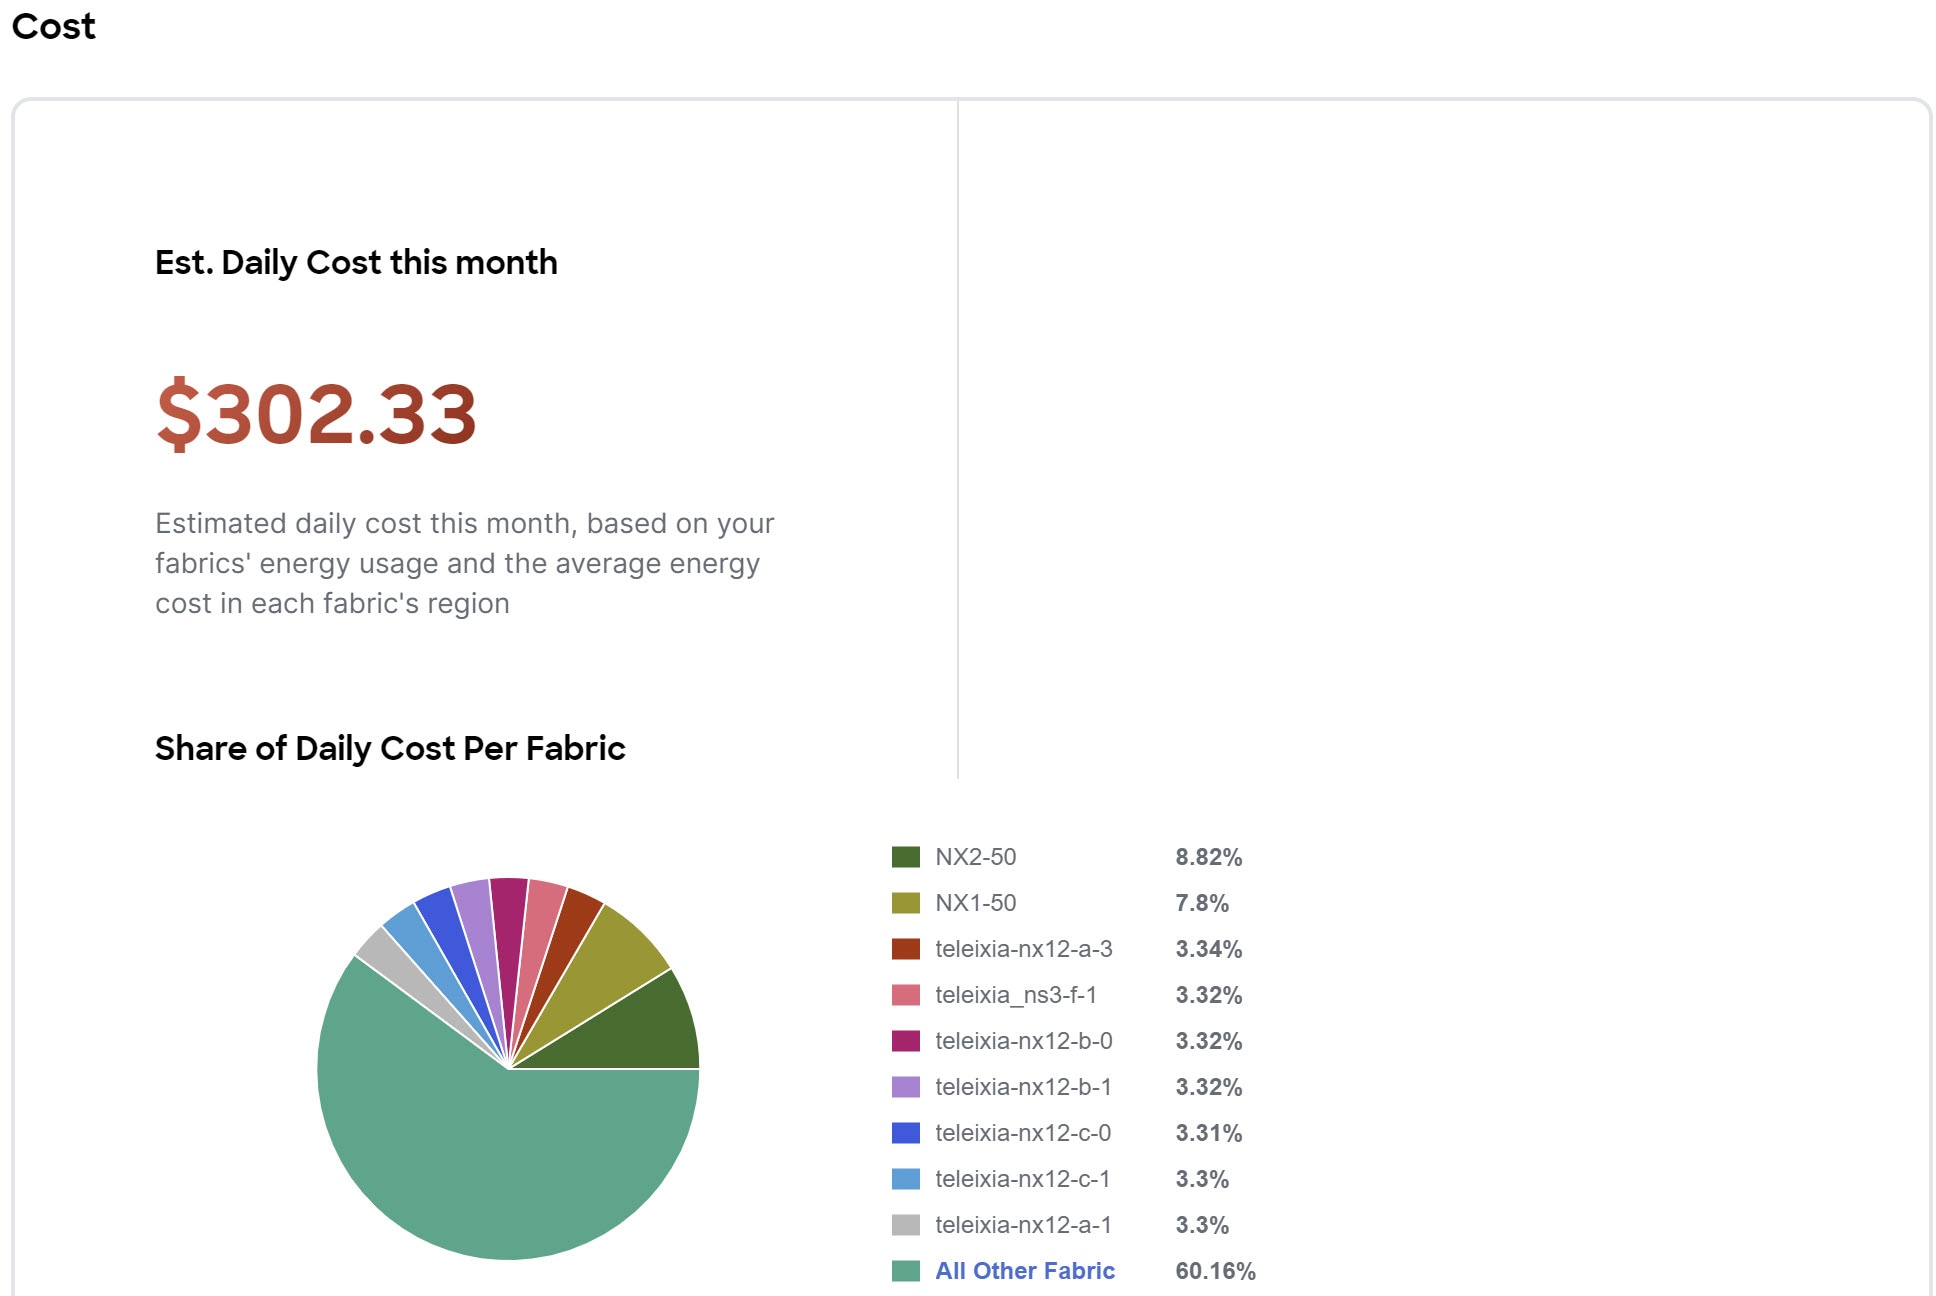
-
(Optional) From the Actions menu, choose Fabric Energy Settings to customize your average cost for the current month for a more accurate estimate. To calculate cost estimates, Nexus Dashboard Insights uses values based on the average cost of grid energy for each region.
-
Examine the Energy area to see the energy usage in the chosen month in kWh.
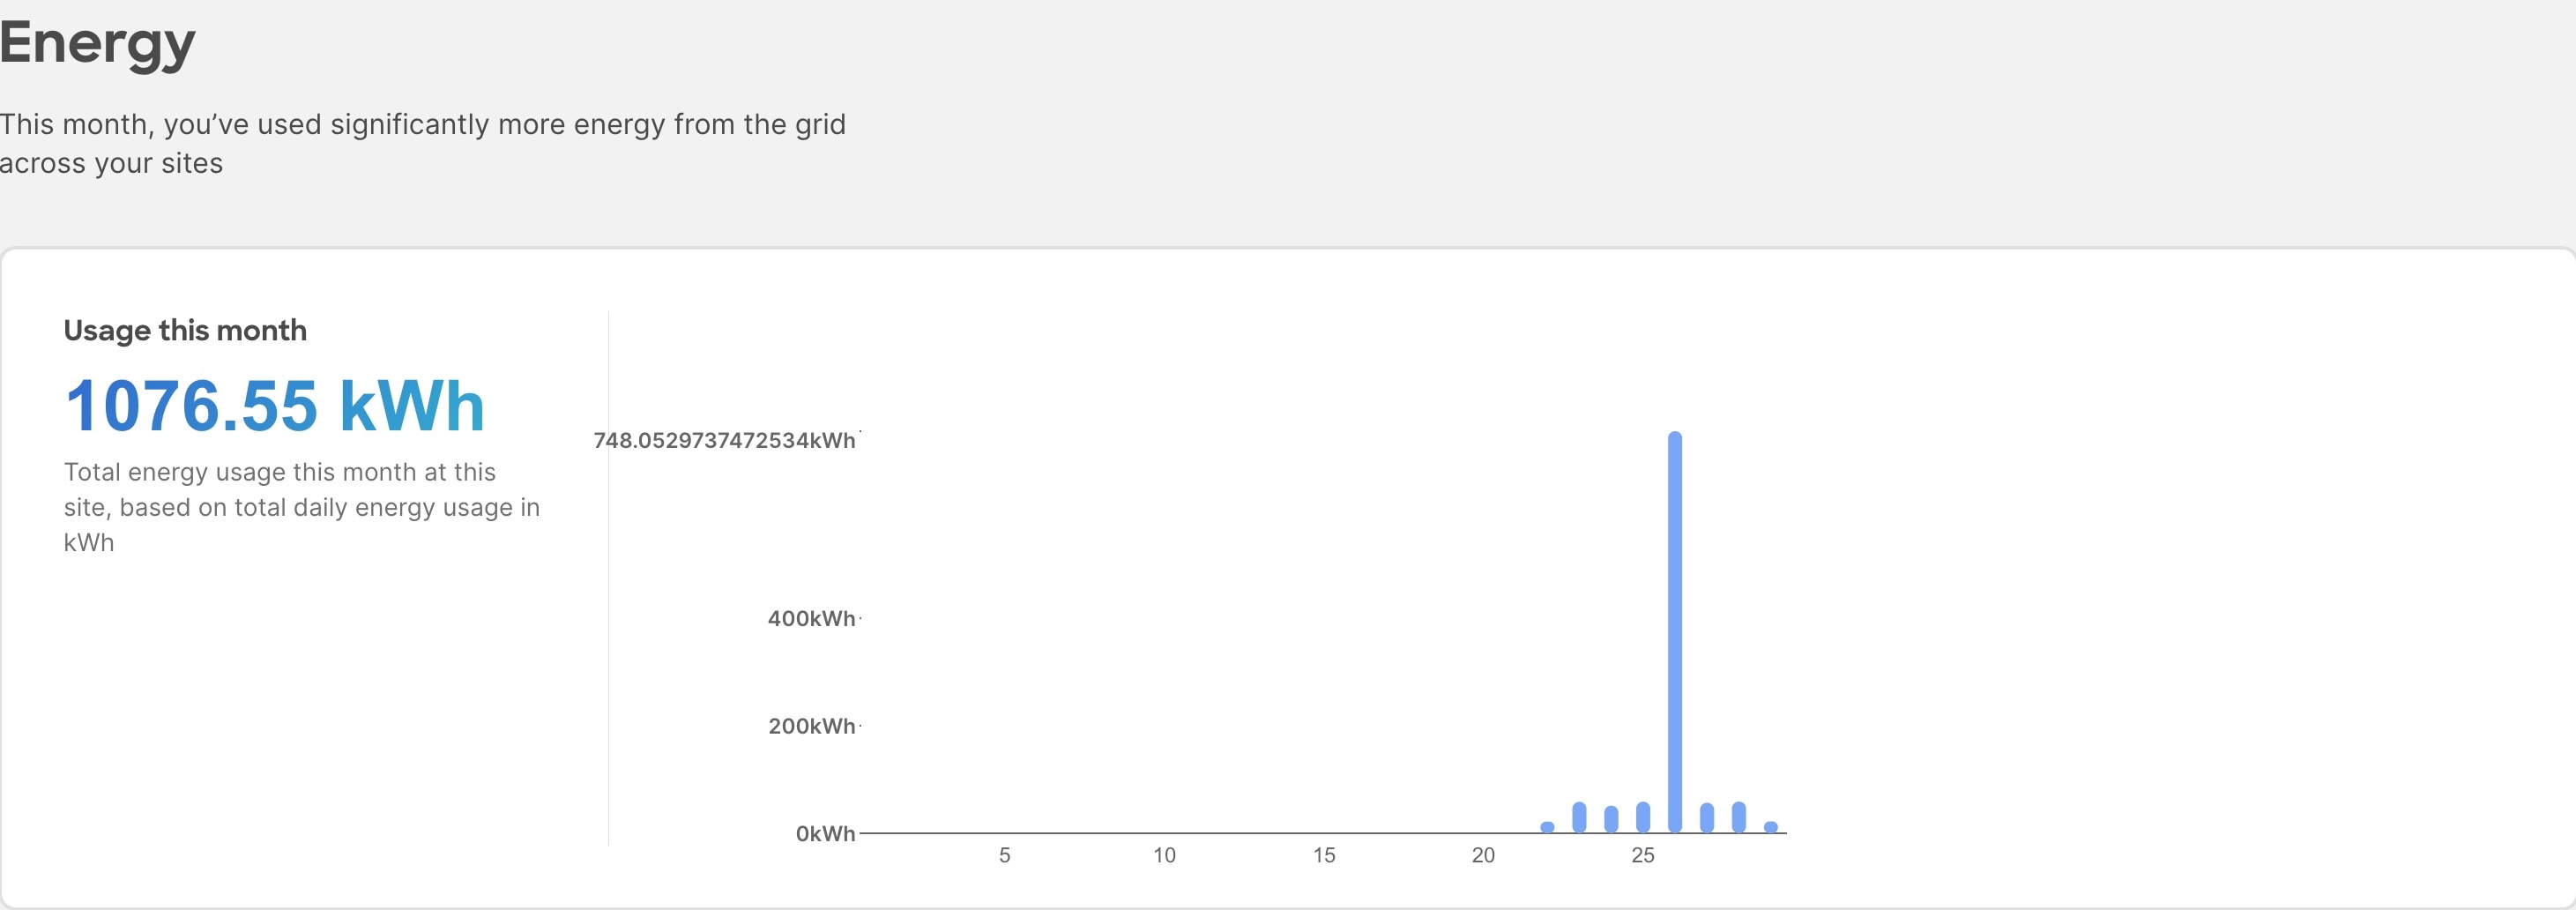
-
Examine the Emissions area to see the total emissions or efficiency index per fabric, estimated monthly carbon dioxide equivalent emissions, average percentage of energy from low-carbon sources and other sources, and percent of total energy used during each three-hour reporting period by source over all of the days in the chosen month.
For total emissions or efficiency index per fabric, use the toggle to view the information in graphical format or tabular format.
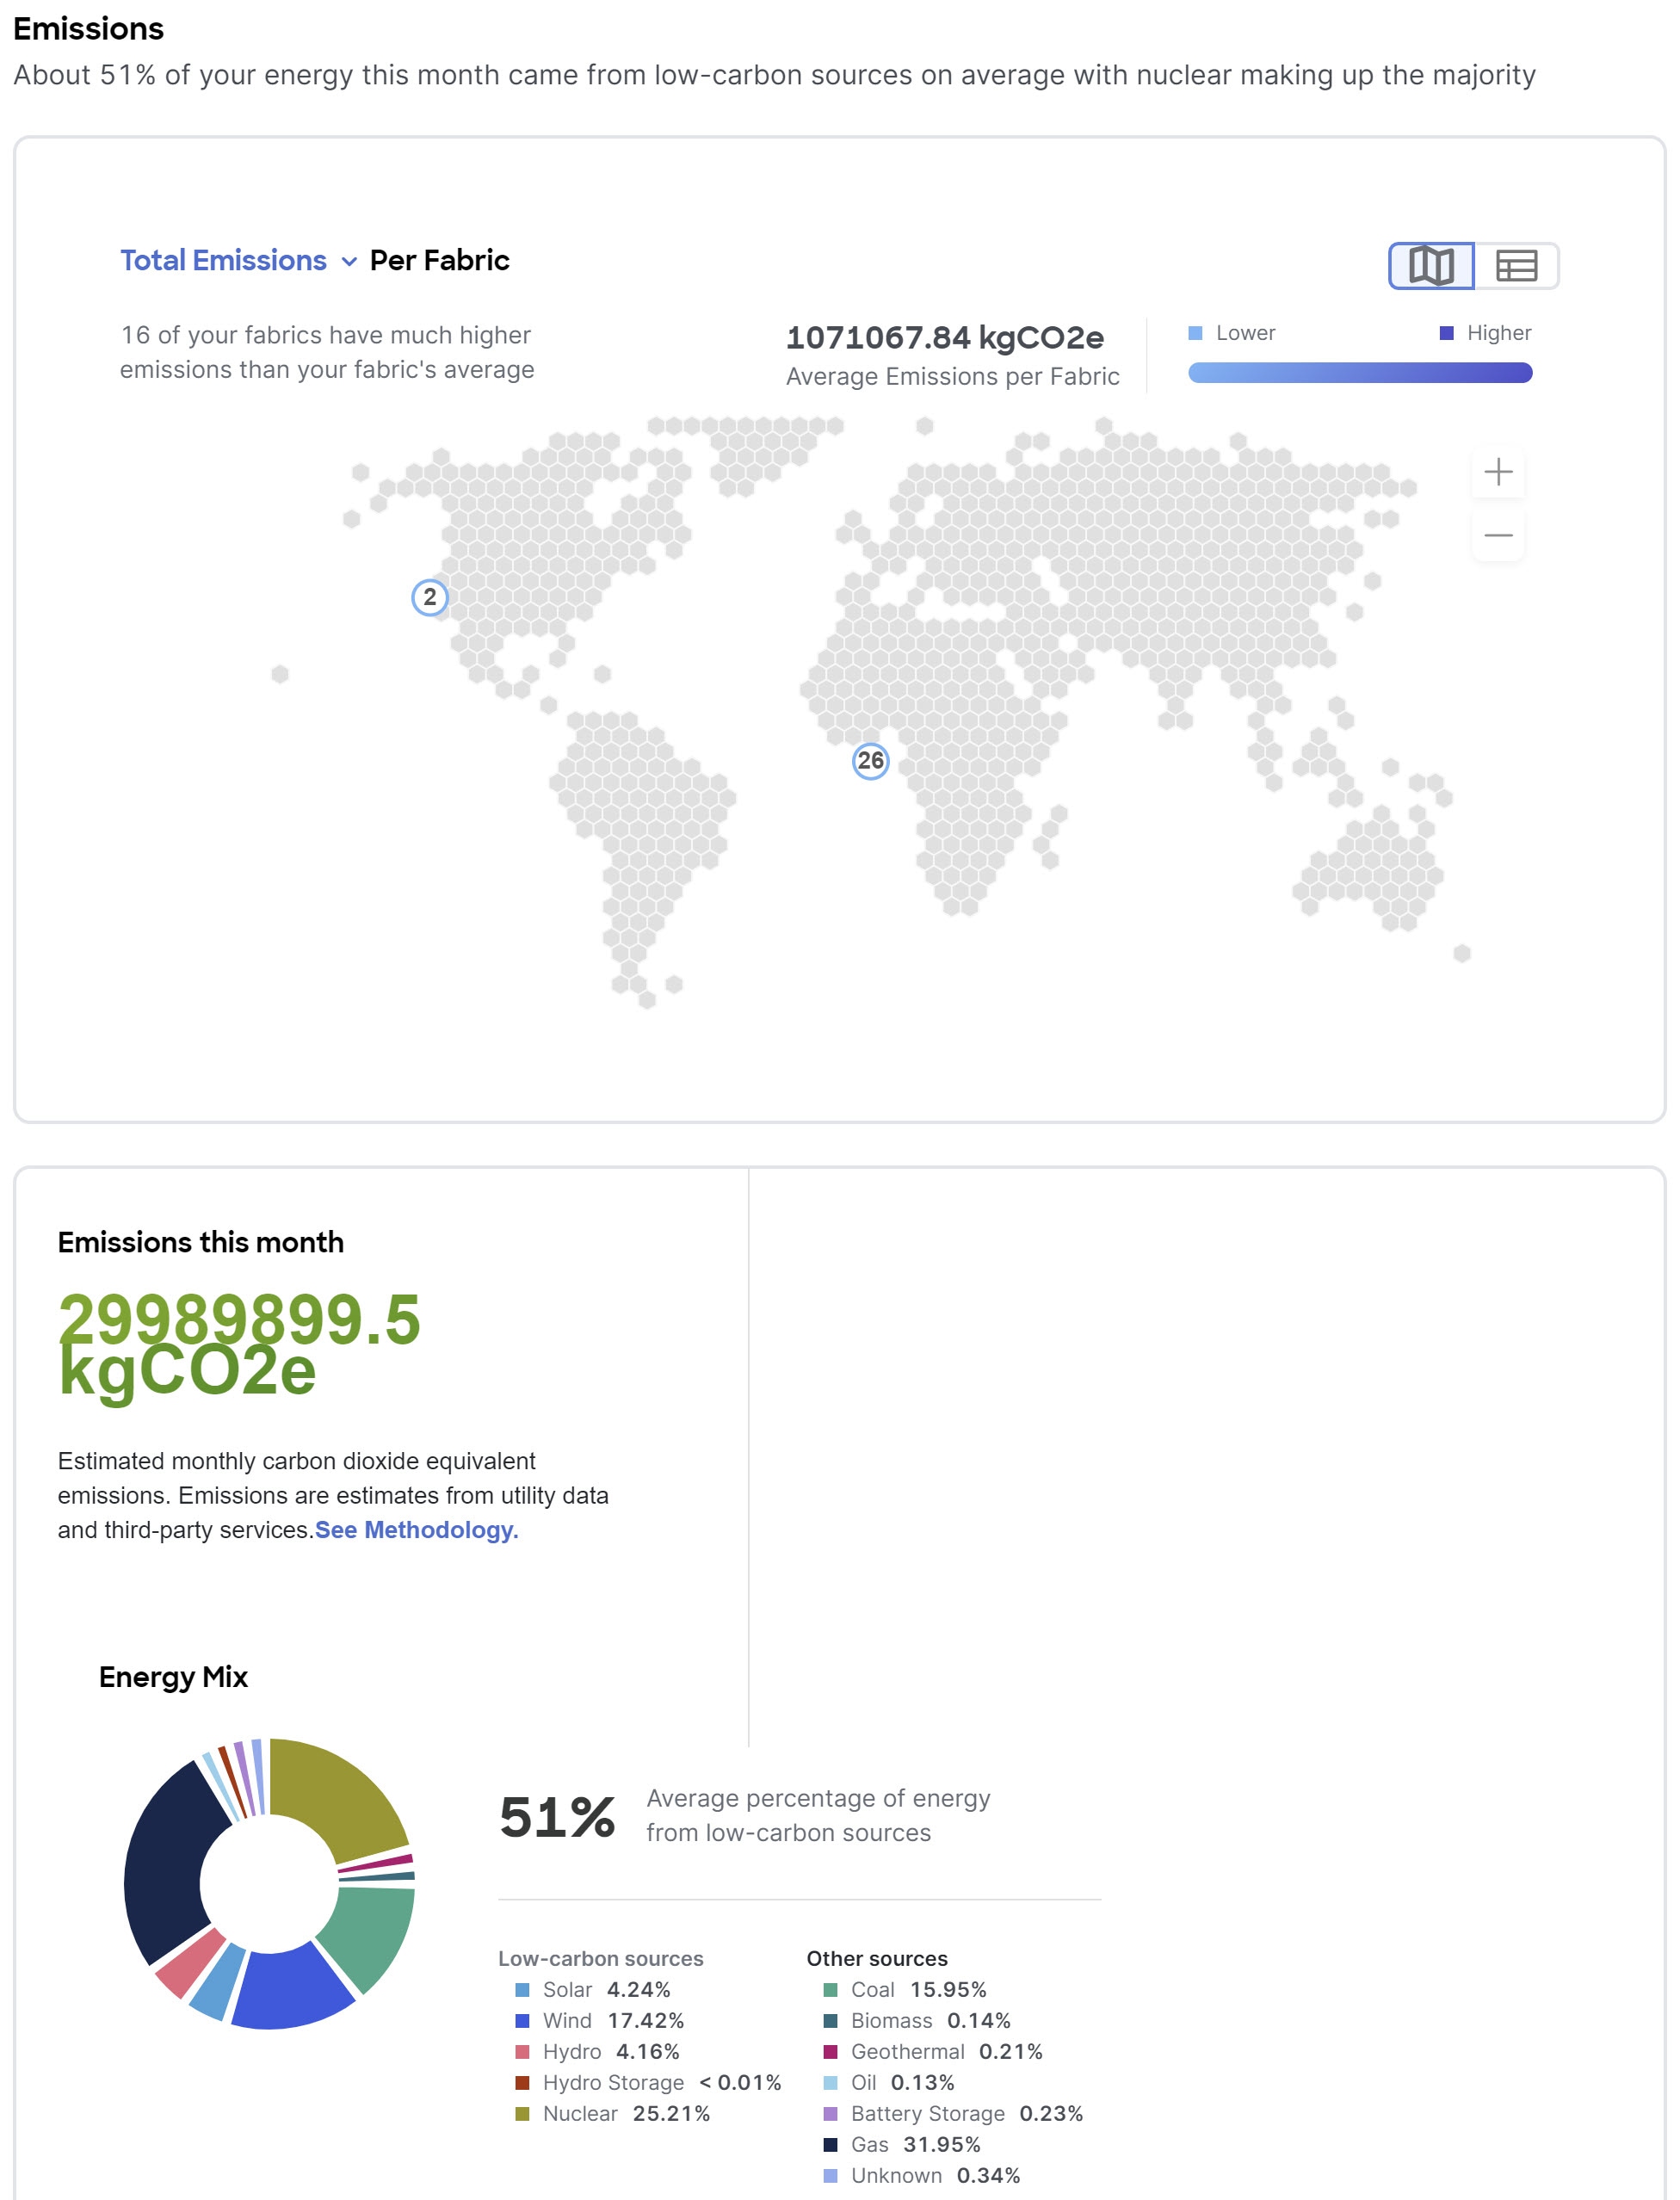
-
Examine the Top 5 Devices area to see the top 5 devices for the highest estimated cost, most energy consumed, and highest estimated greenhouse gas (GHG) emissions.
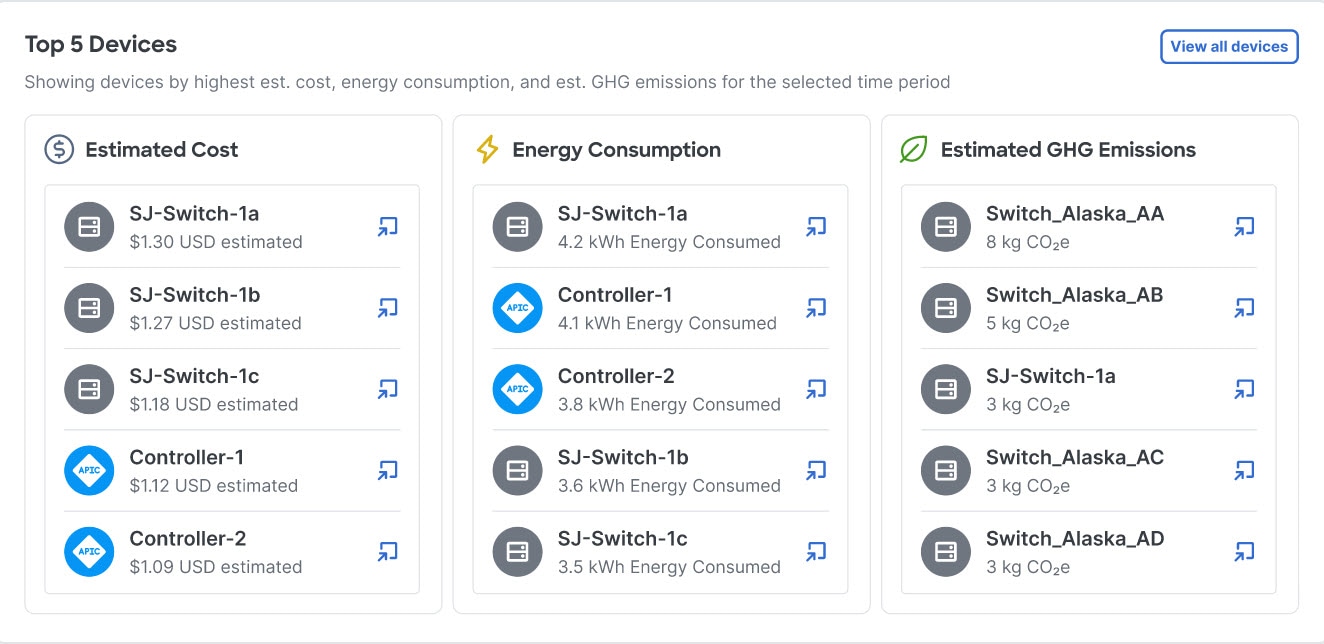
Click View all devices to see the data for all devices, not just the top 5.
-
Choose a fabric from the fabric drop-down menu to view the hourly energy mix.
Hourly energy mix displays the amount of total energy used during each three-hour reporting period by source, over all of the days in the chosen month. The minimum period before you can generate the next report is 3 hour.
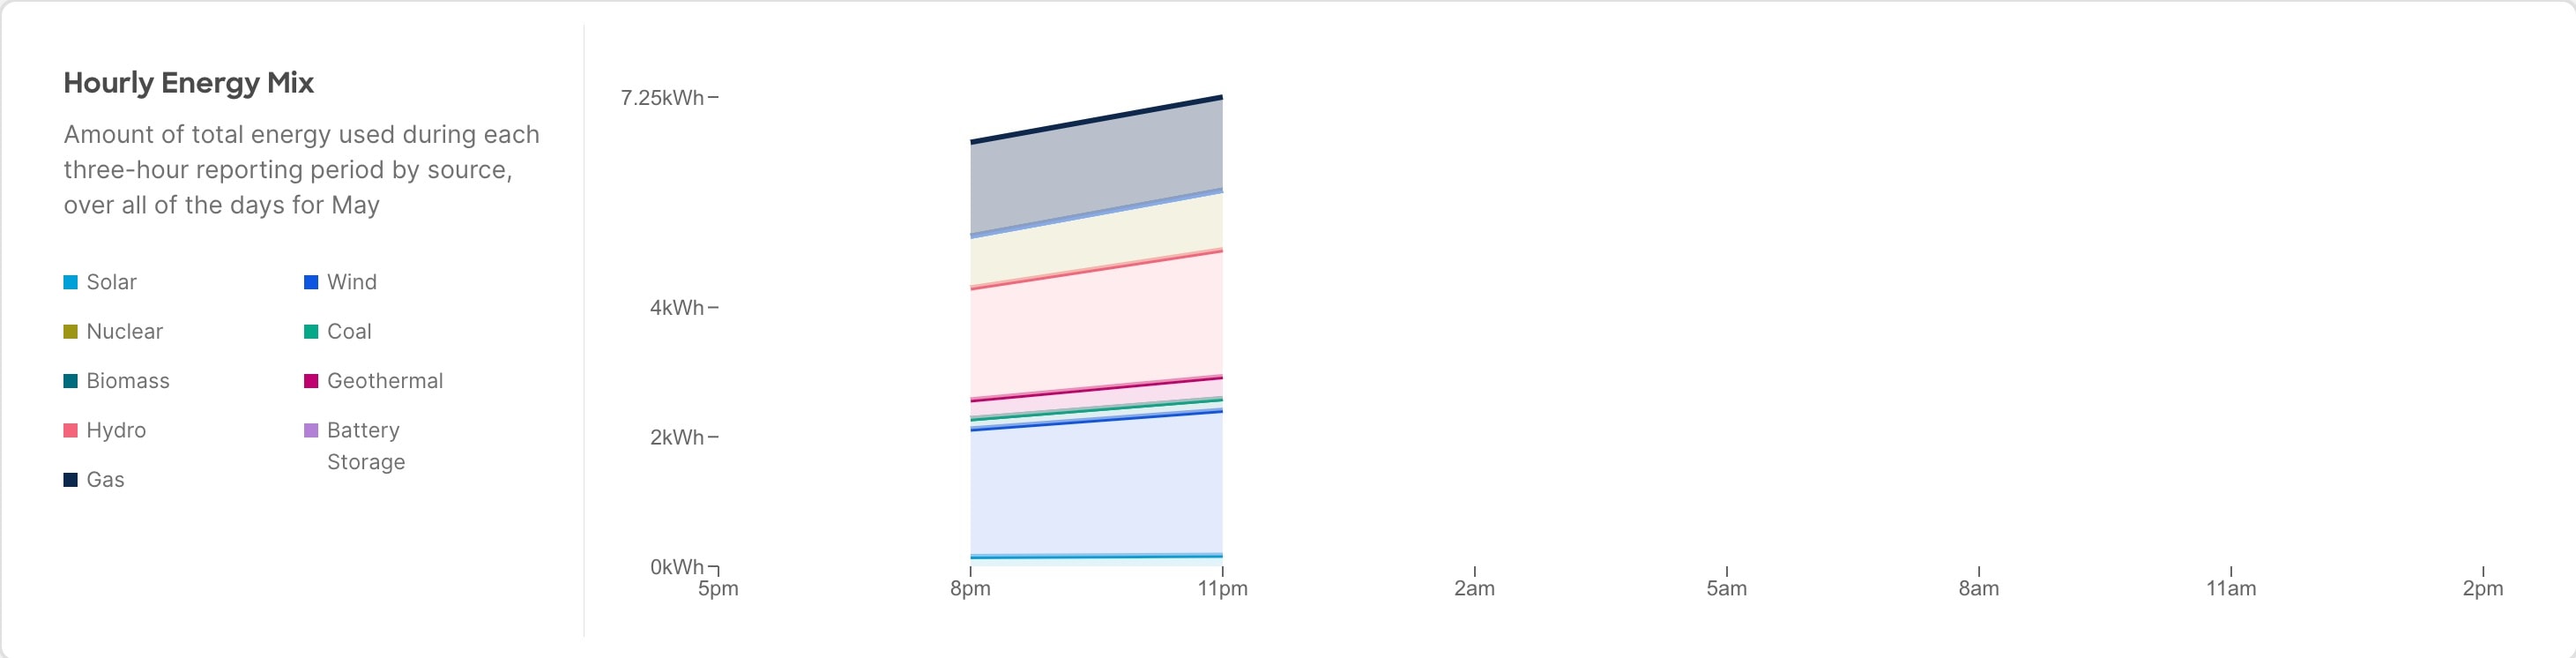
View the sustainability report for PDUs
-
Navigate to Analyze > Analysis Hub > Sustainability Report.
-
Choose an online fabric or multiple online fabrics from the drop-down menu.
-
Choose a time range from the drop-down menu.
-
Use the Display data from toggle to display data from PDUs.
-
Click Prepare Report.
The sustainability report displays At A Glance, Cost, Energy, and Emissions information for a particular fabric in the chosen month.
-
Examine the At A Glance area to see a summary of the estimated cost, estimated switch power consumption, and estimated emissions in the chosen month. Click the Learn More icon for more information.
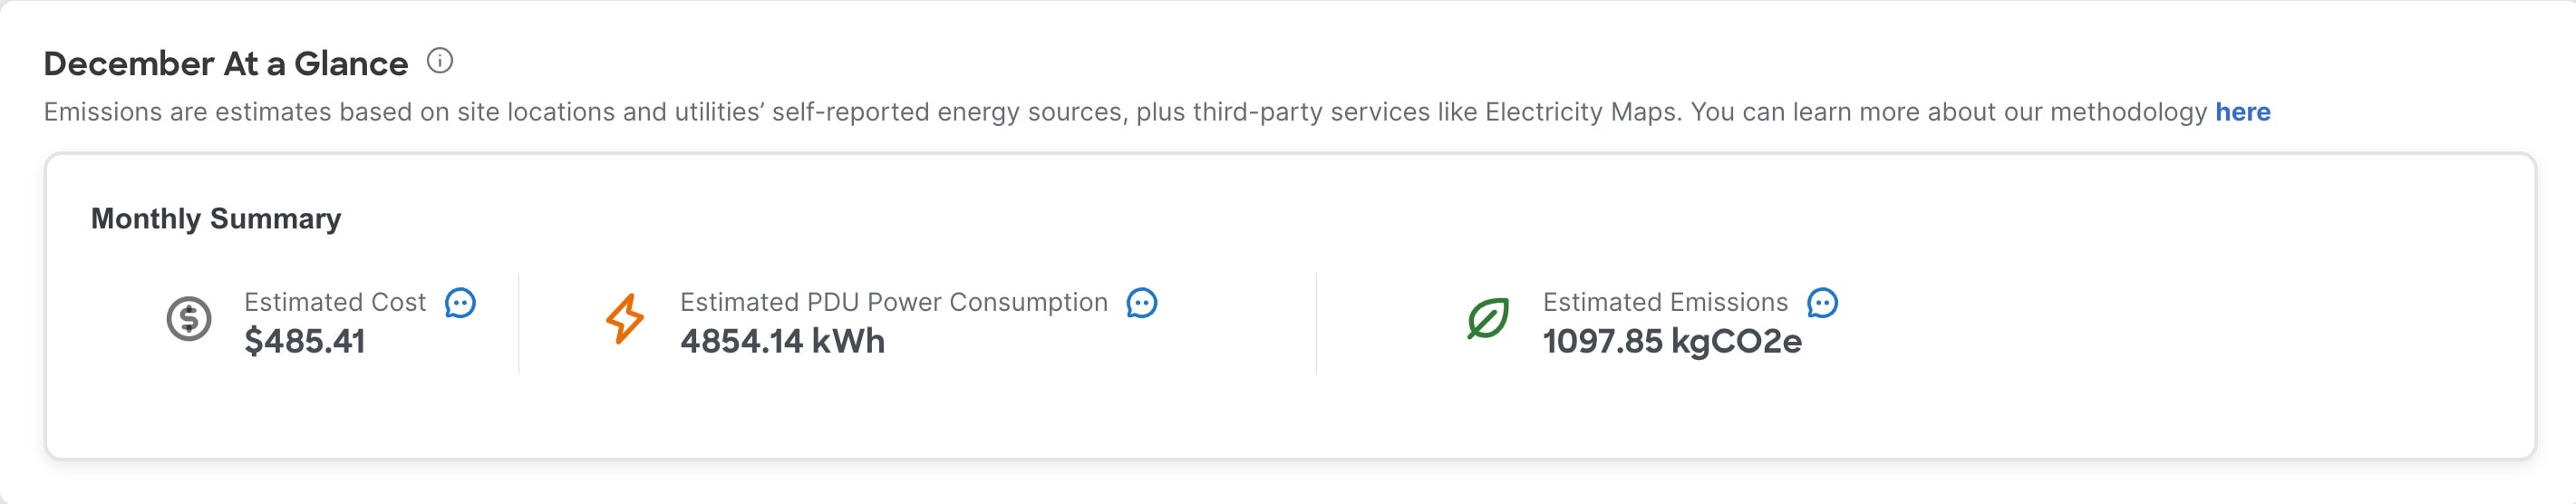
-
Examine the Cost area to see the estimated daily cost in the chosen month and share of daily cost per fabric.
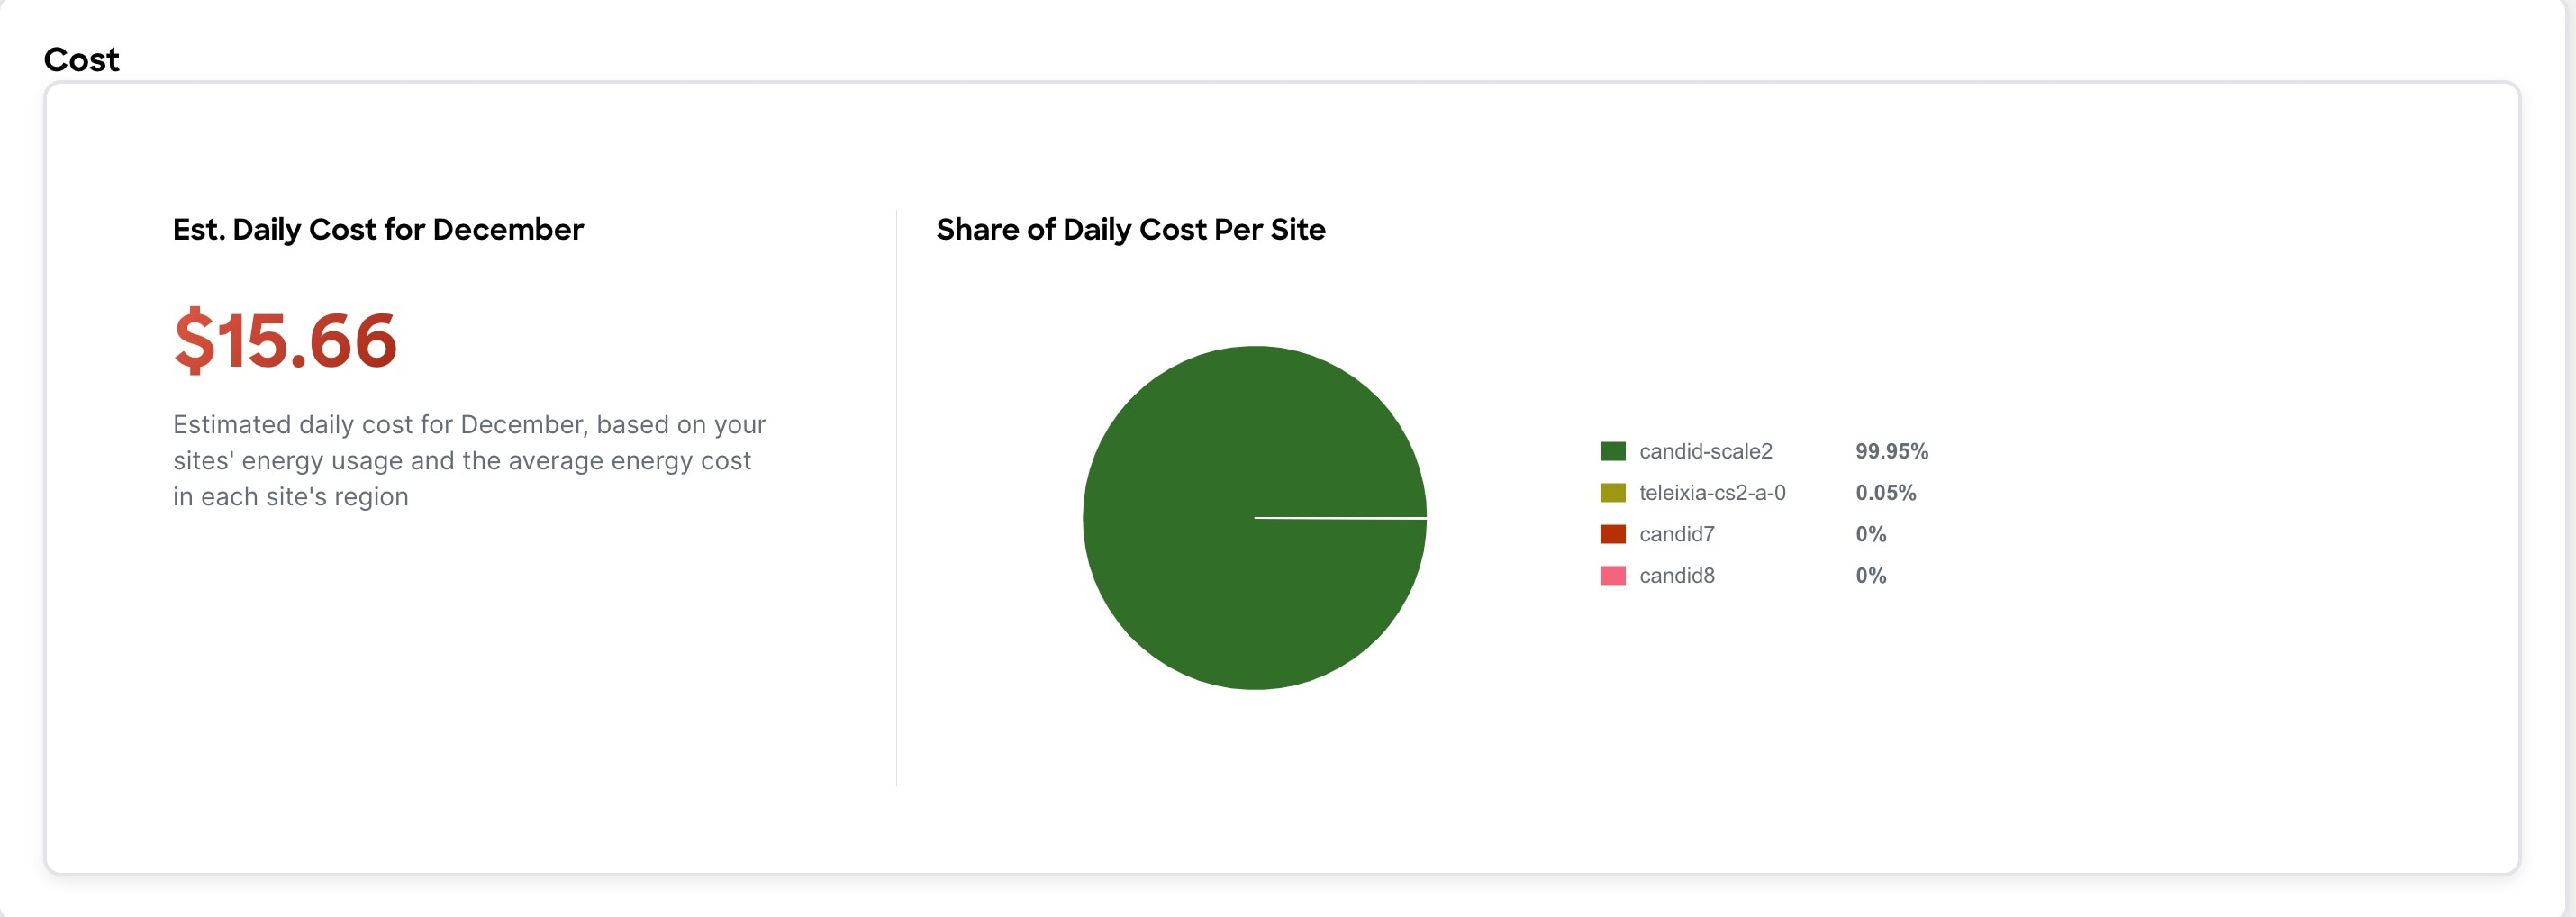
-
(Optional) From the Actions menu, choose Fabric Energy Settings to customize your average cost for the current month for a more accurate estimate. To calculate cost estimates, Nexus Dashboard Insights uses values based on the average cost of grid energy for each region.
-
Examine the Energy area to see the energy usage in the chosen month in kWh.
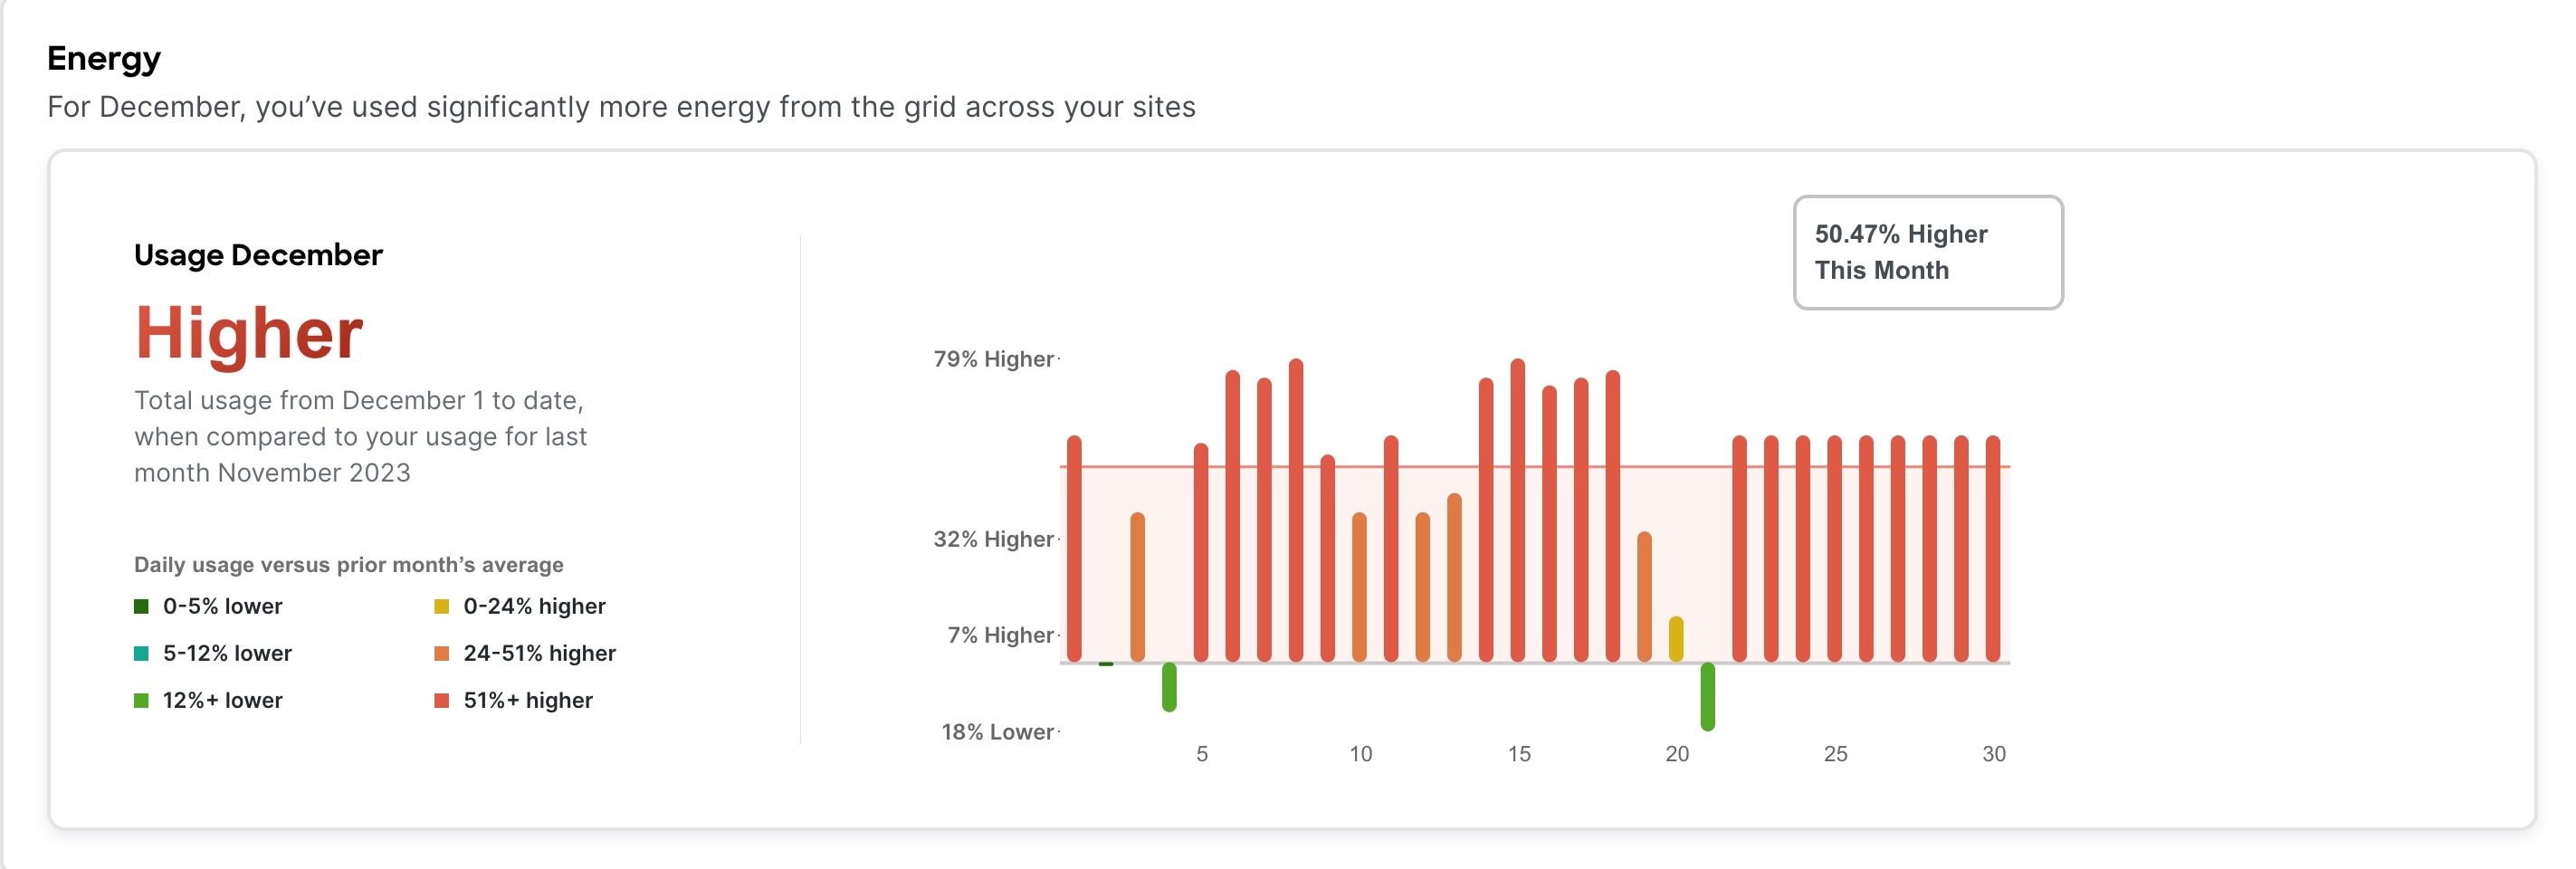
-
Examine the Emissions area to see the total emissions per fabric, estimated monthly carbon dioxide equivalent emissions, average percentage of energy from low-carbon sources and other sources, and percent of total energy used during each three-hour reporting period by source over all of the days in the chosen month.
For total emissions per fabric, use the toggle to view the information in graphical format or tabular format.
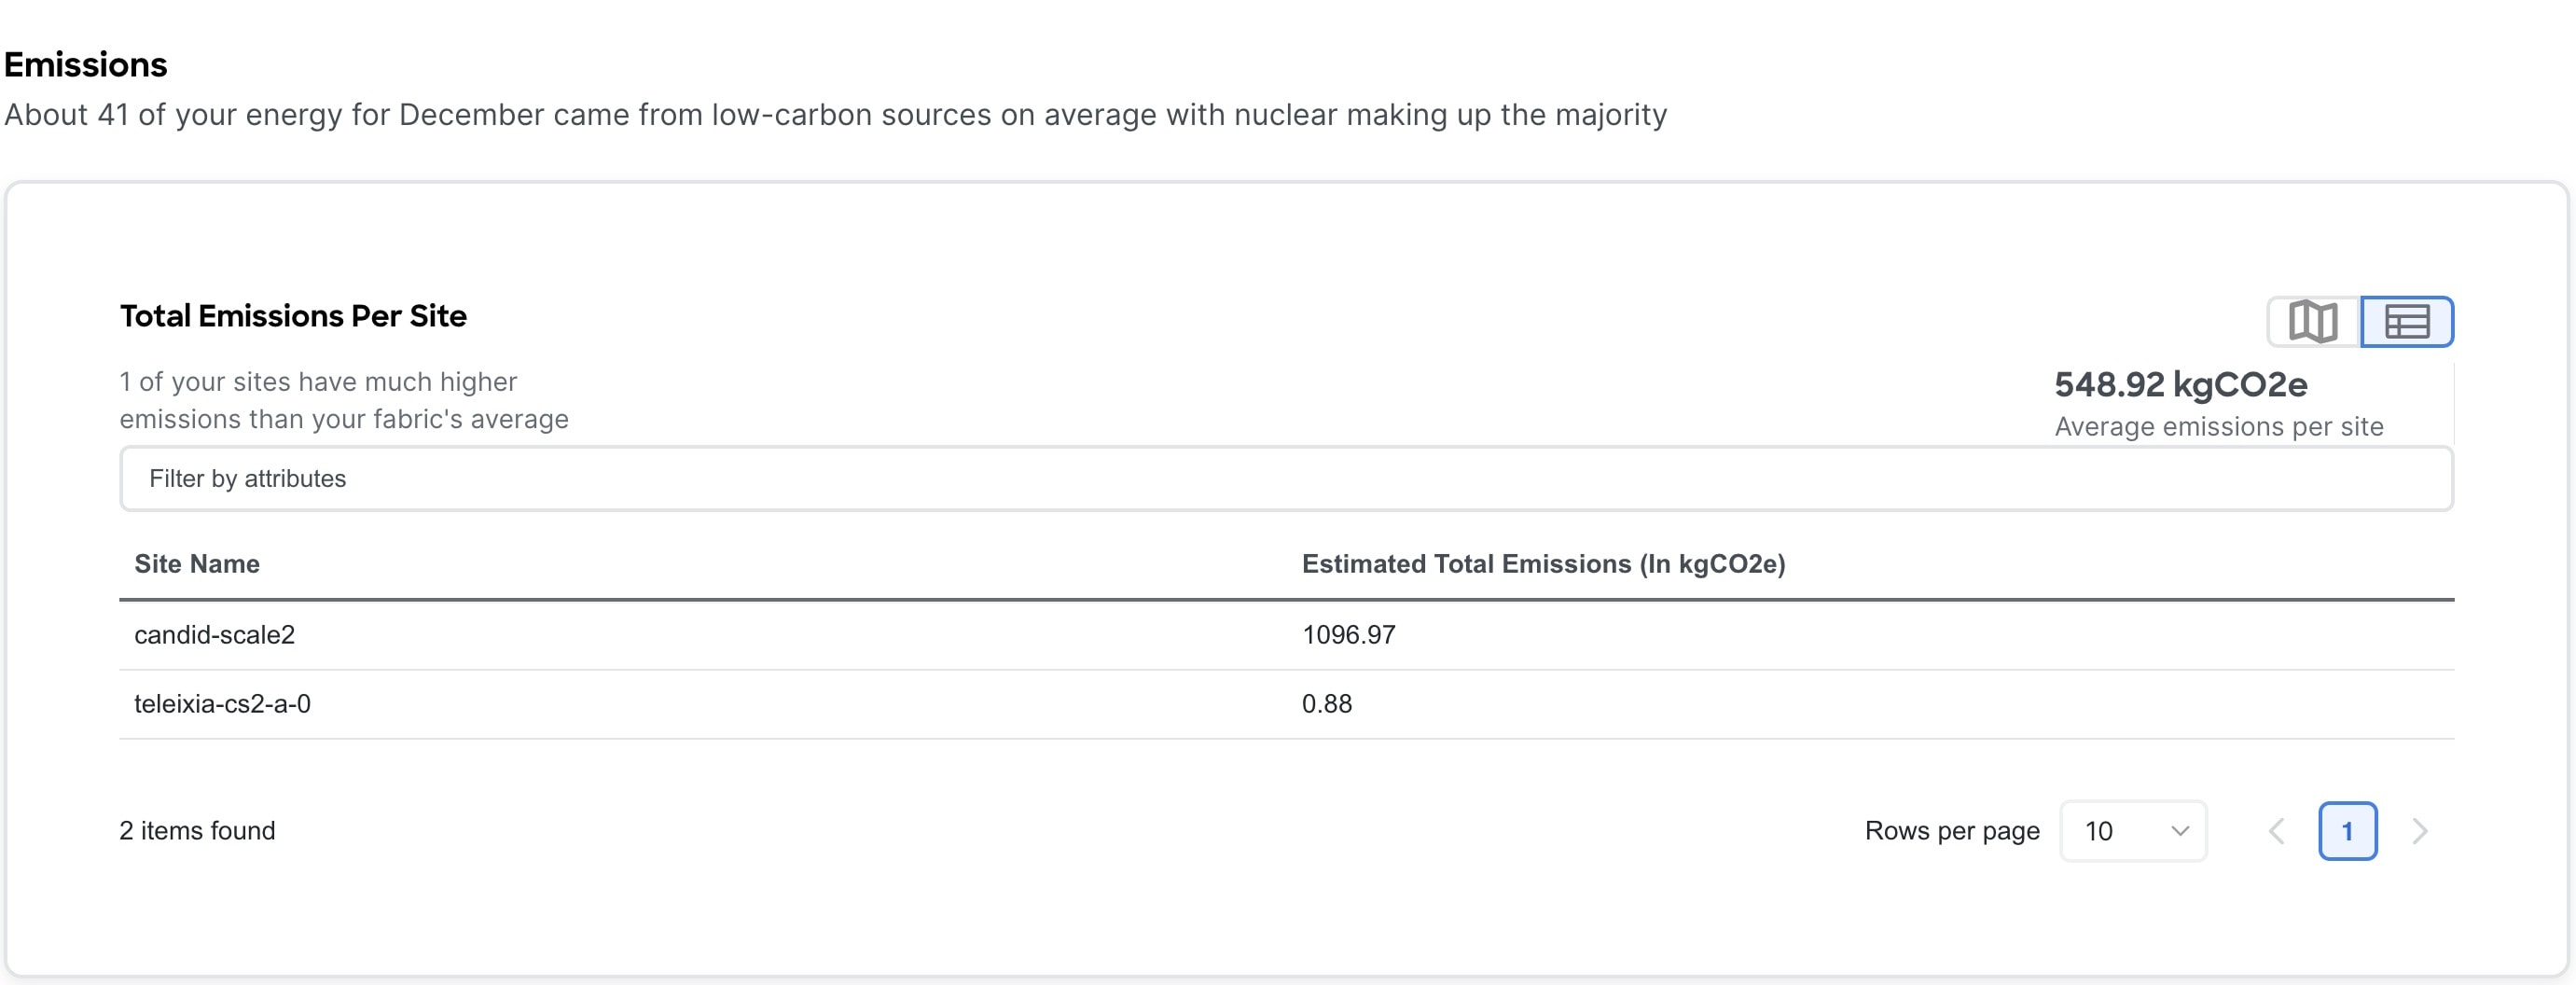
-
Examine the Top 5 Devices area to see the top 5 devices for the highest estimated cost, most energy consumed, and highest estimated greenhouse gas (GHG) emissions.
Click View all devices to see the data for all devices, not just the top 5.
-
Choose a fabric from the fabric drop-down menu to view the hourly energy mix.
Hourly energy mix displays the amount of total energy used during each three-hour reporting period by source, over all of the days in the chosen month. The minimum period before you can generate the next report is 3 hour.
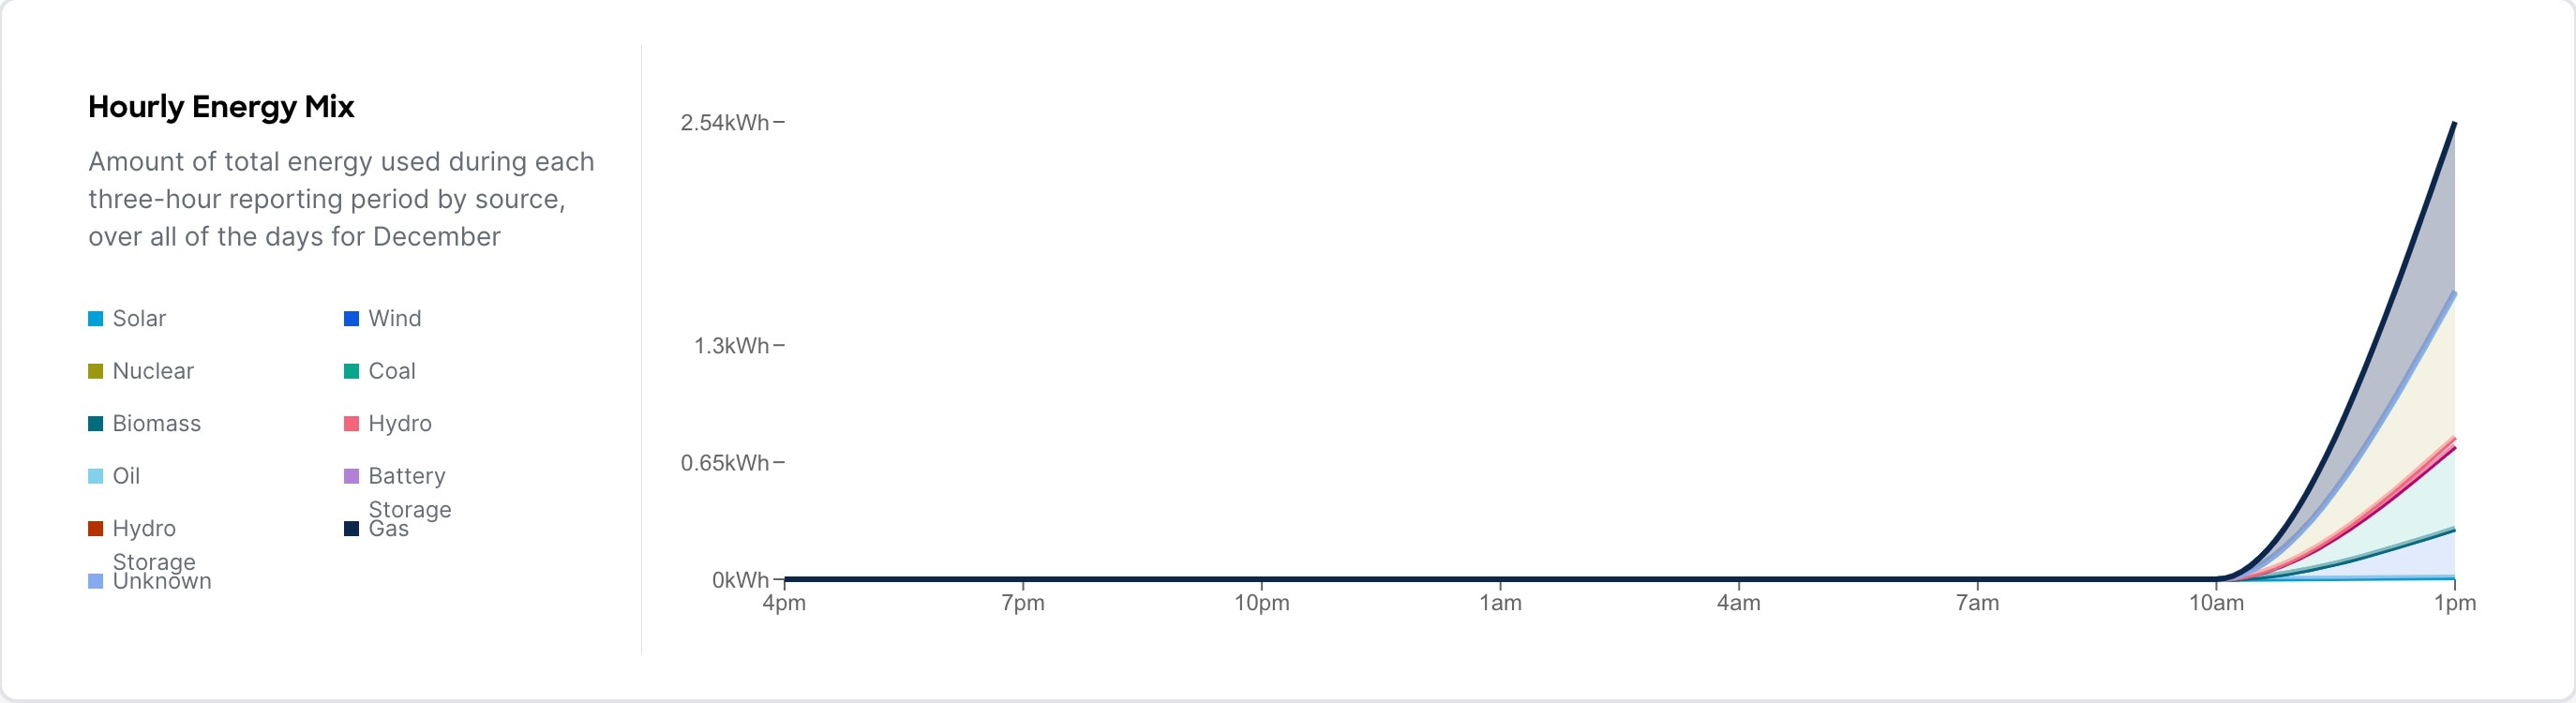
Delta Analysis
Delta Analysis
Nexus Dashboard Insights performs analysis of sites at regular intervals and the data is collected at an interval depending on the number of nodes.
| Number of nodes | Interval |
|---|---|
|
Fewer than 100 |
2 hours |
|
100 to 400 |
3 hours |
|
Greater than 400 |
12 hours |
At each interval, Nexus Dashboard Insights captures a snapshot of the controller policies and the fabric run time state, performs analysis, and generates anomalies. The anomalies generated describe the health of the network at that snapshot.
Delta analysis enables you to analyze the difference in the policy, run time state, and the health of the network between two snapshots.
Create Delta Analysis enables you to create a new delta analysis and manage existing analysis. See Create Delta Analysis.
Health Delta
Health Delta analyses the difference in the health of the fabric across the two snapshots.
See Health Delta for more details.
Policy Delta for ACI
Policy Delta analyzes the differences in the policy between the two snapshots and provides a co-related view of what has changed in the ACI Fabric.
See Policy Delta for more details.
Guidelines and Limitations for Delta Analysis
-
While you are currently allowed to create more than one Delta Analyses at any given time, we recommend that you do not queue more than one Delta Analysis at any given time. In addition, we recommend that you wait for some time (approximately 10 minutes) between creating new analyses to avoid the risk of adversely impacting the run time of the concurrent online fabric analysis.
The interdependency arises because the Delta Analysis results in an increased load on the database. Sustained high-database load from multiple back-to-back Delta Analyses may affect the run-time of the online analysis.
-
The APIC Configuration Export Policy must be of the same format (XML/JSON) for both the snapshots.
-
The policy delta will not be performed if there are any APIC configuration export policy collection errors.
-
The toggle for 'Include Acknowledged Anomalies' which allows you to filter out the acknowledged anomalies from the results displayed does not show anomalies which are manually acknowledged.
Create Delta Analysis
For ACI Assurance Group users, APIC admin writePriv privileges allow information collection on the APIC host and leaf switches. You must have APIC admin writePriv privileges to configure the APIC Configuration Export Policy.
Choose Analyze > Analysis Hub > Delta Analysis > Create Delta Analysis.
-
In the Delta Analysis Name field, enter the name. The name must be unique across all the analyses.
-
Click Fabric to choose the fabric.
-
Click Choose Earlier Snapshot and choose the first snapshot for the delta analysis. Click Apply.
-
Click Choose Later Snapshot and choose the second snapshot for the delta analysis. Click Apply.
The two snapshots chosen for the delta analysis must belong to the same fabric.
-
View the Summary of the Delta Analysis created in Summary.
-
Click Save. The status of the delta analysis is displayed in the Delta Analysis table. Post completion allows you to View Delta Analysis or Create another Delta Analysis.
You can perform one delta analysis at a time. To perform another delta analysis, you must stop the current delta analysis and then start the another delta analysis.
-
(Optional) From the Status column, choose an In Progress or Scheduled analysis and click STOP in the "…" option to stop the delta analysis.
-
The Delete in the "…" allows you to delete the analysis created.
If there are any errors in the creation of a delta rule, it will be displayed on the summary of the rule creation as a banner.
View Delta Analysis
The page displays the analysis in a tabular form. The analysis are sorted by status. The Create Delta Analysis button lets you create a new delta analysis.
The status of analysis can be either Aborted, Pending, Stopped, Stopping, Success, Failed, Partially Failed, Queued, Completed or In progress.
The filter bar allows you to filters the analysis by the following factors:
-
Name
-
Status
-
Fabric
-
Submitter ID
The delta analysis dashboard displays the general details of the analysis along with the health and policy delta.
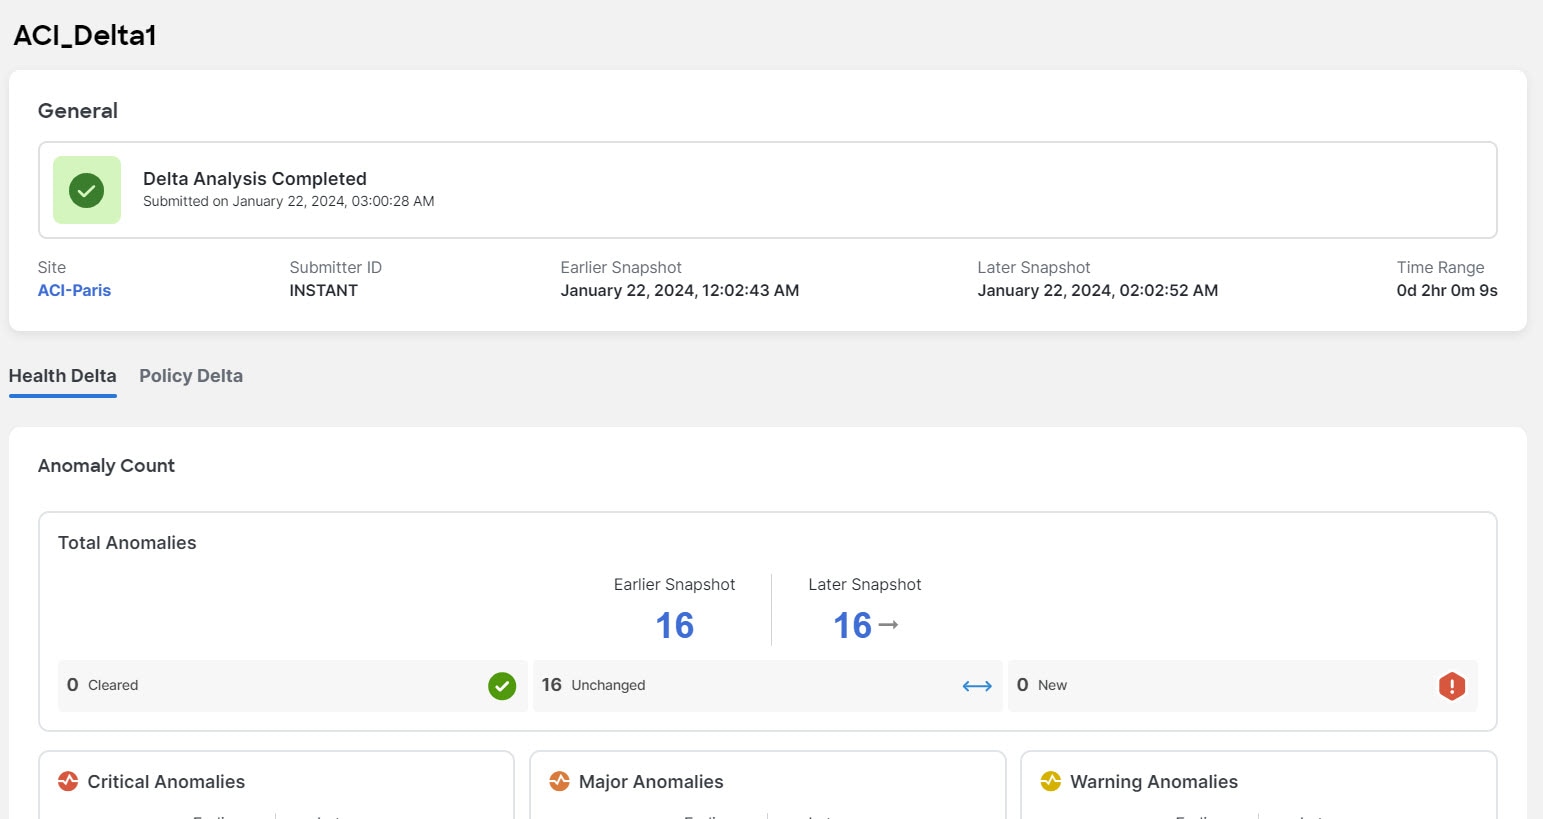
-
To view the results of health delta analysis, see View Health Delta Analysis.
-
To view the results of policy delta analysis, see View Policy Delta Analysis.
View Health Delta Analysis
Health Delta analyses the difference in the health of the fabric across the two snapshots. The results are displayed in the following areas:
The toggle for 'Include Acknowledged Anomalies' allows you to filter out the acknowledged anomalies from the results displayed if enabled. If it is disabled, manually acknowledged anomalies are included in the Anomaly Count.
-
Anomaly Count: Displays the difference in anomaly count per severity across the snapshots. If you click on the difference that shows, the All Anomalies table gets filtered accordingly.
The first count represents the anomalies found only in the earlier snapshot. The second count represents the anomalies common in both the snapshots. The third count represents the anomalies found only in the later snapshot.
-
Health Delta by Resources: Displays the count of resources by type that have seen a change in their health. You can also view the resources whose health has changed by checking the View Changed checkbox. The gear icon allows you to customize the columns as per your view. The filter bar helps to filter the resources in the table by 'Resource'.
The table displays count delta and health delta. Count delta includes both healthy and unhealthy resources. Healthy resources prob won’t have any anomalies associated with it if filtered Health delta shows only unhealthy resources and should return anomalies if filtered by
-
All Anomalies: The Grouped view displays the delta status for grouped anomalies across the snapshots. The Ungrouped view displays the delta status for each anomaly across the snapshots.
The Anomalies can be listed for the following kinds of snapshots:
-
Earlier Snapshot
-
Later Snapshot
-
Earlier Snapshot Only
-
Later Snapshot Only
-
Both Snapshots
The anomalies are displayed in a tabular form with the following fields:
-
Title
-
Anomaly Level
-
Category
-
Count
You can filter the results based on the following attributes:
-
Anomaly Level
-
App Profile DN
-
BD DN
-
Title
-
Contract DN
-
EPGs
-
External Routes
-
Interfaces
-
Internal Subnets
-
L3Out DN
-
Leaf DN
-
Tenant DN
-
Endpoints
-
VRF DN
Choose an anomaly to view the anomaly details.
View Policy Delta Analysis
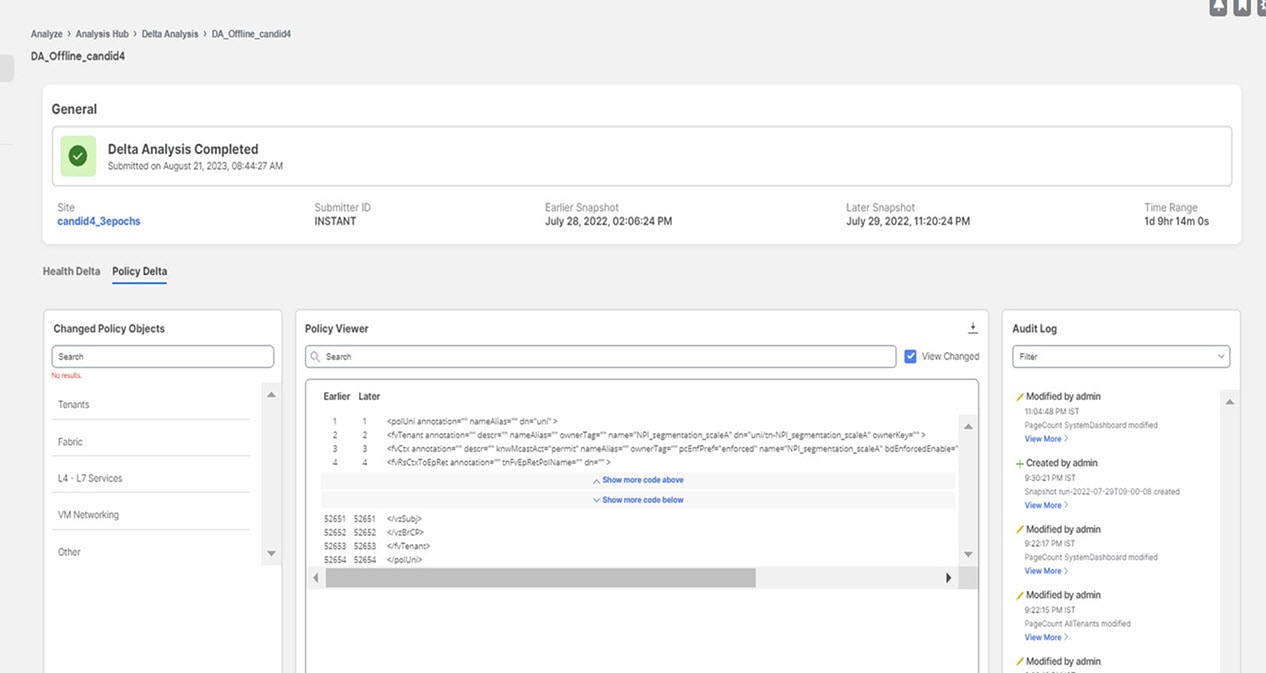
Click Policy Delta to view the policy changes across the two snapshots. Policy Delta includes three sections: Changed Policy Object, Policy Viewer, and Audit Log.
-
The Changed Policy Object panel, displays the changed policy object tree across the two snapshots. The corresponding changes in the Policy Viewer and Audit Log panels are highlighted. Use the Search bar to perform a DN search.
-
Drill down on a particular object to view the object types that have changed. The number indicates the number of changes to the object.
-
Choose the changed object type to view the anomalies that have changed.
-
Click DN link to access the affected object type in APIC.
-
Click Show Changes to view the changes in the Policy Viewer and Audit Log panels.
-
-
The Policy Viewer panel displays the policy configuration across the earlier and later snapshots. It also helps view the added, modified, and deleted policy configurations between the two snapshots and view the context around the modified areas in the policy delta.
-
Use the color coding to visualize the added, deleted, modified, and unchanged content across the two policies.
-
Click Show More Code Above or Show More Code Below to display more content.
-
Click the download icon to export the policy configuration for the earlier snapshots policy and later snapshots policy.
-
Enter a value in the Search bar to perform a text search in added, modified, deleted, and unchanged areas in the policy delta.
-
-
The Audit Log panel then displays all the audit logs that were created between the two snapshots. Cisco Nexus Dashboard Insights collects audit logs from APIC and computes the difference in the audit logs between the two snapshots.
A correlated view of what has change in the data center is displayed in the Audit Log panel. When you choose a particular object in the Changed Policy Objects panel, the relevant difference is highlighted in the Policy Viewer panel and the relevant audit log is highlighted in the Audit Log panel. APIC audit logs are records of user-initiated events such as logins and logouts or configuration changes that are required to be auditable. For every snapshot, the audit log history is limited to last 24 hrs.
-
Use the Filter bar to filter by DN, User ID, or Any.
-
Click View More on an audit log entry to view when the changes were made and who made the changes. The timestamp on the audit log entry corresponds to the the timestamp on the APIC audit log.
-
Click Audit Log entry to access the affected object type in APIC.
Pre-Change
Pre-Change Analysis
Navigate to Analyze > Analysis Hub > Pre-Change.
Pre-Change Analysis allows you to change a configuration for a fabric, to model the intended changes, perform a Pre-Change Analysis against an existing base snapshot in the fabric, and verify if the changes generate the desired results.
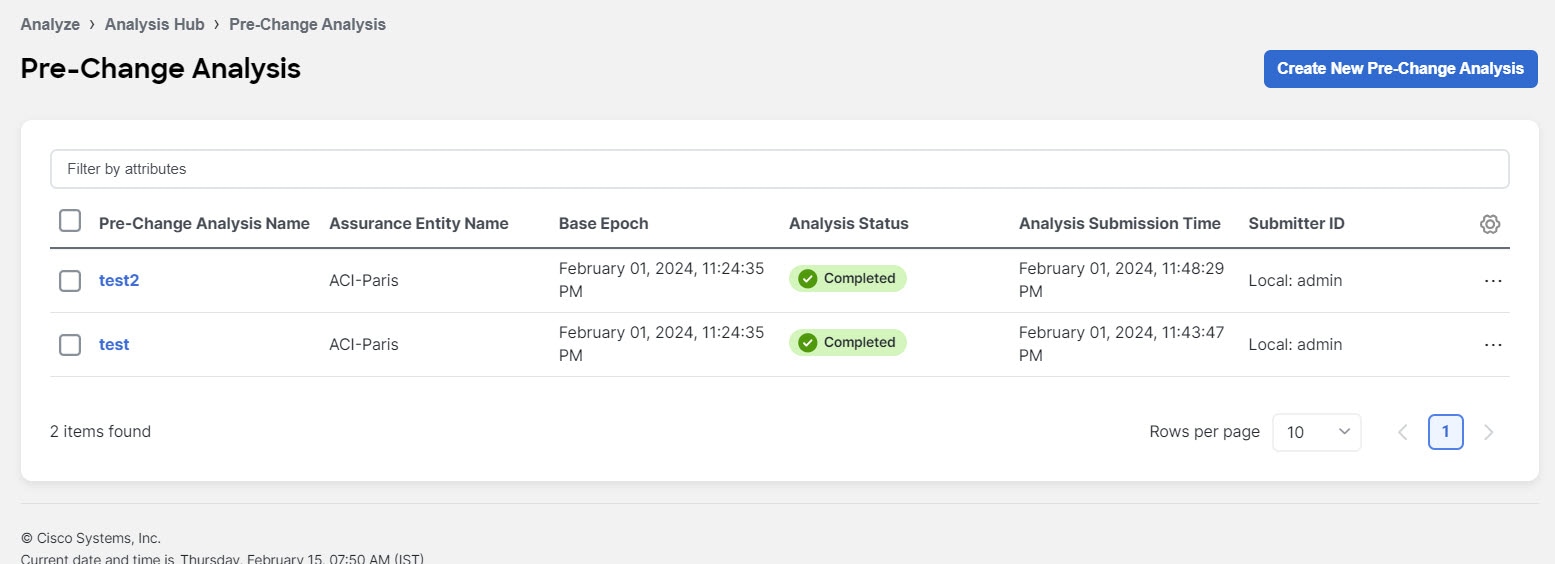
After you model the changes for a Pre-Change Analysis job, you can choose Save or Save And Analyze. By choosing Save, you can save the Pre-change Analysis job without having to start the analysis right away. You can return to the job later, edit the changes if required, and then run the analysis later. The Save option is supported only for a Pre-Change Analysis job with manual changes.
If you choose Save And Analyze, the job gets scheduled and an analysis is provided. The changes are applied to the chosen base snapshot, the analysis is performed, and results are generated. For every pre-change analysis job listed in the table, a delta analysis is performed between the base snapshot and the newly generated snapshot.
In Pre-Change Analysis, to see the details of a completed Pre-Change Analysis job, click that job in the table. This opens a new page that displays the following information:
-
Dashboard
-
Delta Analysis
-
Compliance Analysis
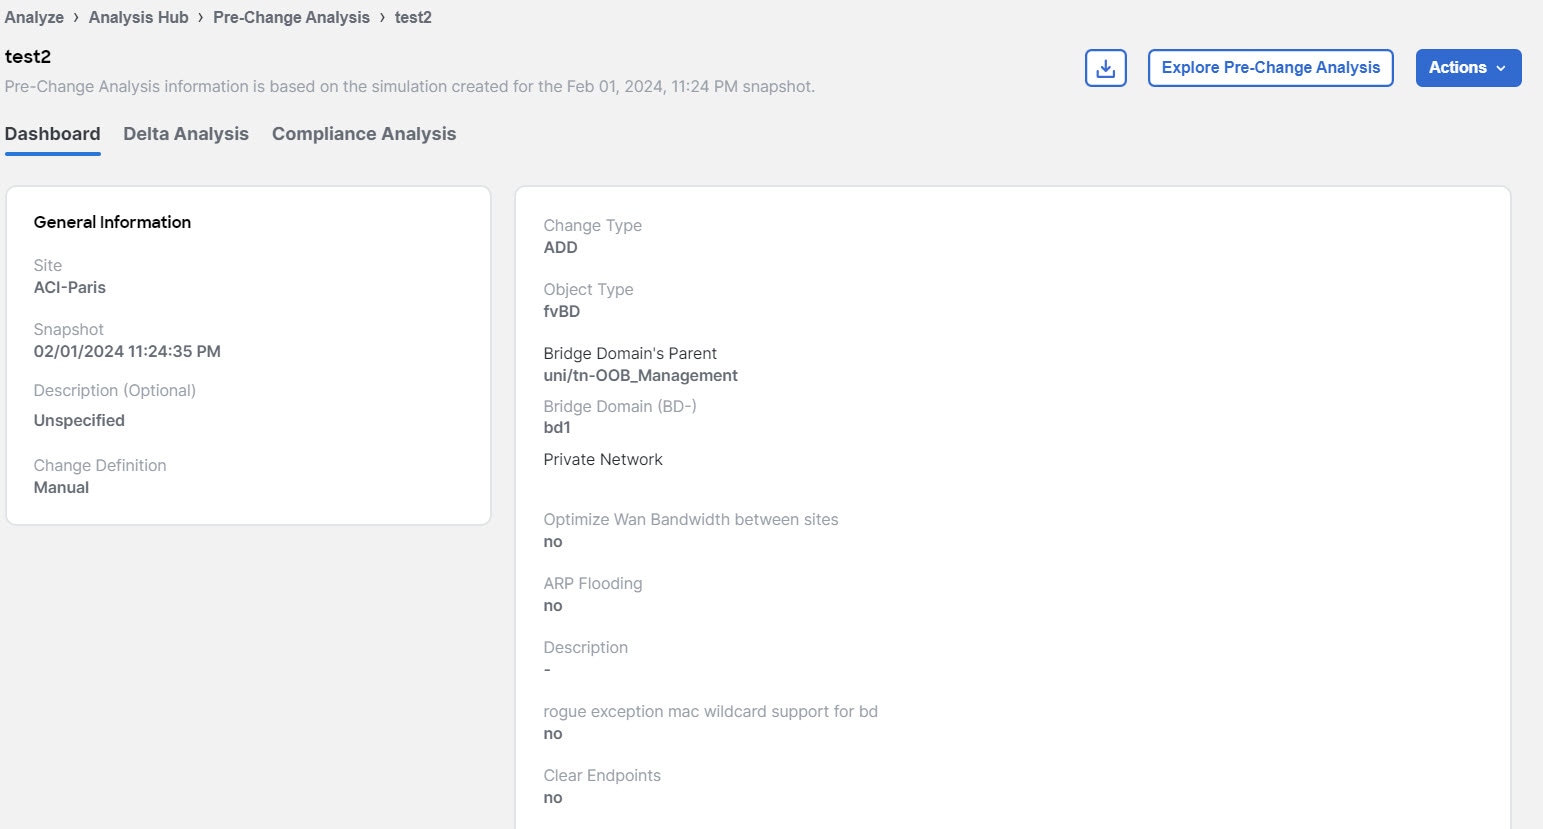
General Information shows the following data:
-
Fabric name
-
Snapshot details
-
Description
-
Change Definition
In case of Manual Changes, you see list of changes that were modeled for that job(Change type, Object type, name alias, Priority, Description, App profile) and in case of JSON/ XML file upload you see the Change Simulation.
As the job is complete, the severity area displays the anomalies that are generated for these changes. To understand the data displayed under Delta Analysis, view Delta Analysis.
To understand the data displayed under Compliance Analysis, view Compliance.
The … button allows you to perform the following actions:
-
Edit Pre Change Analysis
-
Clone Pre Change Analysis
-
Delete Pre Change Analysis
If anomalies are raised in the analysis, make the required modifications based on the results and re-run the analysis until you obtain satisfactory results. The download option in a Pre-Change Analysis job allows you to download a JSON file that can be uploaded to Cisco APIC. However, if you choose the file upload approach, you can upload a JSON or an XML Cisco APIC configuration file to run a Pre-Change Analysis job.
Once the analysis starts, the status of the job will be shown as Running. During this time, the specified changes will be modeled on top of the base snapshot, and complete logical checks will be run, including Policy Analysis and Compliance. No switch software or TCAM checks will be performed. The status of the Pre-Change Analysis job is marked Completed when the entire analysis including Delta Analysis completes. The Delta Analysis is automatically triggered and the associated Pre-Change Analysis job is displayed as running during that time. The Delta Analysis is performed only on checks supported in Pre-Change Analysis job.
You can view changes applied by a user to a specific Pre-Change Analysis job by clicking the job in the table. If the changes are applied manually, you can view the different changes chosen by the user. If the job is created using a JSON file, the Change Definition field displays the name of the JSON file from where the changes were imported.
Pre Change Analysis lists all the analyses performed in a tabular form with the following fields:
-
Analysis Name
-
Assurance Entity Name
-
Base Epoch
-
Analysis Status
-
Submitter ID
Pre-Change Analysis Options
The following list specifies the options you can choose on your pre-change analysis job. Only the objects listed are supported.
-
Add, modify, or remove Tenant.
-
Add, modify, remove App EPG (supported attributes: preferred group member, intra EPG isolation; relations for App EPG: BD, provided, consumed and taboo contracts; export/import of contracts is not supported.)
-
Add, modify, or remove a VRF (supported attributes: policy control enforcement preference, policy control enforcement direction, BD enforcement status, preferred group member, description).
-
Add, modify, or remove a BD (supported attributes: description, optimize WAN bandwidth, type, ARP flooding, IP learning, limit IP learning to subnet, L2 unknown unicast, unicast routing, multi-destination flooding, multicast allow, and L3 unknown multicast flooding).
-
Add, modify, or remove a contract (supported attributes: scope, description).
-
Add, modify, or remove a contract subject (supported attributes: reverse filter ports, description, priority, target DSCP, filter name, forward filter name, and reverse filter name).
-
Add, modify, or remove subnets (supported attributes: scope, preferred, description, primary IP address, virtual IP address, and subnet control).
-
Add, modify, or remove an App profile (priority, description).
-
Add, modify, or remove an L3Out (supported attributes: description, VRF name, Target DSCP, and route control enforcement).
-
Add, modify, or remove an L2Out (supported attributes: description, BD name, encapsulation type, and encapsulation ID).
-
Add, modify, or remove an L3 Ext EPG (supported attributes: preferred group member, description, priority; supported relations: VRF, provided contracts, consumed contracts, taboo, and target DSCP).
-
Add, modify, or remove an L2 Ext EPG (supported attributes: preferred group member, description, priority, target DSCP and provided contracts, supported contracts, and taboo contracts).
-
Add, modify, or remove L3 Ext EPG Subnets (supported attributes: description, and scope).
-
Add, modify, or remove a Taboo Contract (supported attributes: description).
-
Add, modify, or remove a Taboo Subject (supported attributes: name, description; supported relations: vzRsDenyRule).
-
Add, modify, or remove a Filter and Filter entries.
For Fabric Access Policies, you can choose to add the following to your pre-change analysis job:
-
Add, modify, or remove relationship between EPG and a physical domain.
-
Add, modify, or remove relationship between physical domain and a corresponding VLAN pool.
-
Add, modify, or remove relationship between physical domain and Attachable Entity Profile.
-
Add, modify, or remove a leaf interface profile.
-
Add, modify, or remove a port selector.
-
Add, modify, or remove a switch profile.
-
Add, modify, or remove a switch selector.
-
Add, modify, or remove an interface policy group.
-
Add, modify, or remove an interface policy for CDP and LLDP.
Guidelines and Limitations for Pre-Change
When using Pre-Change Analysis follow these guidelines and limitations:
-
Pre-change Analysis can be conducted for fabrics and uploaded files.
-
More than one Pre-change Analysis can be run on the same base snapshot.
-
Pre-Change Analysis cannot be run for a pre-change snapshot being used as a base snapshot.
-
Only logical configuration anomalies are modeled and run in a Pre-Change Analysis. Switch software and TCAM changes are not modeled. After the analysis completes, a Delta Analysis will automatically start to compare the snapshot, generated due to the Pre-Change Analysis, with the base snapshot. Delta Analysis is performed only on checks supported in the Pre-Change Analysis job.
-
During a pre-change analysis, certain anomalies that exist in the base snapshot will not be analyzed in the pre-change analysis. As a result, these anomalies will not appear in the Pre- Change Analysis snapshot even though the violation continues to exist. The reason that such an event is not analyzed in a pre-change analysis is because these anomalies require not just logical data, but they also require switch software and TCAM data.
-
Compliance Analysis displays the results of compliance checks in the Pre-Change Analysis snapshot.
-
A local search of anomalies from a Pre-Change Analysis snapshot can be performed and viewed in the results section by navigating to specific tabs for Dashboard, Delta Analysis, Compliance Analysis, and Explore.
-
Pre-Change Analysis does not support or analyze any service chain related changes or objects.
-
Delta Analysis does not allow a Pre-Change Analysis snapshot to be chosen.
-
If configuration data does not exist for a base snapshot, and you run a pre-change analysis job using this snapshot, new logical configuration files will not be generated. For such pre-change analysis jobs, the Download icon will be grayed out/disabled in the side panel. You will not be able to download a new logical configuration.
-
The Pre-Change Analysis could go into a Failed state if an imported configuration has unsupported objects. Figure out the Cisco ACI objects that are unsupported by referring to the Pre-Change Analysis Options section, remove them, and import the configuration again before starting another Pre-Change Analysis job. If there is a failed Pre- Change Analysis, the error message for the failure is displayed in the Pre-Change Analysis table under Analysis Status.
-
The Pre-change Analysis feature is supported in Cisco APIC release 3.2 or later. If you attempt to run a Pre-change Analysis with a Cisco APIC release earlier than release 3.2, an ERROR message indicates that Pre-Change verification is supported on APIC 3.2 or higher, and you cannot run the analysis.
-
If there is an analysis that is currently running when you start a Pre-Change Analysis, that job is completed first. The new jobs are serviced in the order the jobs are scheduled. Cisco Nexus Dashboard Insights runs the jobs in the order that best suites the schedule and the available resources. All jobs, including the Pre-Change Analysis job are given the same priority.
-
You can upload a JSON or an XML Cisco APIC configuration file to run a Pre-Change Analysis job.
-
The maximum file size is 10 MB for vND and 50 MB for pND.
-
An uploaded file will be pruned by removing white spaces and endpoint objects (fvCEp) to reduce the file size.
-
-
You can save as many Pre-Change Analysis jobs as you want. However, for a fabric, you can only run a Pre-Change Analysis job one at a time.
-
If you modify an object that belongs to a tenant, the pre-change analysis file size for that tenant cannot be more than 10 MB.
Support for Multiple Objects in Pre-Change Analysis
In addition to multiple tenants, you can also add multiple infrastructure objects as part of a Pre-Change Analysis JSON or XML job. The Pre-Change Analysis upload path allows you to add, modify, and delete multiple objects across the policy universe. There are no additional configurations required to use this feature. Your Pre-Change Analysis job for multiple objects will run, based upon the files you upload.
The following file upload formats are accepted:
-
A JSON or XML file with IMDATA of size 1.
-
An IMDATA that contains a single subtree of the intended changes. The root of the subtree can be the UNI or any other Managed Object as long as the changes are represented as a single subtree.
-
Use the file that you had uploaded from a JSON or XML path to perform a Pre-change Analysis. After the Pre-Change Analysis is complete, you can upload the same file to ACI to be used to make the changes.
Known Issues for Pre-Change Analysis
-
When Pre-Change Analysis scale limits are exceeded, the analysis can fail with no error message.
-
For Pre-Change Analysis jobs, you must not modify configurations where the total number of EPGs, BDs, VRFs are greater than 16,000.
-
When creating a new Pre-Change Analysis, note the following:
-
If the JSON/XML file size being uploaded is less than 100 MB but greater than 15 MB, then the API validates the file and throws a validation error as follows: Uploaded file size exceeds the 15MB(pND)/8MB(vND) maximum limit. When users access Cisco Nexus Dashboard Insights, and try to create a Pre-Change Analysis job with a file size greater than 15MB(pND)/8MB(vND), the UI throws the following error: File size cannot be larger than 15MB(pND)/8MB(vND). Therefore, files larger than 15MB(pND)/8MB(vND) are not supported in Pre-Change Analysis.
-
If you upload a file with unsupported objects, Cisco Nexus Dashboard Insights will remove the unsupported object and run the job.
-
-
A Pre-change Analysis job may fail or return incorrect results if the Cisco ACI configuration has features that are unsupported by Cisco Nexus Dashboard Insights.
-
Pre-change Analysis is not supported in Cisco ACI configurations that contain service chains.
-
Cisco Nexus Dashboard Insights performs a limited set of checks on the JSON file uploaded for pre-change analysis. Cisco ACI may reject this file.
-
Pre-change Analysis may incorrectly report errors for attributes of subnets of external routed networks.
-
Pre-change Analysis is supported in the following Cisco APIC releases:
-
For 3.2(x) release, 3.2(9h) and earlier are supported
-
For 4.0(x) release, 4.0(1h) and earlier are supported
-
For 4.1(x) release, 4.1(2x) and earlier are supported
-
For 4.2(x) release, 4.2(7s) and earlier are supported
-
For 5.0(x) release, 5.0(2e) and earlier are supported
-
For 5.1(x) release, 5.1(4c) and earlier are supported
-
For 5.2(x) release, 5.2(4d) and earlier are supported
-
For 5.3(x) release, 5.3(1b) and earlier are supported
-
For 6.0(x) release, 6.0(4c) and earlier are supported
-
Create Pre-Change Analysis Job
-
Navigate to Analyze > Analysis Hub > Pre-Change.
-
In Pre-Change, click Create Pre-Change Analysis. In Create Pre-Change Analysis, perform the following actions:
General
-
In the Pre-Change Analysis Name field, enter a name.
-
In the Description field, add a description for the analysis if you would like to.
-
In the Fabric field, choose the appropriate fabric.
-
In the Snapshot field, specify the appropriate snapshot.
Change
-
Under Change, choose the appropriate option. (Import JSON/XML File or Manual Changes).
Depending upon your selection, the relevant fields are displayed for you to populate.
Complete the selections as appropriate, and click Save or Save & Run.
After a Pre-Change Analysis job is completed, the Pre-Change Analysis table displays the status for the job as completed.
Click the Pre-Change Analysis Name for which you want to view the details. In a sidebar to the right, the details are displayed in a column including the general information such as the name of the job, snapshot, and change definition type. The list of changes modeled for the job are also available. If you are viewing a completed job, the anomalies that were generated as a result of the changes are displayed at the top of this page.
For completed jobs, click the icon on the top right of the sidebar to navigate to the results page. Further details about the job are available here under the specific tabs for Dashboard, Delta Analysis, Compliance Analysis.
Download Pre-Change Analysis Job
You can download an existing Pre-Change Analysis as follows:
-
In the Pre-Change Analysis table, click the appropriate pre-change analysis name for a completed Pre-Change Analysis job. Click the download icon to download the file.
-
The pre-change analysis downloads as an offline tar file with the pre-change analysis contents displayed in JSON format.
In the downloaded file, you can view all the attributes which include attributes that are modified and those that are not modified. If desired, the downloaded file can be uploaded to your Cisco APIC.
Bug Scan
Bug Scan
Nexus Dashboard Insights collects technical support information from all the devices and runs them against known set of signatures, and flags the corresponding defects and PSIRTs. Nexus Dashboard Insights also generates advisories for PSIRTs and anomalies for defects. See Anomalies and Advisories to learn more about Metadata support.
The Bug Scan feature collects technical support logs from devices in a fabric and scans them for bugs that could have been hit. If the CPU and memory usage is below the set threshold of 65% then the tech support logs are collected and the Bug Scan is carried out for the devices. If the CPU and memory usage is above the set threshold, the devices are excluded from the Bug Scan and eventually will be reconsidered for the next default Bug Scan or when you run an on-demand Bug Scan for that device.
If the node interaction is not healthy on the device, you cannot choose the device for Bug Scan to collect logs. The device cannot be chosen to configure a job.
You can also run an on-demand Bug Scan for a fabric. For more information, see the On-Demand Analysis section in Getting Started.
Default Bug Scan
Bug Scan is run for all the fabrics onboarded to Nexus Dashboard Insights and is auto-scheduled every 7 days for each device. This schedule is fixed and is not customizable.
Bug Scan is run on devices contained in a fabric either based on the last Bug Scan or the onboarding time if a Bug Scan has not been run before. Priority is given to devices with a longer time elapsed since the last Bug Scan. After a Bug Scan is run on a device, regardless of whether it succeeds or fails, another Bug Scan will not be run for the same device for the next 7 days.
Bug Scan is auto-scheduled to run on devices only if the CPU and memory metrics for the devices are streamed and the percentage usage is less than 65%.
However, on-demand Bug Scan is an exception and is prioritized over any auto-scheduled runs and does not consider the CPU and memory metrics as it is user-initiated. If auto-scheduled Bug Scan is in progress and on-demand Bug Scan is initiated, based on the available resources in the Nexus Dashboard nodes the on-demand Bug Scan will start while the current Bug Scan is in progress or after the current Bug Scan is completed.
Only one Bug Scan at the time can run on a specific device. However, if you have one set of devices where Bug Scan is already in progress, a second (auto-scheduled or on-demand) Bug Scan can run only if Nexus Dashboard Insights has enough resources available. Otherwise it will be put on hold and started as soon as resources are available.
A Bug Scan is triggered automatically in the following scenarios:
-
Node upgrade or downgrade
-
Node reloads
View Active and Susceptible Bugs
The Bug Scan feature collects technical support logs from devices in a fabric and scans them for bugs that could have been hit. You can view the active and susceptible bugs affecting your network after the Bug Scan is completed.
-
Navigate to Analyze > Analysis Hub > Bug Scan.
-
Choose an online fabric or multiple online fabrics from the drop-down menu.
-
Choose the software version from the drop-down menu. The active and susceptible bugs for the chosen fabrics and software versions are displayed.
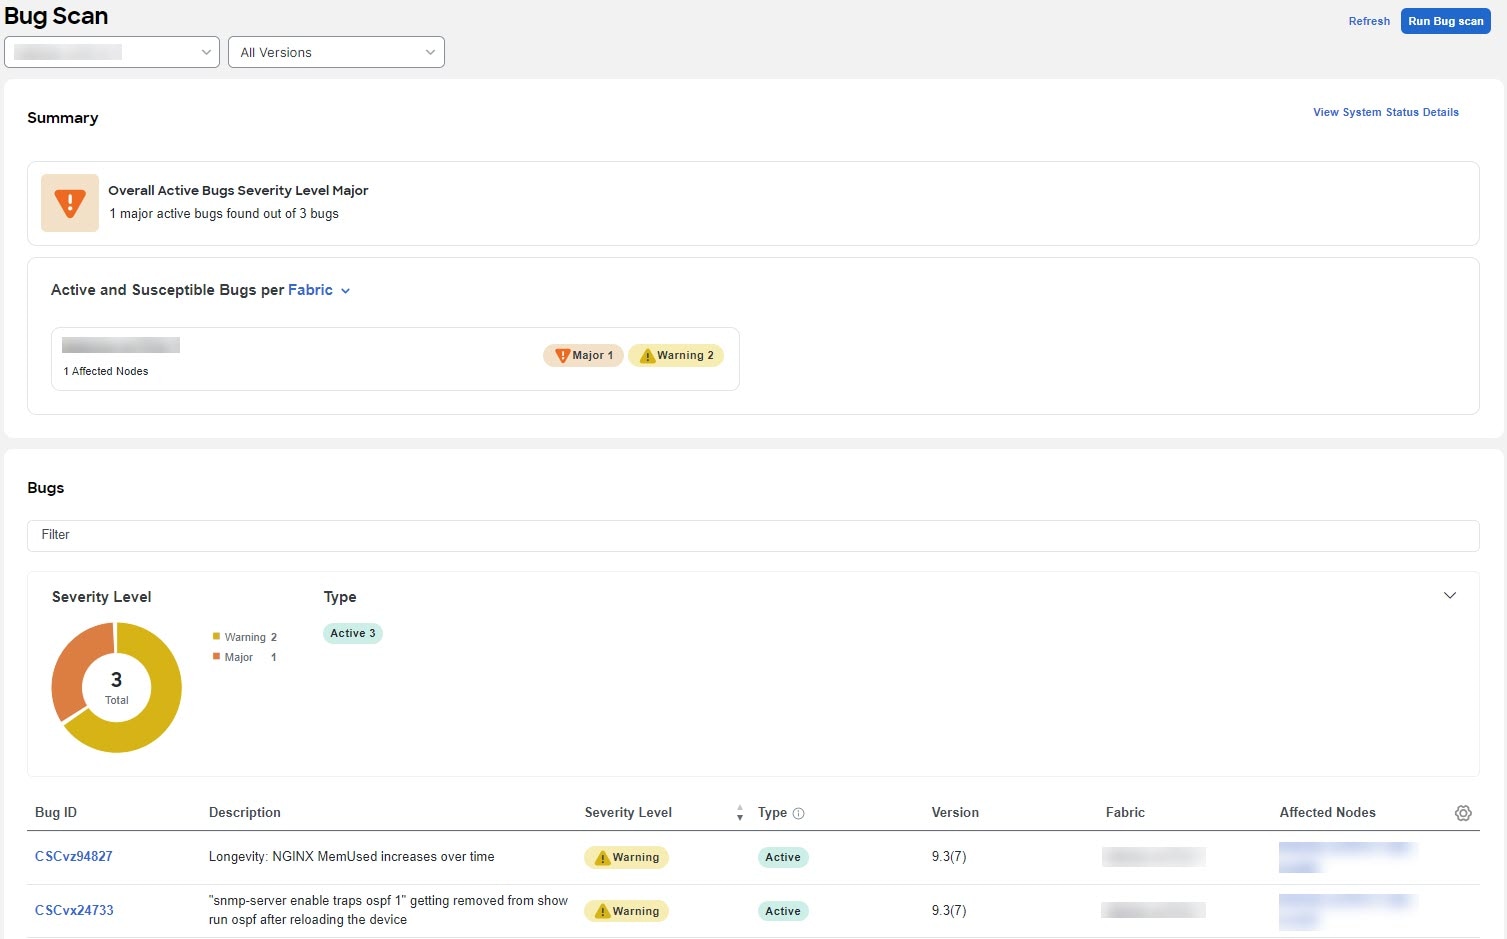
-
The Summary area displays the overall active bugs by severity. You can also view the Bugs per fabric or software version using the drop-down menu.
-
In the Bugs area, use the filter bar to filter the bugs by bug ID, description, severity level, type, and affected nodes.
-
View the Severity Level donut chart to see the total number of bugs of Critical, Major, and Warning severity.
-
View the bugs table to see the filtered bugs.
-
Click the column heading to sort the bugs in the table.
-
Click the gear icon to configure the columns in the table.
-
Click Bug ID to view bug details.
-
-
Click Run Bug Scan to run an on-demand Bug Scan. Choose a fabric and click Run Now. For more information, see the On-Demand Analysis section in Getting Started.
View Active and Susceptible Bugs for an Individual Fabric
In Nexus Dashboard Insights, you can also view the bugs for an individual fabric in the following ways:
-
Navigate to Mange > Fabrics
-
Choose Online Fabrics from the drop-down menu.
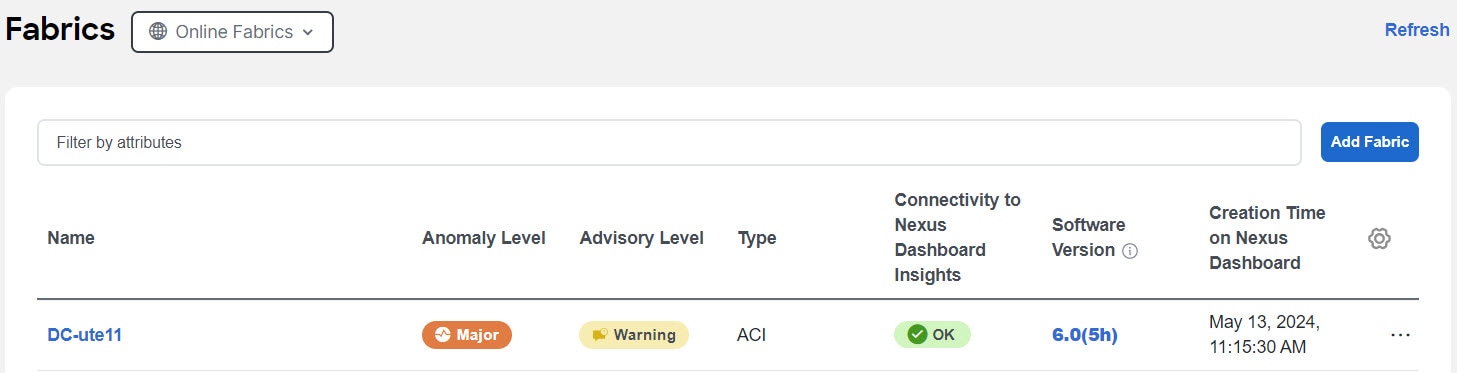
-
In the Software Version column, hover on the software version and click View Bugs to view the active and susceptible bugs for that fabric.
-
From the Actions drop-down menu click Run Bug Scan to run an on-demand Bug Scan. For more information, see the On-Demand Analysis section in Getting Started.
OR
-
Navigate to Manage > Fabrics.
-
Choose Online Fabrics from the drop-down menu.
-
Choose a fabric.
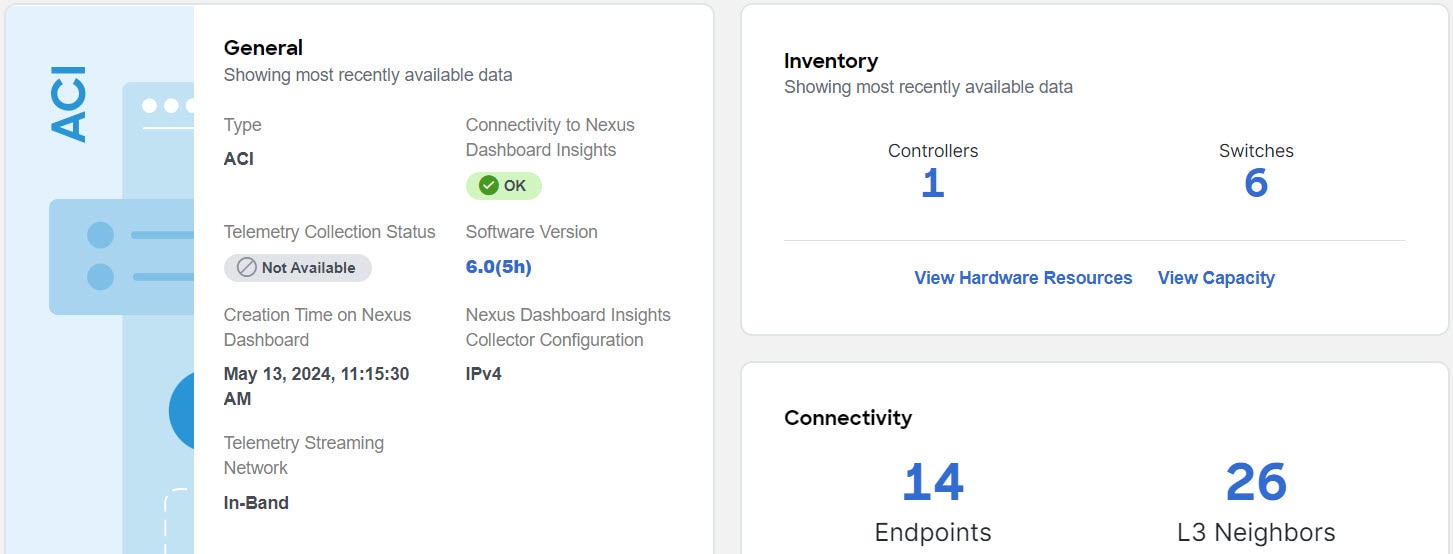
-
In the General area hover on the software version and click View All Bugs to view the active and susceptible bugs for that fabric.
-
From the Actions drop-down menu click Run Bug Scan to run an on-demand Bug Scan. For more information, see the On-Demand Analysis section in Getting Started.
OR
-
Navigate to Manage > Inventory
-
Choose Online Fabrics from the drop-down menu.
-
In the Controllers table hover on the software version in the Software Version column and click View Bugs to view the active and susceptible bugs.
-
Click Switches. In the Switches table hover on the software version in the Software Version column and click View Bugs to view the active and susceptible bugs.
-
From the Actions drop-down menu click Run Bug Scan to run an on-demand Bug Scan.For more information, see the On-Demand Analysis section in Getting Started.
OR
-
Navigate to Manage > Fabric Software Management.
-
In the Software Management Jobs table click an analysis.
-
In the Firmware Summary area, hover on the Node Target Firmware and click View Bugs to view the active and susceptible bugs for that particular software version on that fabric.
-
From the Actions drop-down menu click Run Bug Scan to run an on-demand Bug Scan. For more information, see the On-Demand Analysis section in Getting Started.
Copyright
THE SPECIFICATIONS AND INFORMATION REGARDING THE PRODUCTS IN THIS MANUAL ARE SUBJECT TO CHANGE WITHOUT NOTICE. ALL STATEMENTS, INFORMATION, AND RECOMMENDATIONS IN THIS MANUAL ARE BELIEVED TO BE ACCURATE BUT ARE PRESENTED WITHOUT WARRANTY OF ANY KIND, EXPRESS OR IMPLIED. USERS MUST TAKE FULL RESPONSIBILITY FOR THEIR APPLICATION OF ANY PRODUCTS.
THE SOFTWARE LICENSE AND LIMITED WARRANTY FOR THE ACCOMPANYING PRODUCT ARE SET FORTH IN THE INFORMATION PACKET THAT SHIPPED WITH THE PRODUCT AND ARE INCORPORATED HEREIN BY THIS REFERENCE. IF YOU ARE UNABLE TO LOCATE THE SOFTWARE LICENSE OR LIMITED WARRANTY, CONTACT YOUR CISCO REPRESENTATIVE FOR A COPY.
The Cisco implementation of TCP header compression is an adaptation of a program developed by the University of California, Berkeley (UCB) as part of UCB’s public domain version of the UNIX operating system. All rights reserved. Copyright © 1981, Regents of the University of California.
NOTWITHSTANDING ANY OTHER WARRANTY HEREIN, ALL DOCUMENT FILES AND SOFTWARE OF THESE SUPPLIERS ARE PROVIDED “AS IS" WITH ALL FAULTS. CISCO AND THE ABOVE-NAMED SUPPLIERS DISCLAIM ALL WARRANTIES, EXPRESSED OR IMPLIED, INCLUDING, WITHOUT LIMITATION, THOSE OF MERCHANTABILITY, FITNESS FOR A PARTICULAR PURPOSE AND NONINFRINGEMENT OR ARISING FROM A COURSE OF DEALING, USAGE, OR TRADE PRACTICE.
IN NO EVENT SHALL CISCO OR ITS SUPPLIERS BE LIABLE FOR ANY INDIRECT, SPECIAL, CONSEQUENTIAL, OR INCIDENTAL DAMAGES, INCLUDING, WITHOUT LIMITATION, LOST PROFITS OR LOSS OR DAMAGE TO DATA ARISING OUT OF THE USE OR INABILITY TO USE THIS MANUAL, EVEN IF CISCO OR ITS SUPPLIERS HAVE BEEN ADVISED OF THE POSSIBILITY OF SUCH DAMAGES.
Any Internet Protocol (IP) addresses and phone numbers used in this document are not intended to be actual addresses and phone numbers. Any examples, command display output, network topology diagrams, and other figures included in the document are shown for illustrative purposes only. Any use of actual IP addresses or phone numbers in illustrative content is unintentional and coincidental.
The documentation set for this product strives to use bias-free language. For the purposes of this documentation set, bias-free is defined as language that does not imply discrimination based on age, disability, gender, racial identity, ethnic identity, sexual orientation, socioeconomic status, and intersectionality. Exceptions may be present in the documentation due to language that is hardcoded in the user interfaces of the product software, language used based on RFP documentation, or language that is used by a referenced third-party product.
Cisco and the Cisco logo are trademarks or registered trademarks of Cisco and/or its affiliates in the U.S. and other countries. To view a list of Cisco trademarks, go to this URL: http://www.cisco.com/go/trademarks. Third-party trademarks mentioned are the property of their respective owners. The use of the word partner does not imply a partnership relationship between Cisco and any other company. (1110R)
© 2017-2024 Cisco Systems, Inc. All rights reserved.