
New and Changed Information
The following table provides an overview of the significant changes up to this current release. The table does not provide an exhaustive list of all changes or of the new features up to this release.
| Release Version | Feature | Description |
|---|---|---|
|
NDFC release 12.2.1 |
Support AAA remote authentication passthrough |
With this feature enabled, when you log on to NDFC, NDFC copies the default user login credentials to the LAN switch settings in Admin > Switch Credentials > LAN Credentials Management > Default Credentials. When you log on to NDFC for the first time, you are no longer prompted to enter the LAN switch credentials, as NDFC automatically copies the user login credentials to the LAN switch credentials. You can still set per device login credentials to handle devices not using authentication, authorization, and accounting (AAA). Configure AAA remote authentication passthrough by navigating to Admin > System Settings > LAN-Fabric and checking the checkbox for the Enable AAA Passthrough feature. For more information, see Server Settings. |
Overview
The following topics give overview information on the Nexus Dashboard Fabric Controller.
Know your Web UI
When you launch the Cisco Nexus Dashboard Fabric Controller Web UI for the first time, the Feature Management page opens. After you choose a deployment type, the left pane displays menus relevant to the personality.
The top pane displays the following UI elements:
-
Home icon - Click to view One view on the Nexus Dashboard setup.
-
Nexus Dashboard - Click to view One view on the Nexus Dashboard setup.
-
Help - Click on Help to see a drop-down list with the following options:
-
About Nexus Dashboard - Displays the version of the Cisco Nexus Dashboard on which Cisco Nexus Dashboard Fabric Controller is deployed.
-
Welcome Screen - Displays What’s New information. You can choose to see this page every time you launch the Web UI.
-
Help Center - Click to view the Help Center page. You can access various product documents from this page.
Scroll to the end of the page to view the services installed on Nexus Dashboard. Click on the Service to view Help Center.
-
-
User Role - Displays the role of the user who is currently logged in, for example, admin. Click on the username to see a drop-down list with the following options:
-
User Preferences - Allows you to view the Welcome screen on every login.
-
Change Password - Allows you to change the password for the current logged-in user.
If you are a network administrator user, you can modify the passwords of other users.
-
Logout - Allows you to terminate the Web UI and return to the login screen.
-
-
Cisco Persona - Specifies the deployment persona - Fabric Controller or SAN Controller or Fabric discovery.
-
View Alarms - Click the bell icon to view the Alarms. You can also view this page from Analyze > Event Analytics > Alarms from the left pane.
-
Help icon - Click to view help pages or information about Cisco NDFC.
-
Select Help to view the context-sensitive help for the UI page.
-
Select About NDFC to view the version number and copyright information.
-
General icons on UI:
-
Hamburger icon - Click on a Hamburger icon adjacent to the product name on the home screen to minimize the menu items on the home screen or to view menu items in details.
-
Refresh icon - Click the refresh icon to refresh and reload the page.
Dashboard
The intent of the Dashboard is to enable network and storage administrators to focus on particular areas of concern around the health and performance of data center switching. This information is provided as 24-hour snapshots.
The functional view of LAN switching consists of seven dynamic dashlets that display information in the context of the selected scope by default.
The various scopes that are available on the Cisco Nexus Dashboard Fabric Controller Web UI are described in the following topics.
Overview
From the left menu bar, choose Dashboard > Overview. The Overview window displays the default dashlets. The dashlets display donuts summary.
The following are the default dashlets that appear in the Overview dashboard window:
|
Dashlet |
Description |
|
Fabric Health |
Displays the fabric health summary of problems, and number in the donut depicting total number of fabrics. Displays fabric health status with Critical, and Healthy. The Fabric Health status is based on the severity of the highest outstanding alarm for the fabric or its member switches. |
|
Events Analytics |
Displays events with Critical, Error, and Warning severity. |
|
Switches Configuration |
Displays the switches inventory summary information such as the switch models and the corresponding count. |
|
Switches |
|
|
Switch Health |
Displays the switches health summary Critical, and Healthy with the corresponding count. The Switch Health status is based on the severity of the highest outstanding alarm for the switch or its interfaces. |
|
Switch Roles |
Displays the switches roles summary and the corresponding count. Displays the number of access, spine and leaf devices. |
|
Switch Hardware Version |
Displays the switches models and the corresponding count. |
|
Switch Software Version |
Displays the switches software version and the corresponding count. |
|
Performance Collector |
Displays the performance collections on the switch. |
|
Reports |
Displays switch reports. |
Viewing vCenter VMs
vCenter VMs UI Path: Dashboard > vCenter VMs

You can view the Virtual Machine details for the added vCenter cluster in the dashboard and topology window by navigating to Dashboard > vCenter VMs.
The vCenter VMs tab displays the following details of VMs:
-
VM Name, its IP address and MAC address
-
Name of the compute where the VM is hosted
-
Switch name that is connected to a VM, switch’s IP address, MAC address, and interface
-
Port channel ID and vPC ID (if connected to a VPC)
-
VLAN VM configured on
-
Power state of the VM
-
Physical NIC of the Compute host
You can search and filter VMs by using the Filter by attributes search field. 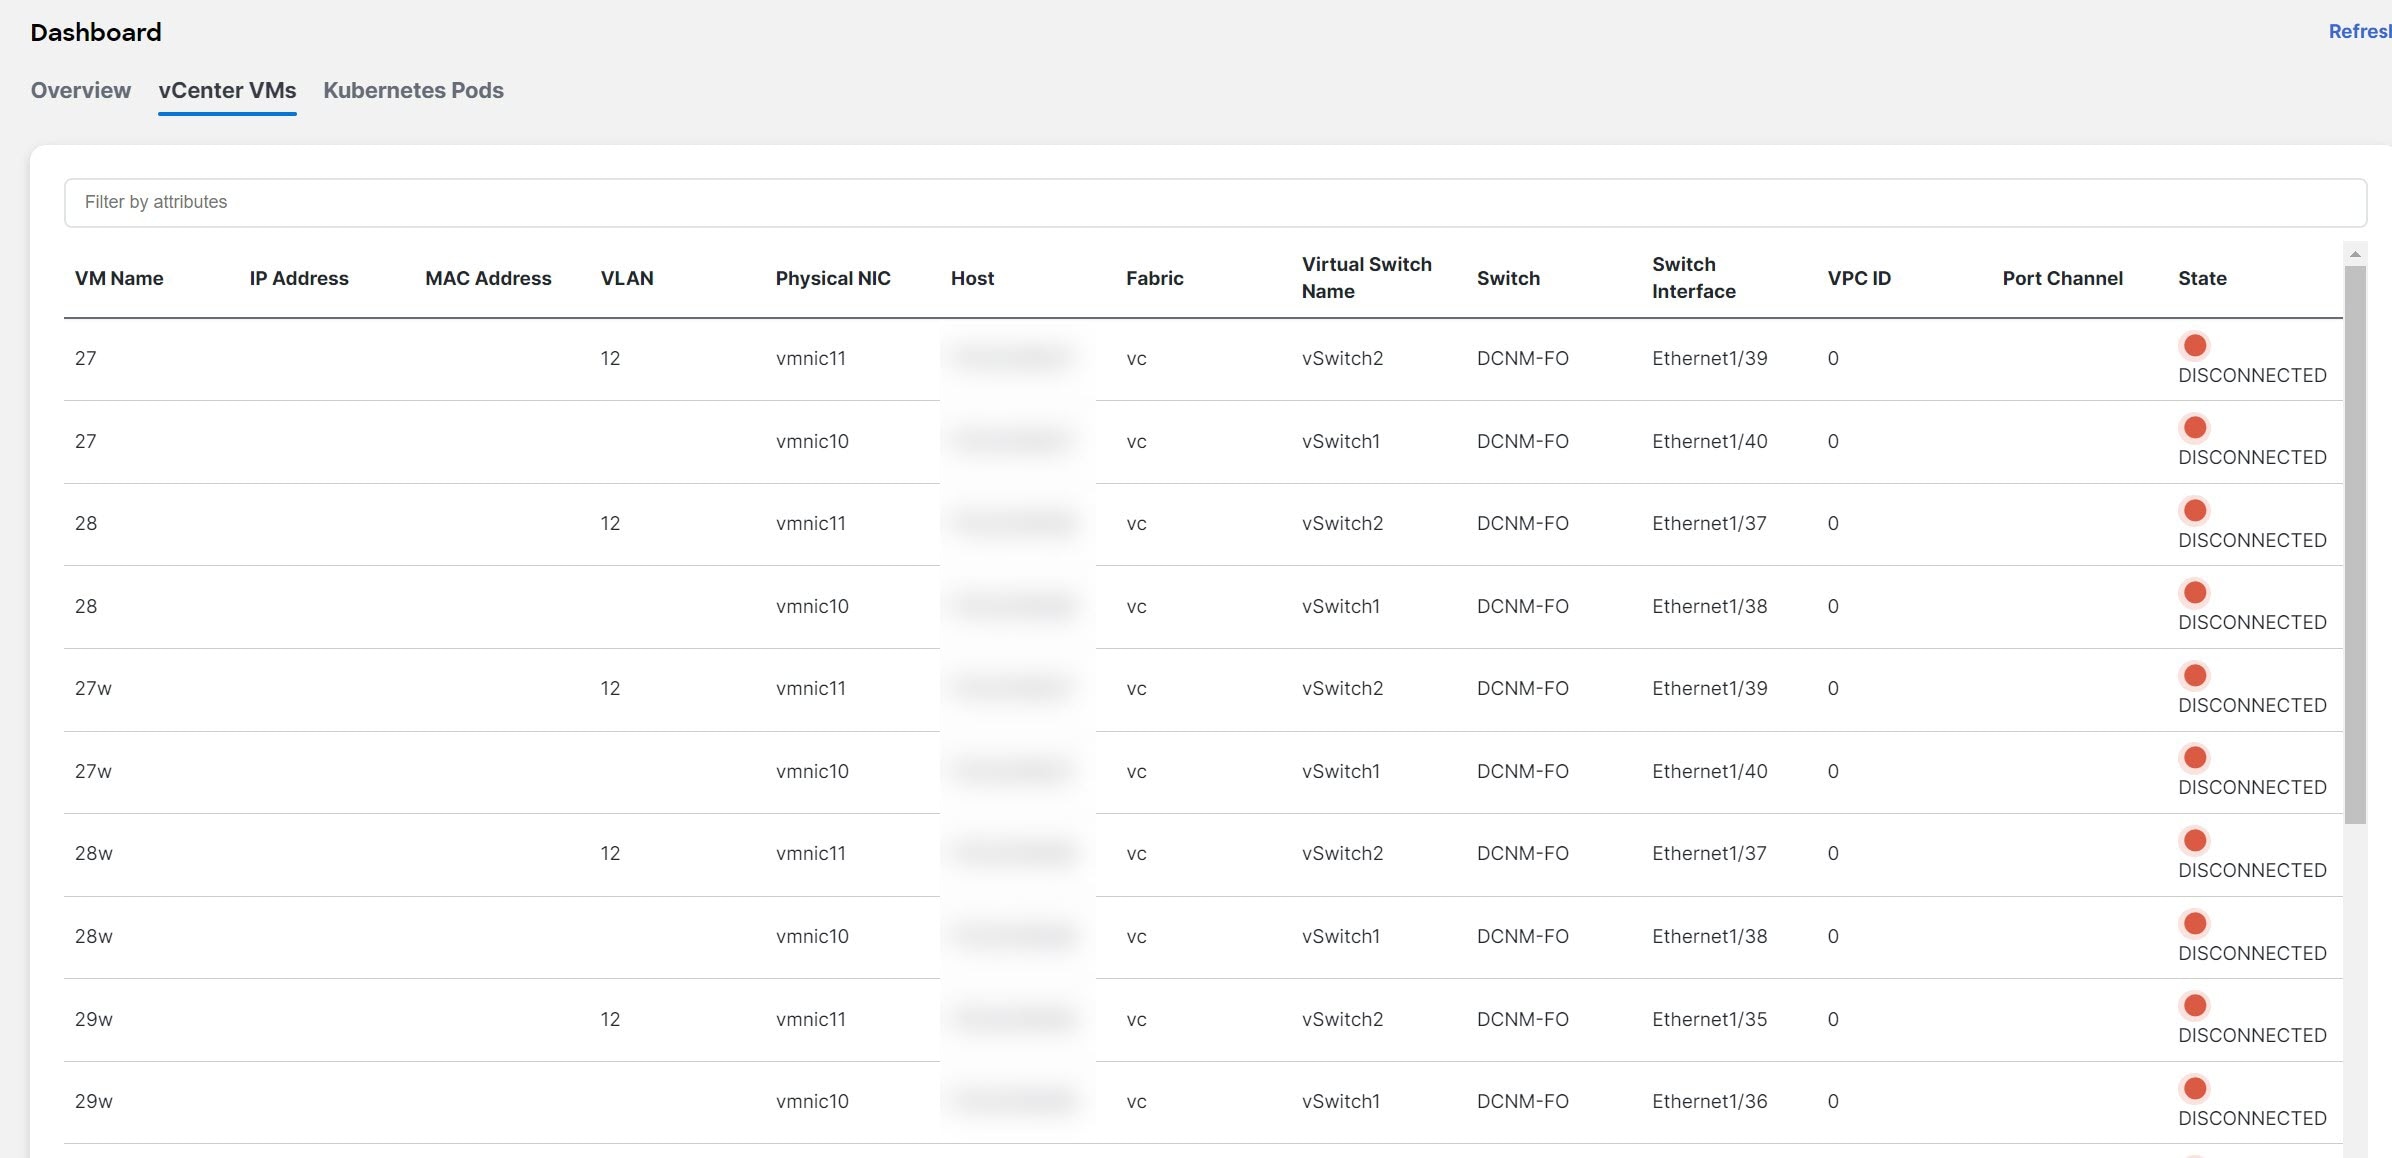
-
To view VMs in the Fabric window, navigate to LAN > Fabrics, then double-click on the required fabric. In the Fabric Overview window, choose Virtual Infrastructure > Virtual Machine VMs.
-
To view VMs in the Switch window, navigate to LAN > Switches, then double-click on the required switch. In the Switch Overview window, choose Virtual Infrastructure > Virtual Machine VMs.
Viewing Kubernetes Pods
Kubernetes Pods UI Path: Dashboard > Kubernetes Pods
You can view Kubernetes pods on Fabrics window, navigate LAN > Fabrics, double-click on required fabric, it navigates to Fabric Overview window, click Virtual Infrastructure > Kubernetes Pods.
You can view Kubernetes pods on Switch window, navigate LAN > Switches, double-click on required switch, it navigates to Switch Overview window, click Virtual Infrastructure > Kubernetes Pods.
You can search and filter kubernetes pods by using filter by attributes search field.
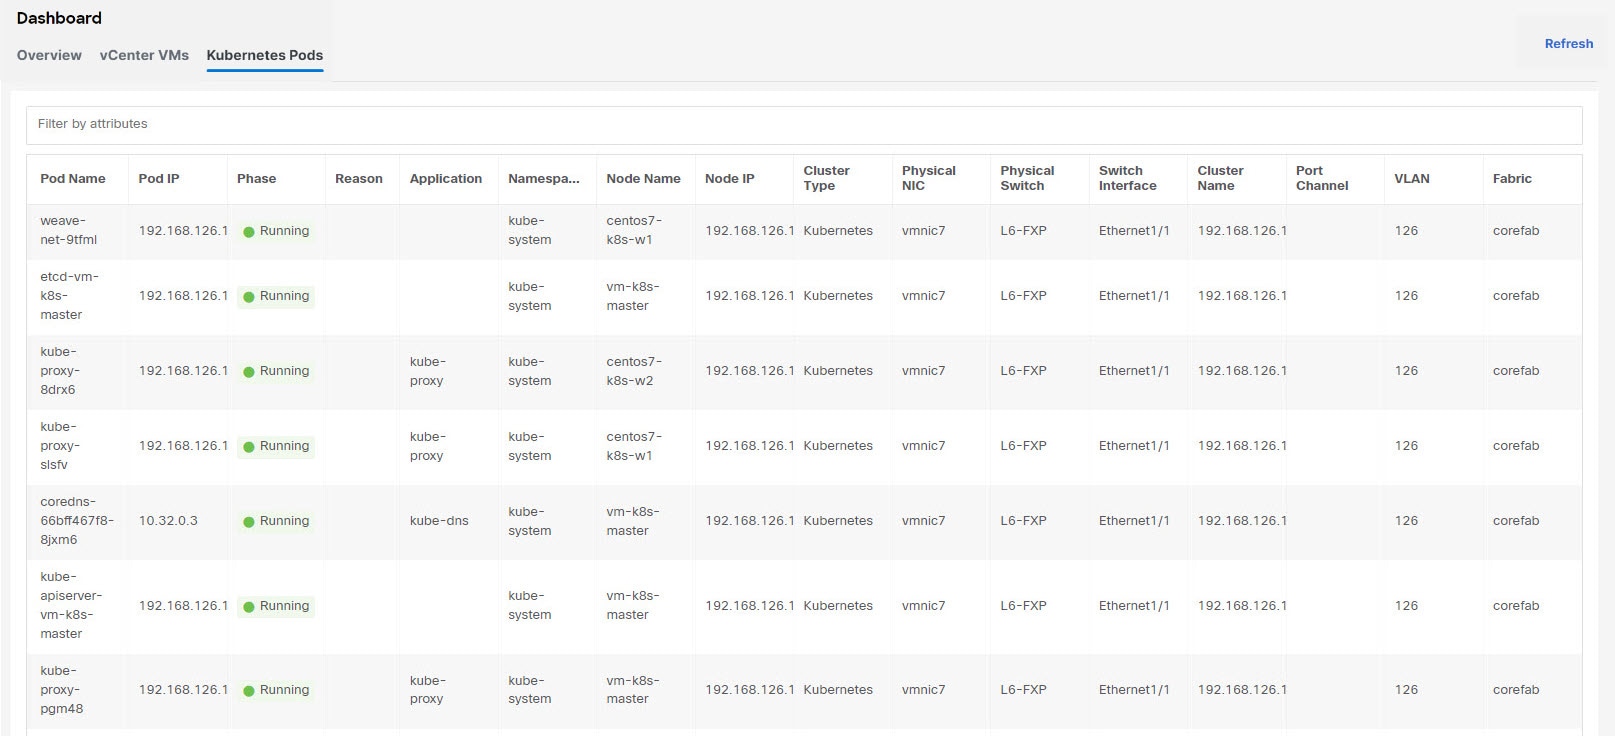
The following table describes the fields and description on the window.
| Field | Description |
|---|---|
|
Pod Name |
Specifies the name of the Kubernetes pod. |
|
Pod IP |
Displays the IP address of the Kubernetes pod. |
|
Phase |
Specifies the phase (state) of the pod. |
|
Reason |
Specifies the reason. |
|
Applications |
Specifies the applications of the pod. |
|
Namespace |
Specifies the namespace of the pod. |
|
Node Name |
Specifies the node name of the pod. |
|
Node IP |
Specifies the node IP address. |
|
Cluster Type |
Displays the type of cluster. |
|
Physical NIC |
Displays the physical NIC of the node. |
|
Physical Switch |
Specifies the physical switch connected to cluster node. |
|
Switch Interface |
Specifies the switch interface connected to cluster node. |
|
Cluster Name |
Specifies the name of the cluster. |
|
Port Channel |
Specifies the port channel (if cluster node is connected to a VPC). |
|
VLAN |
Specifies the VLAN. |
|
Fabric |
Specifies the fabric name. |
Endpoint Locator Dashboard
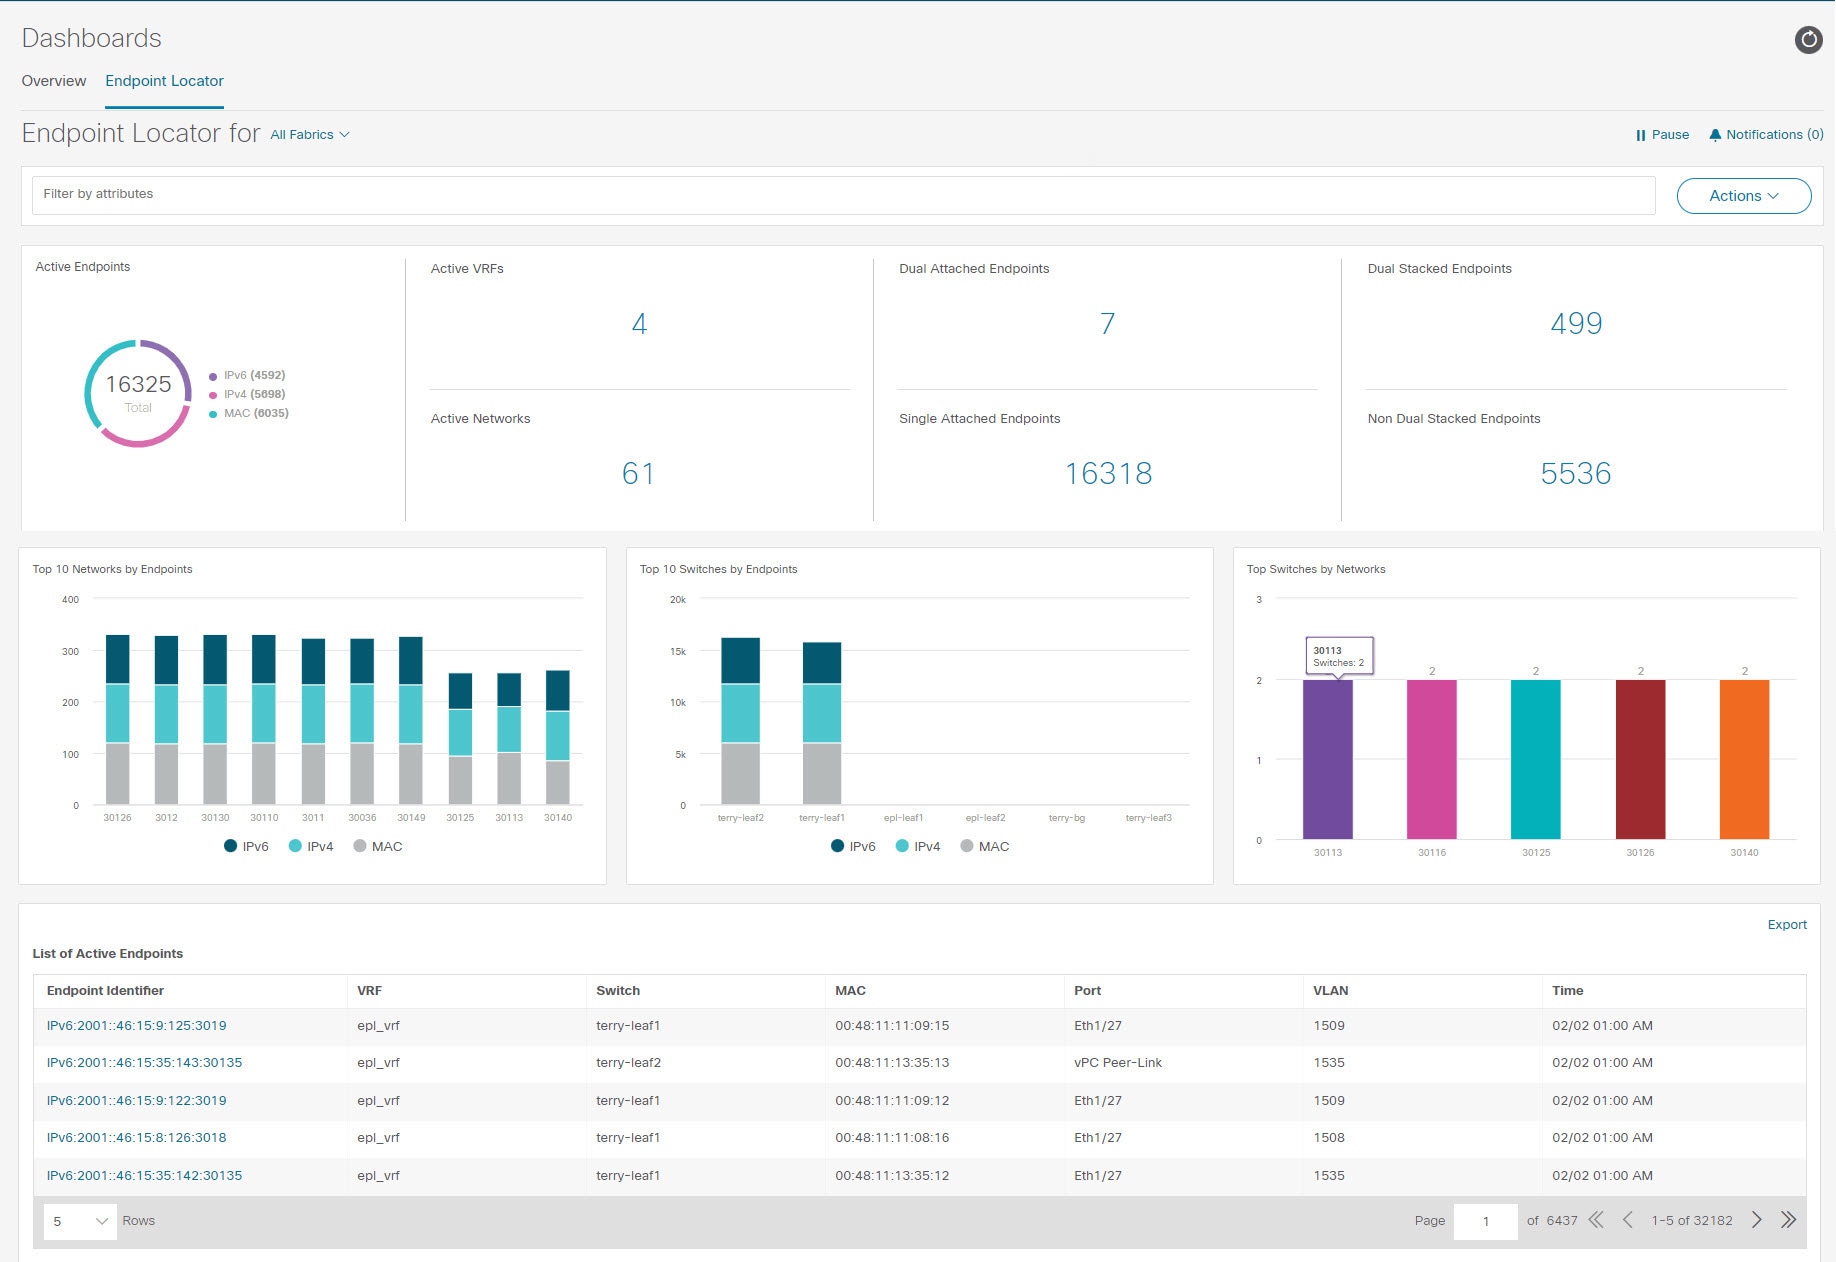
To explore endpoint locator details from the Cisco Nexus Dashboard Fabric Controller Web UI, choose Dashboard > Endpoint Locator. The Endpoint Locator dashboard is displayed.
Due to an increase in scale, the system may take some time to collect endpoint data and display it on the dashboard. On bulk addition or removal of endpoints, the endpoint information displayed on the EPL dashboard takes a few minutes to refresh and display the latest endpoint data.
-
You can initiate a search by using the available options in the filter by attributes search bar field.
You can also filter and view the endpoint locator details for a specific Switch, VRF, Network, and Type by using the respective drop-down lists. You can select MAC type of endpoints as a filter attribute. The name of the network is also displayed in the Network drop-down list. By default, the selected option is All for these fields. You can display endpoint data for a specific device by entering the host IP address, MAC address, or the name of the virtual machine in the Search Host IP/MAC/VM Name field.
-
You can click All fabrics drop-down list to view endpoint locator details for all fabrics or required fabric.
An alarm is generated if there are any endpoint related anomalies. Click the Pause icon to temporarily stop the near real-time collection and display of data. By default Run is chosen. Click Notification icon to view the notification details.
-
Click Actions > Endpoint Search. For more information, refer to Endpoint Search.
-
Click Actions > Endpoint Life. For more information, refer to Endpoint Life.
-
Click Actions Resync to syncing to the data currently in the Route Reflector (RR). However, historical data is preserved. We recommend not clicking Resync multiple times as this is a compute-intense activity.
In certain scenarios, the datapoint database may go out-of-sync and information, such as the number of endpoints, is not displayed correctly due to network issues such as:
-
Endpoint moves under the same switch between ports and the port information needs some time to be updated.
-
An orphan endpoint is attached to the second VPC switch and is no longer an orphan endpoint.
-
NX-API not enabled initially and then enabled at a later point in time.
-
NX-API failing initially due to misconfiguration.
-
Change in Route Reflector (RR).
-
Management IPs of the switches are updated.
-
-
Click Notifications icon to display a list of the most recent notifications.
The Endpoint Locator Notifications window appears.
Information such as the time at which the notification was generated, the description of the notification, severity level is displayed.
Notifications are generated for events such as duplicate IP addresses, duplicate MAC-Only addresses, VRF disappears from a fabric, all endpoints disappear from a switch, endpoint moves, endpoints on a fabric going to zero, when endpoints are attached to a switch, when a new VRF is detected, and when the RR BGP connectivity status changes. The RR connected status indicates that the Nexus Dashboard Fabric Controller can connect to the RR through BGP (Nexus Dashboard Fabric Controller and RR are BGP neighbors). The RR disconnected status indicates that the RR is disconnected and the underlying BGP is not functioning.
You can initiate a search by using the available options in the filter by attributes search bar field.
The top pane of the window displays the following information:
The top pane of the window displays the number of active endpoints, active VRFs, active networks, dual attached endpoints, single attached endpoints and dual stacked endpoints, for the selected scope. Support for displaying the number of dual attached endpoints, single attached endpoints and dual stacked endpoints has been added. A dual attached endpoint is an endpoint that is behind at least two switches. A dual stacked endpoint is an endpoint that has at least one IPv4 address and one IPv6 address.
-
Historical analysis of data is performed and a statement mentioning if any deviation has occurred or not over the previous day is displayed at the bottom of each tile.
Click any tile in the top pane of the EPL dashboard to go to the Endpoint History window.
The 'middle pane' of the window displays the following information:
-
Top 10 Networks by Endpoints - A pie chart is displayed depicting the top ten networks that have the most number of endpoints. Hover over the pie chart to display more information. Click on the required section to view the number of IPv4, IPv6, and MAC addresses.
-
Top 10 Switches by Endpoints - A pie chart is displayed depicting the top ten switches that are connected to the most number of endpoints. Hover over the pie chart to display more information. Click on the required section to view the number of IPv4, IPv6, and MAC addresses.
-
Top Switches by Networks - Bar graphs are displayed depicting the number of switches that are associated with a particular network. For example, if a vPC pair of switches is associated with a network, the number of switches associated with the network is 2.
The 'bottom pane' of the window displays the list of active endpoints.
If a virtual machine has been configured, the name of the VM is displayed in the Node Name field. Note that it can take up to 15 minutes for the name of the VM to be reflected in the EPL dashboard. Until then, the EPL dashboard displays No DATA in the Node Name field.
Click Export to download the list of active endpoints in .csv format.
Click on required endpoint identifier, a slide-in pane appears and the related details are displayed. Click Endpoint Life. The Endpoint Life window appears for selected endpoint identifier. For more information, refer to Endpoint Life.
Click the search icon in the Endpoint Identifier column to search for specific IP addresses.
Consider a scenario in which EPL is first enabled and the Process MAC-Only Advertisements checkbox is selected. Then, EPL is disabled and enabled again without selecting the Process MAC-Only Advertisements checkbox. As the cache data in elasticsearch is not deleted on disabling of EPL, the MAC endpoint information is still displayed in the EPL dashboard. The same behavior is observed when a Route-Reflector is disconnected. Depending on the scale, the endpoints are deleted from the EPL dashboard after some time. In certain cases, it may take up to 30 minutes to remove the older MAC-only endpoints. However, to display the latest endpoint data, you can click Resync.
Endpoint History
Click any tile in the top pane of the EPL dashboard to go to the Endpoint History window. A graph depicting the number of active endpoints, VRFs and networks, dual attached endpoints and dual stacked MAC endpoints at various points in time is displayed. The graphs that are displayed here depict all the endpoints and not only the endpoints that are present in the selected fabric. Endpoint history information is available for the last 30 days amounting to a maximum of 100 GB storage space.
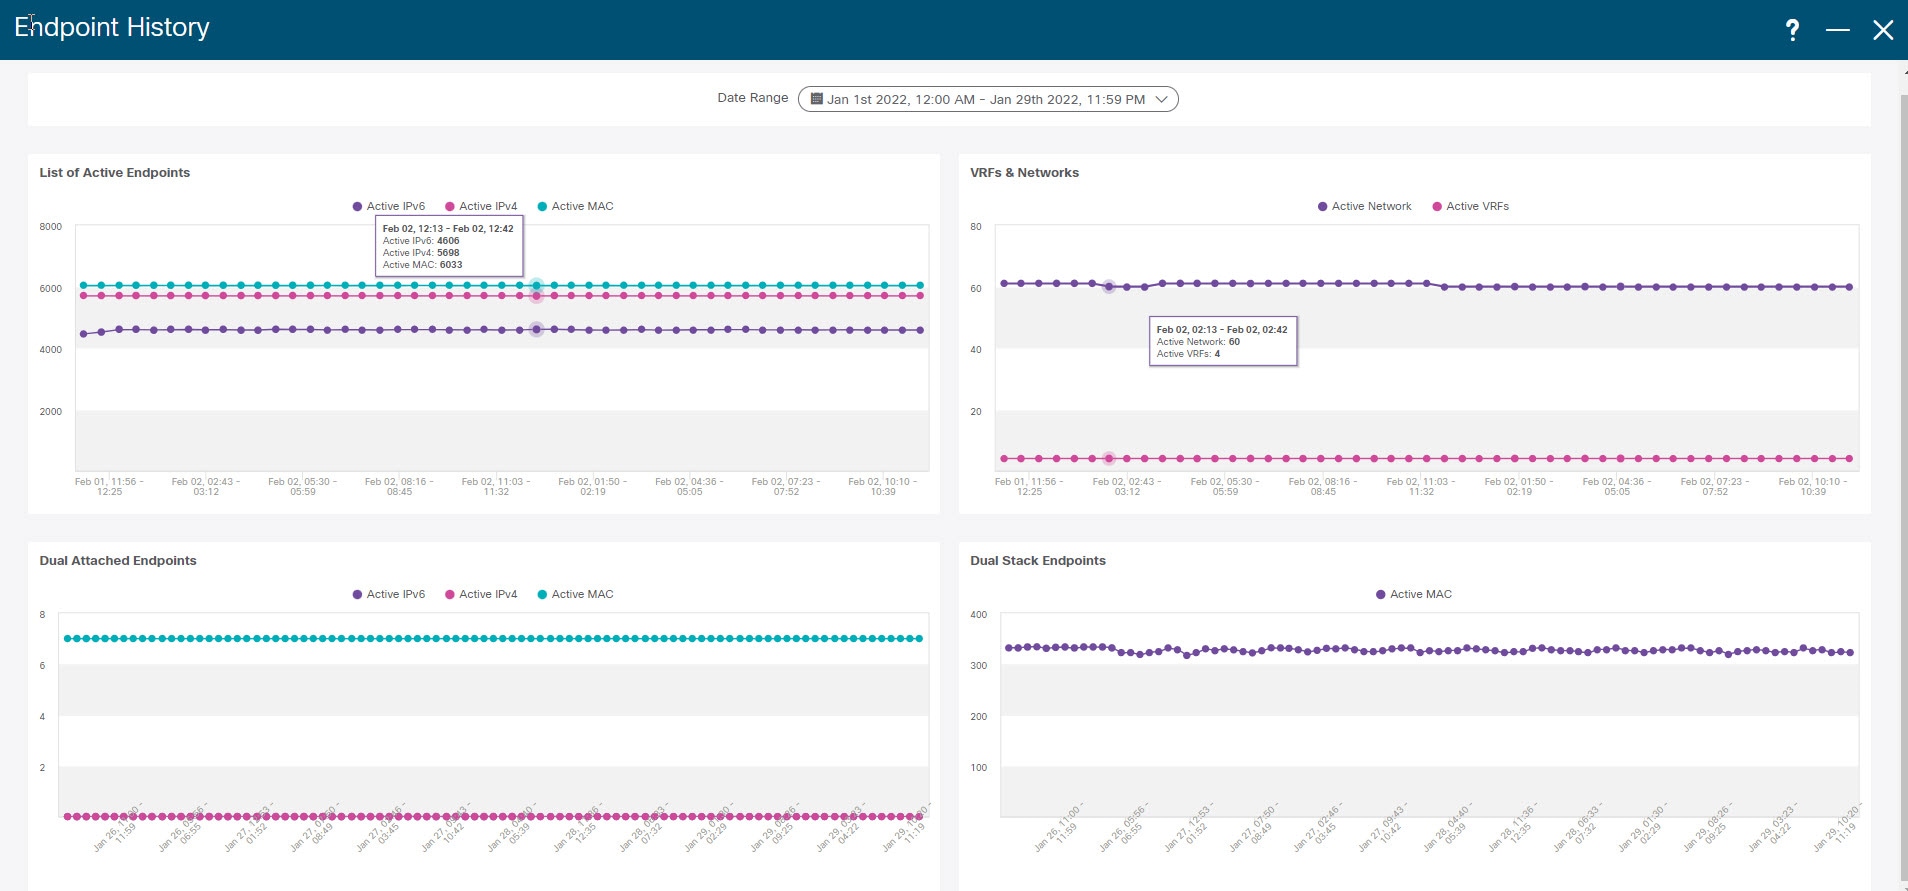
Hover over the graph at specific points to display more information. The points in the graph are plotted at 30-minute intervals. You can also display the graph for a specific requirement by clicking the color-coded points at the bottom of each graph. For example, click on all color-coded points other than active (IPv4) in the Active Endpoints window displayed above such that only active (IPv4) is highlighted and the other points are not highlighted. In such a scenario, only the active IPv4 endpoints are displayed on the graph. You can also click on the required color-coded points at the bottom of the graph to display the graph for a specific requirement. For example, hover over active (IPv4) to display only the active IPv4 endpoints on the graph.
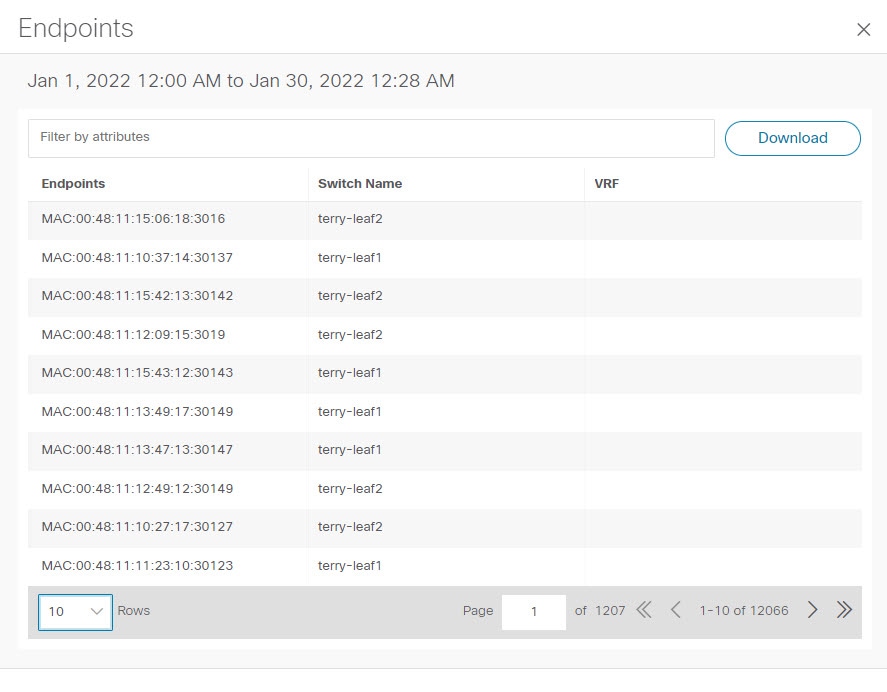
Click on any point in the graph to display a window that has detailed information about that point of time. For example, click on a specific point in the Active Endpoints graph to display the Endpoints window. This window has information about the endpoints along with the name of the switch and the VRF associated with the endpoint. Click Download to download the data as a CSV file.
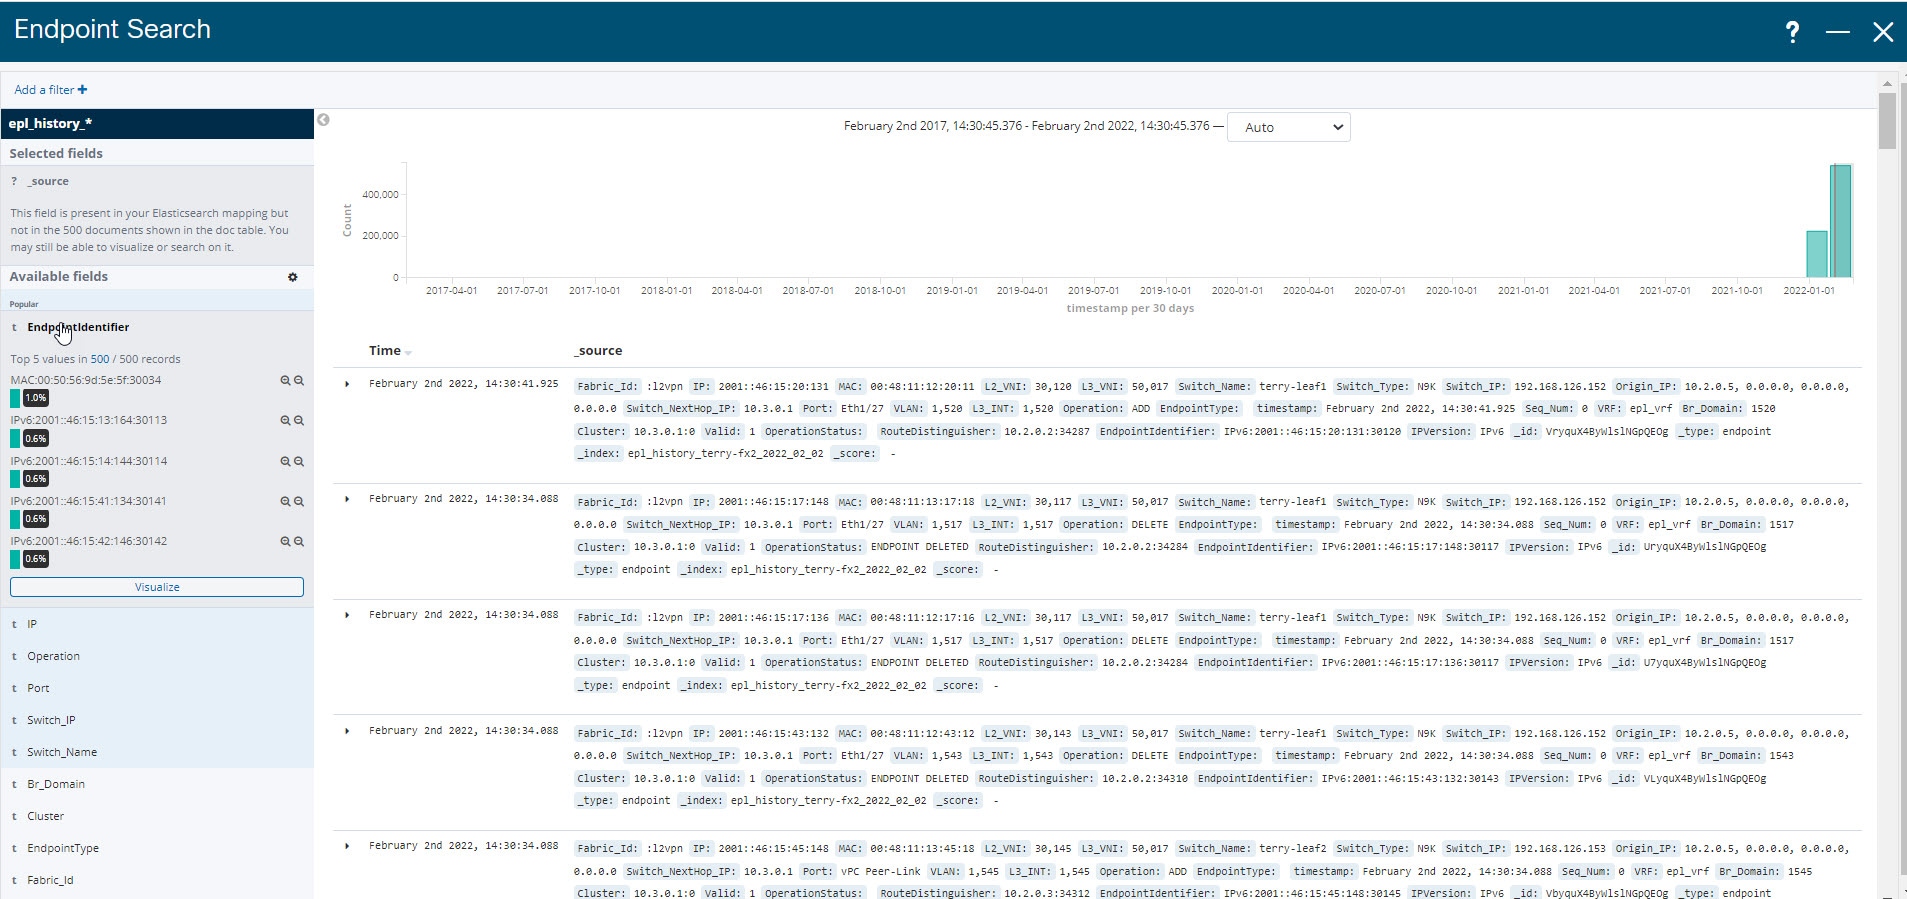
Endpoint Search
UI Path: DashboardEndpoint > Locator.
On Endpoint Locator window, click Actions > Endpoint Search to view a real-time plot displaying endpoint events for the period specified in a date range.
You cannot change time on the clock icon. Ignore the tooltip to change the time.
The results displayed here are dependent on the fields listed under Selected fields located in the menu on the left. You can add any field listed under Available fields to Selected fields to initiate a search using the required fields.
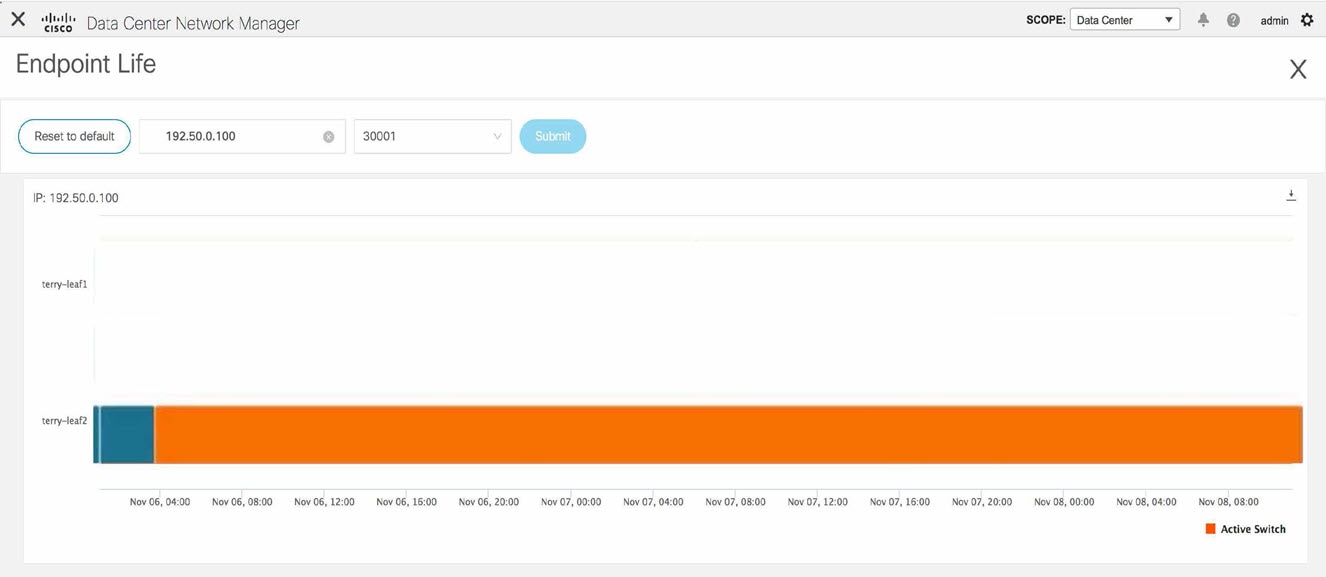
Endpoint Life
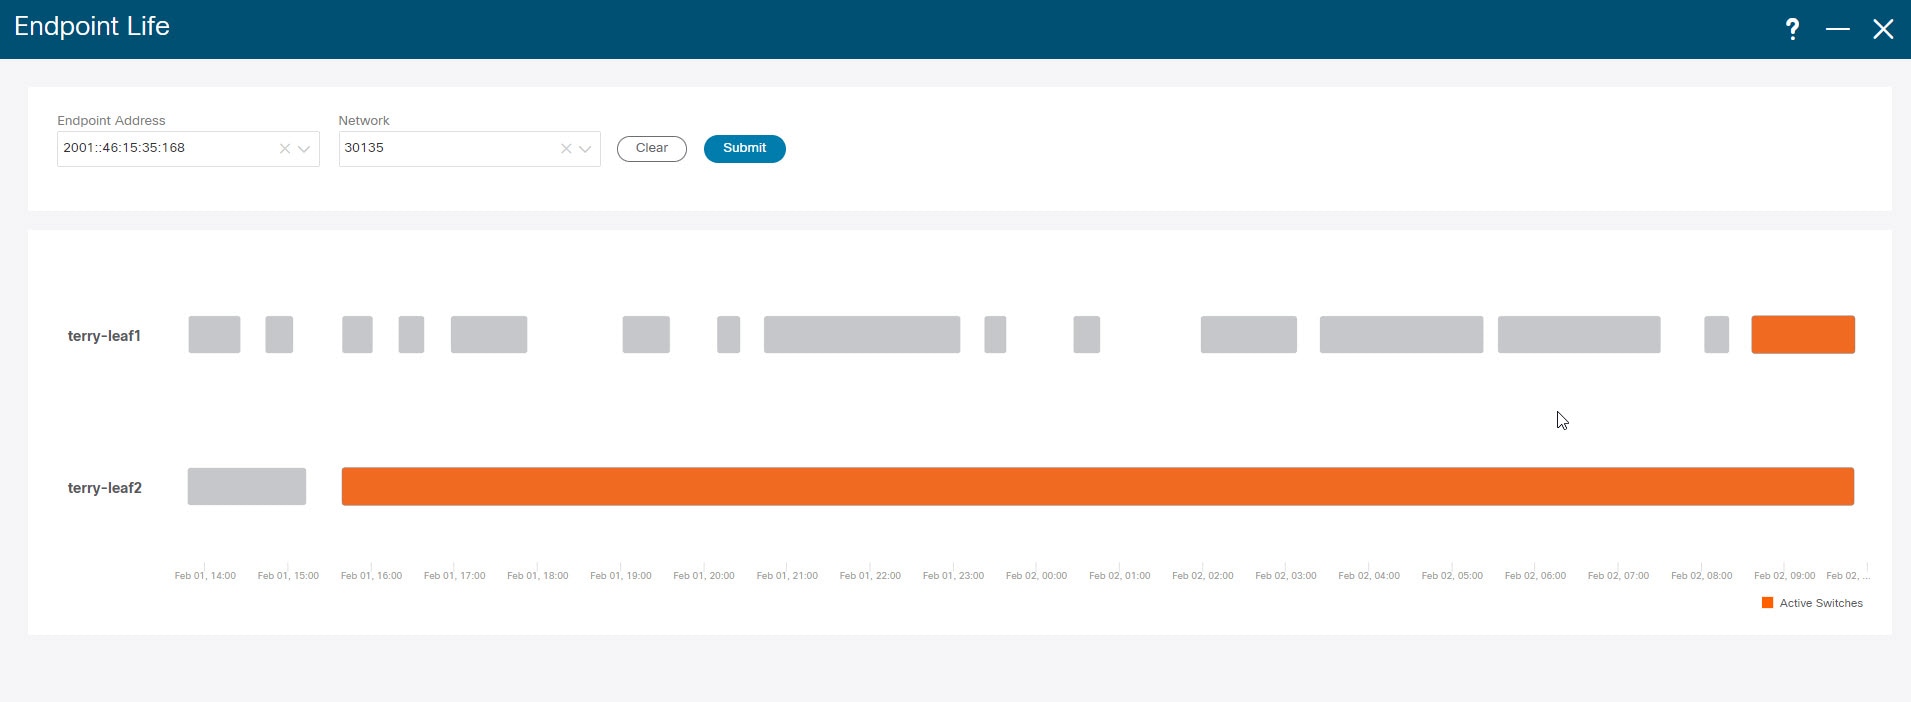
Click Actions > Endpoint Life to display a time line of a particular endpoint in its entire existence within the fabric.
Specify the IP or MAC address of an endpoint and the VXLAN Network Identifier (VNI) to display the list of switches that an endpoint was present under, including the associated start and end dates. Click Submit.
Initiate a search by using an IPv4 or IPv6 address to display the Endpoint Life graph for IPv4/IPv6 endpoints. Initiate a search by using a MAC address to display the Endpoint Life graph for MAC-Only endpoints.
The window that is displayed is essentially the endpoint life of a specific endpoint. The bar that is orange in color represents the active endpoint on that switch. If the endpoint is viewed as active by the network, it will have a band here. If an endpoint is dual-homed, then there will be two horizontal bands reporting the endpoint existence, one band for each switch (typically the vPC pair of switches). In case the endpoints are deleted or moved, you can also see the historical endpoint deletions and moves on this window.
Topology
To view topology information for your Nexus Dashboard Fabric Controller, in the NDFC GUI, navigate to Overview > Topology.
Beginning with NDFC release 12.2.2, the Topology page in NDFC has been redesigned with enriched features geared towards providing cleaner navigation. The graphical elements and the way that information is presented looks different in NDFC release 12.2.2, but the basic functioniality that existed for Topology in the previous release is essentially unchanged.
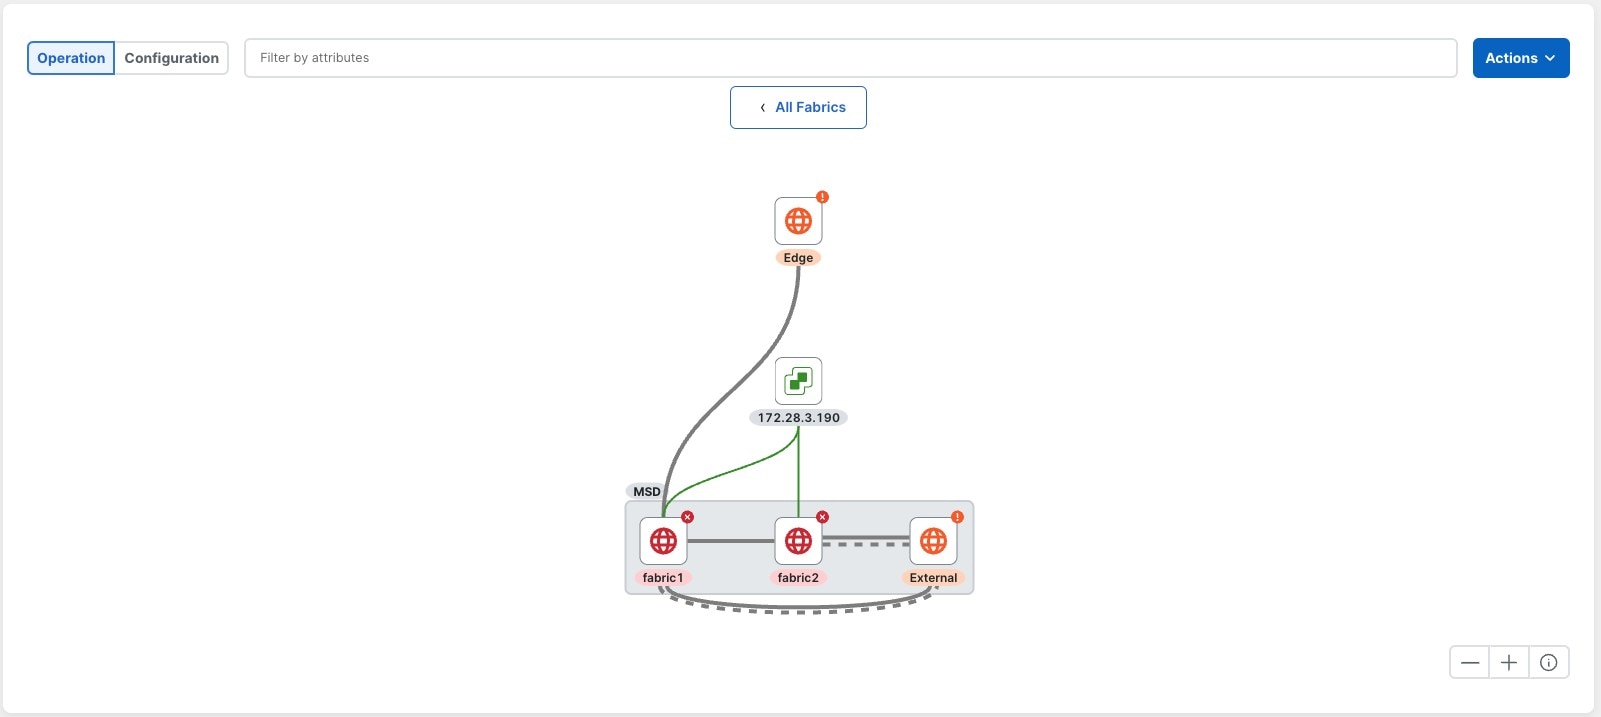
The starting point for Topology is the All Fabrics view, where you can see all of the individual fabrics and fabric groups in your NDFC, alongside vCenter and Kubernetes Cluster Visualizers that you might have configured in your network.
There are two menu options at the top left of the screen:
-
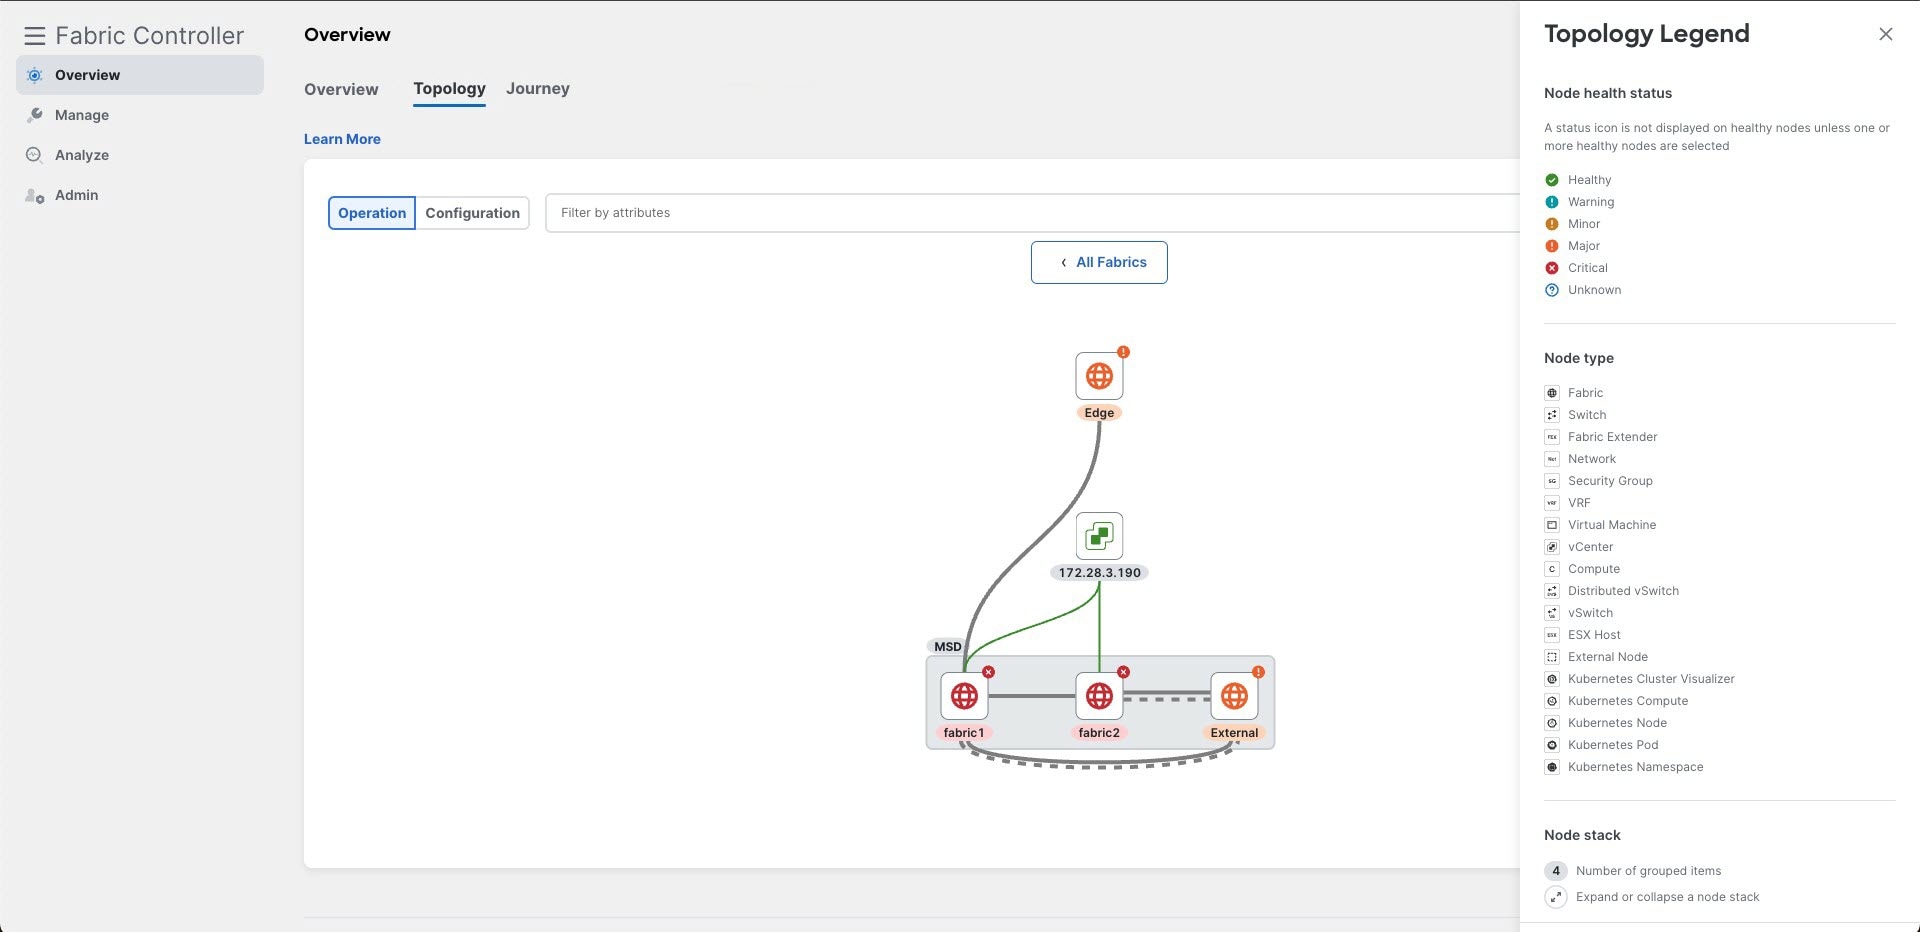
Operation: View your configured network statuses
-
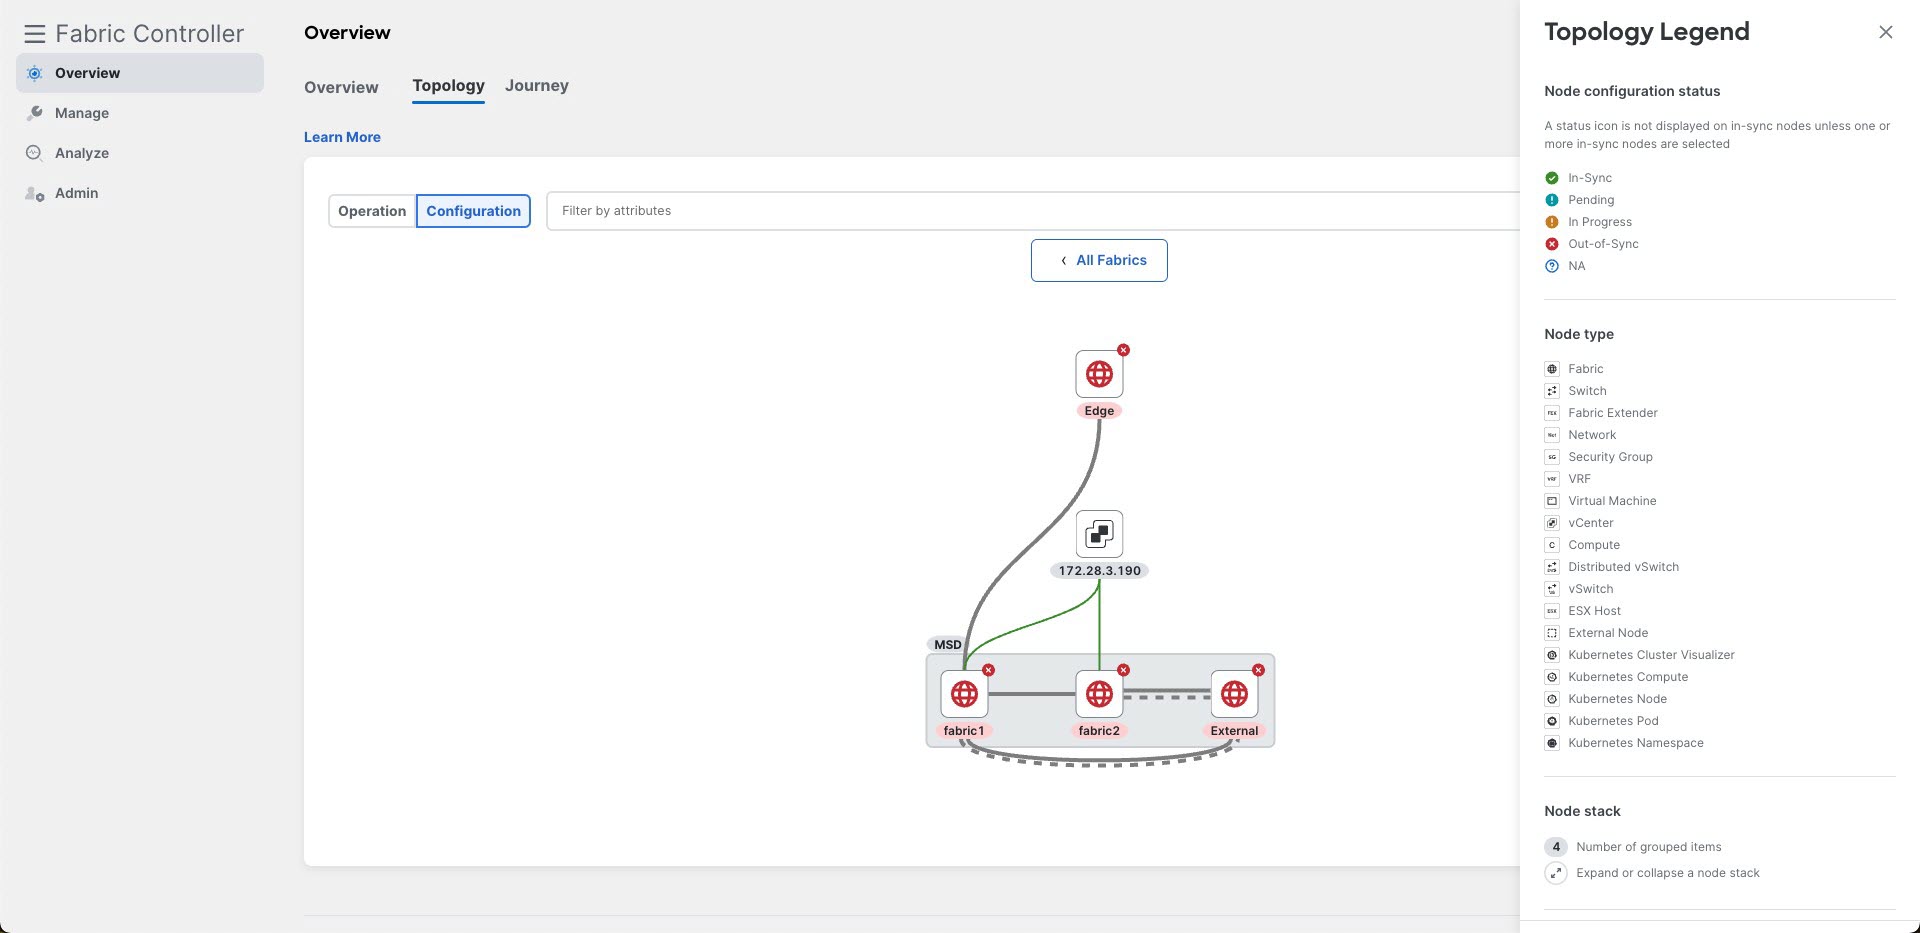
Configuration: View your current network statuses
The definitions of the depicted colours change when toggling between these two buttons. You can access the colour legend, along with additional information, by clicking on the (i) at the bottom right corner of the screen:
Zoom controls are also in the bottom right corner, where you can zoom in using + and zoom out using -.
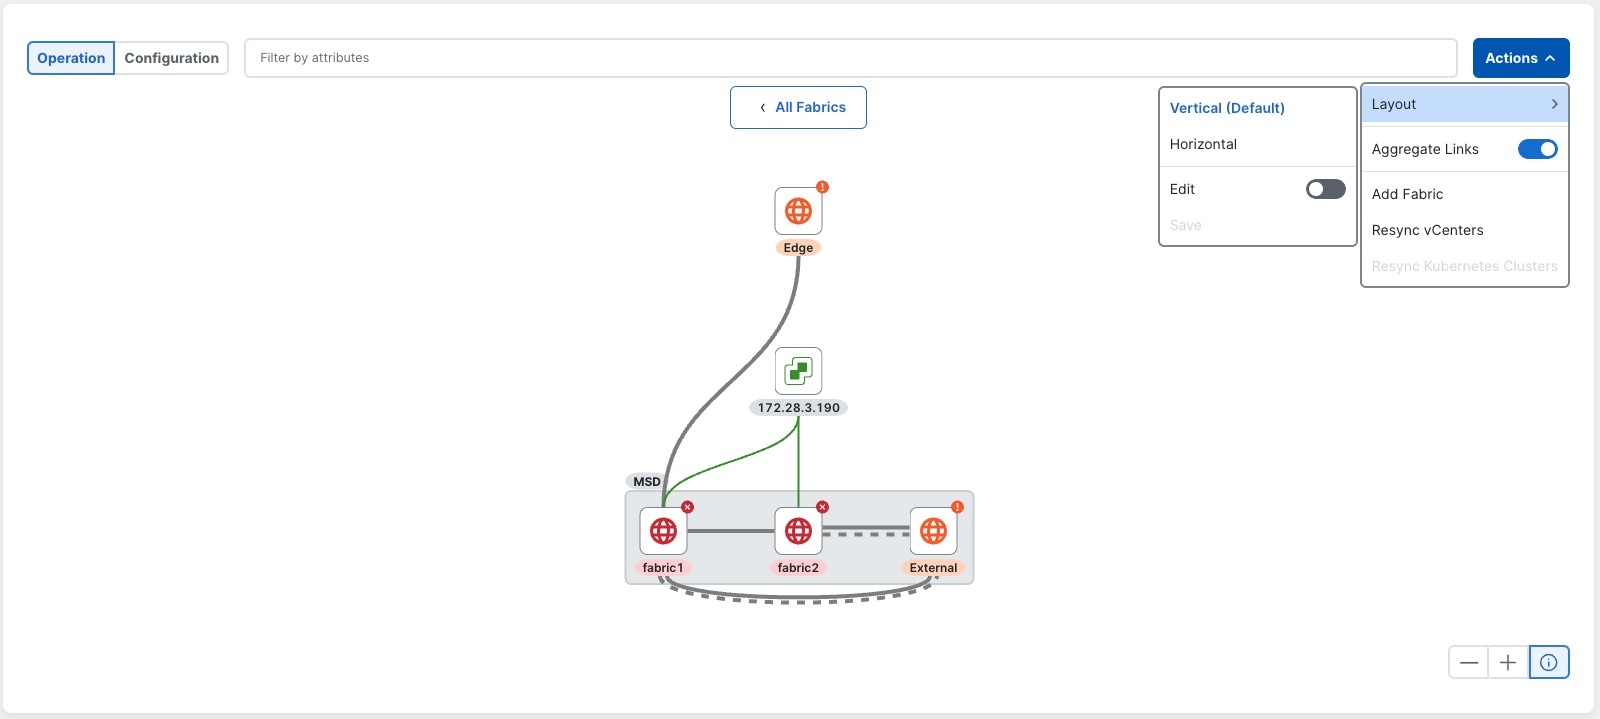
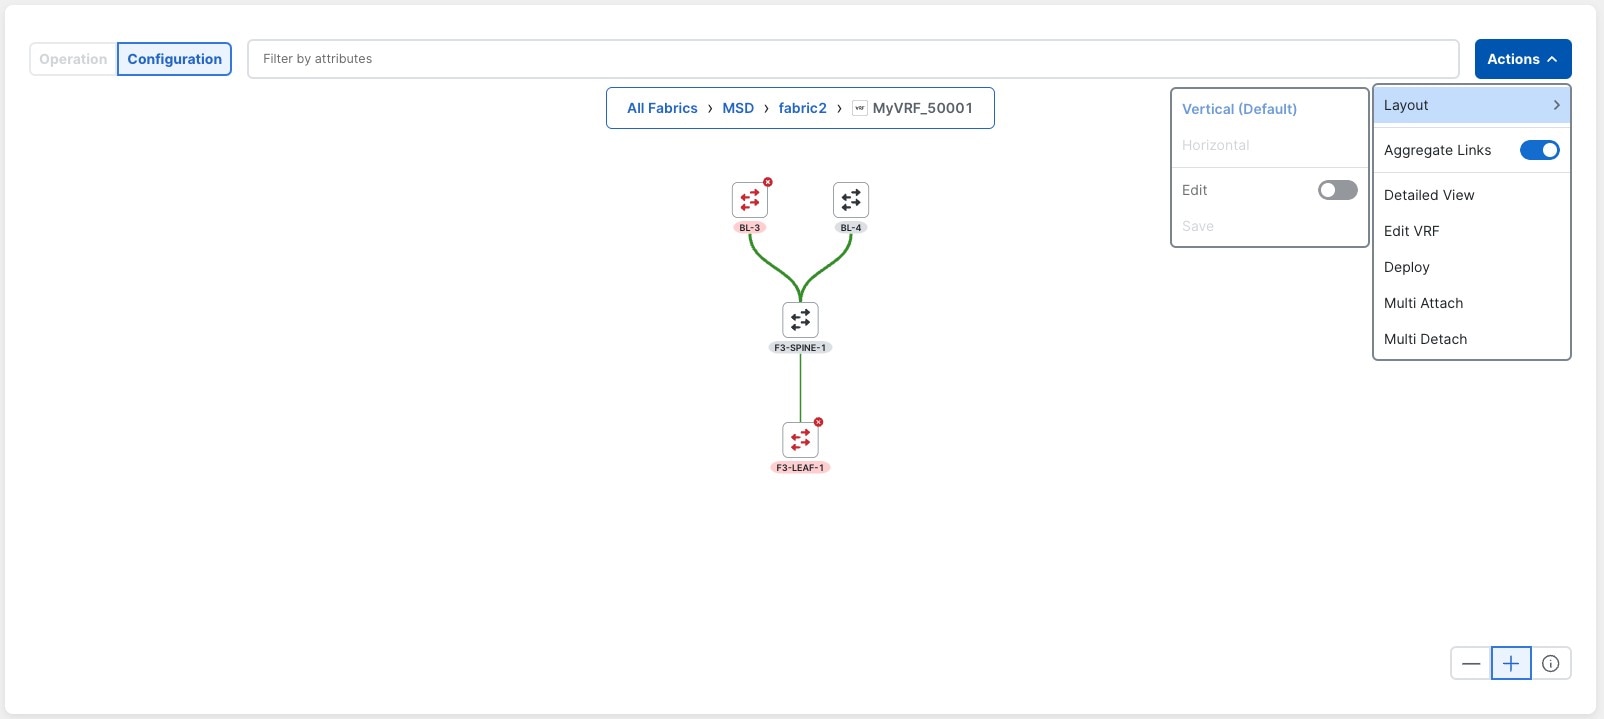
The Actions dropdown in the upper right corner contains contextual actions relative to the view where you are in the graph. For example, if you are in the All Fabrics view, then the options available through the Actions dropdown relate to the objects in this view. Similarly, if you have navigated to a view of a single fabric in the topology (for example, All Fabrics > MSD > fab1), then the options available through the Actions dropdown relate to that single fabric.
Typically, Actions dropdown, you will find layout options (changing the layout, editing or saving your desired layout), an option to aggregate the depicted links, and other contextual actions specific to the type of node.
The following sections provide more information on specific areas in the Topology page:
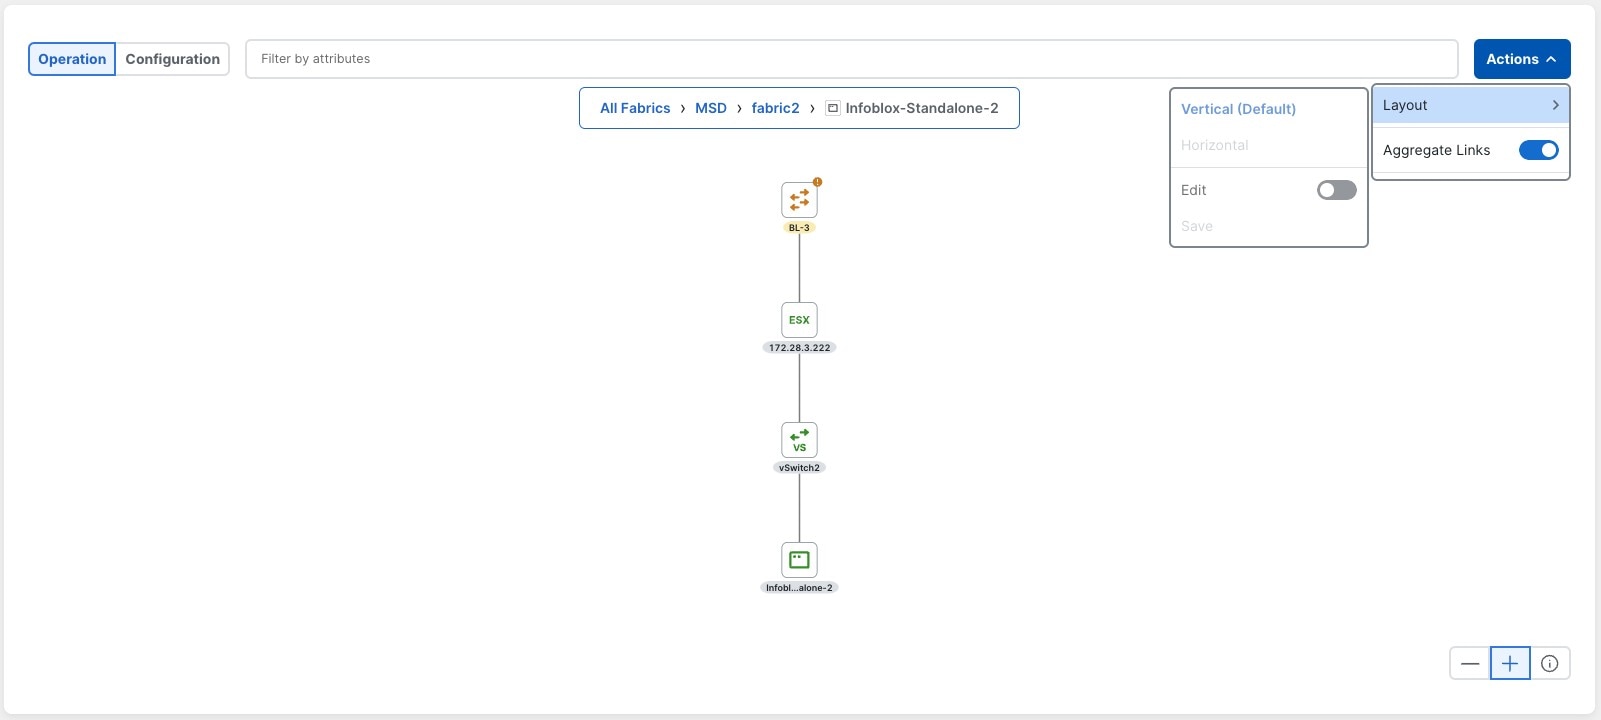
Layout Selection
There are two types of predefined layouts:
-
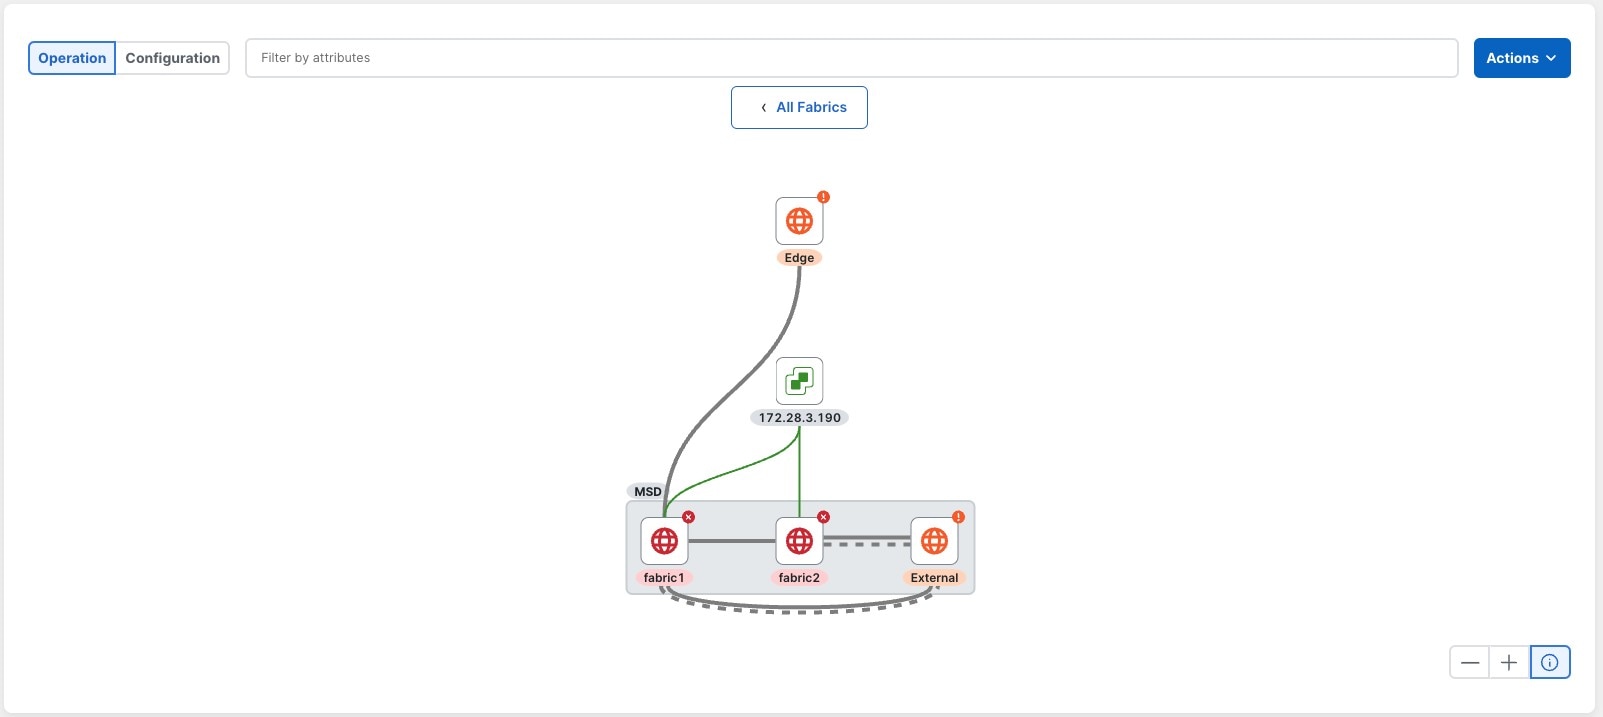
Vertical (default)
-
Horizontal
The next figures show examples of both types of layouts.
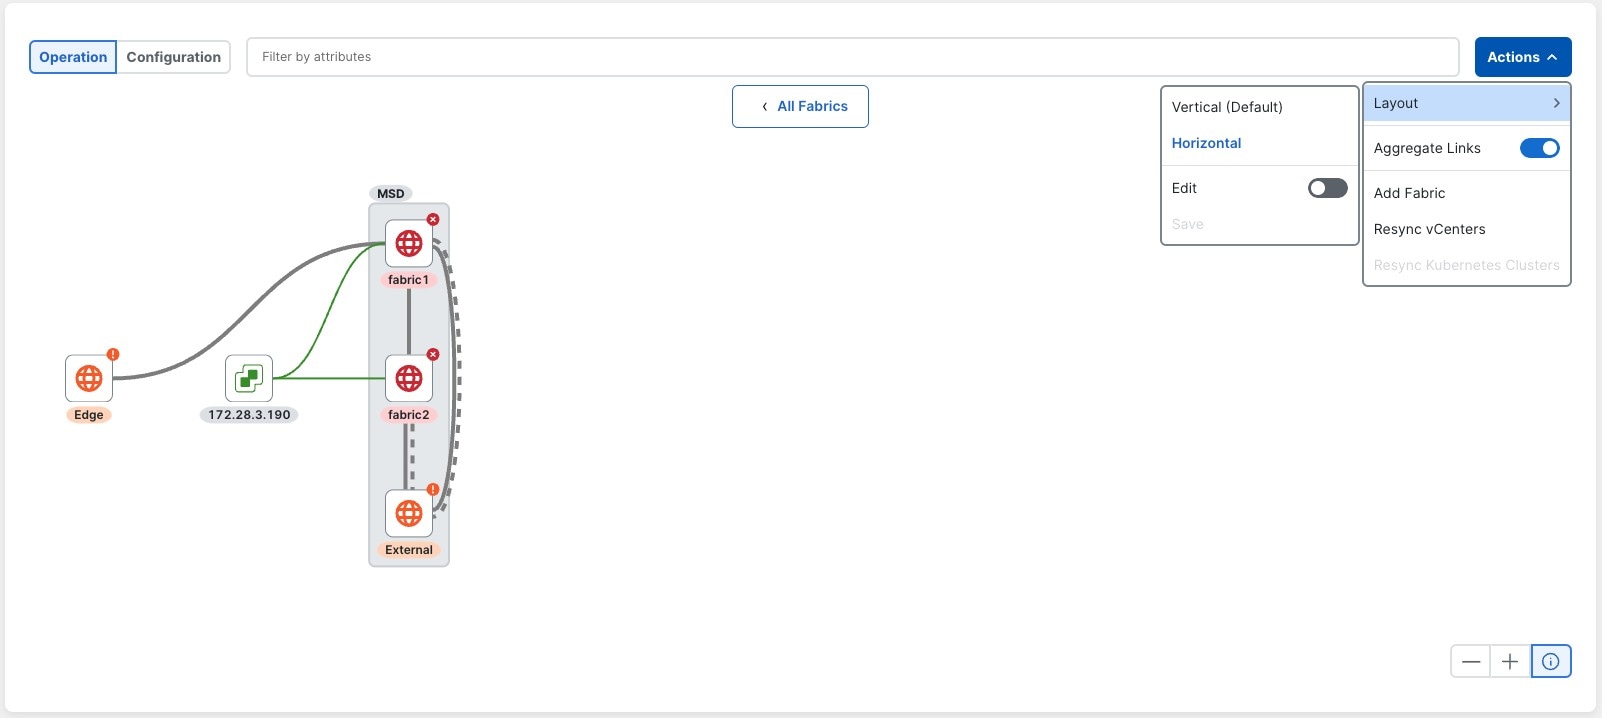
The vertical layout only allows scrolling along the vertical axis, while the horizontal only allows scrolling along the horizontal axis. In whichever layout that you choose, the other axis will remain constant according to your screen size. When zooming in and out, certain elements might shift around to allow for all elements to be shown in the screen for that layout.
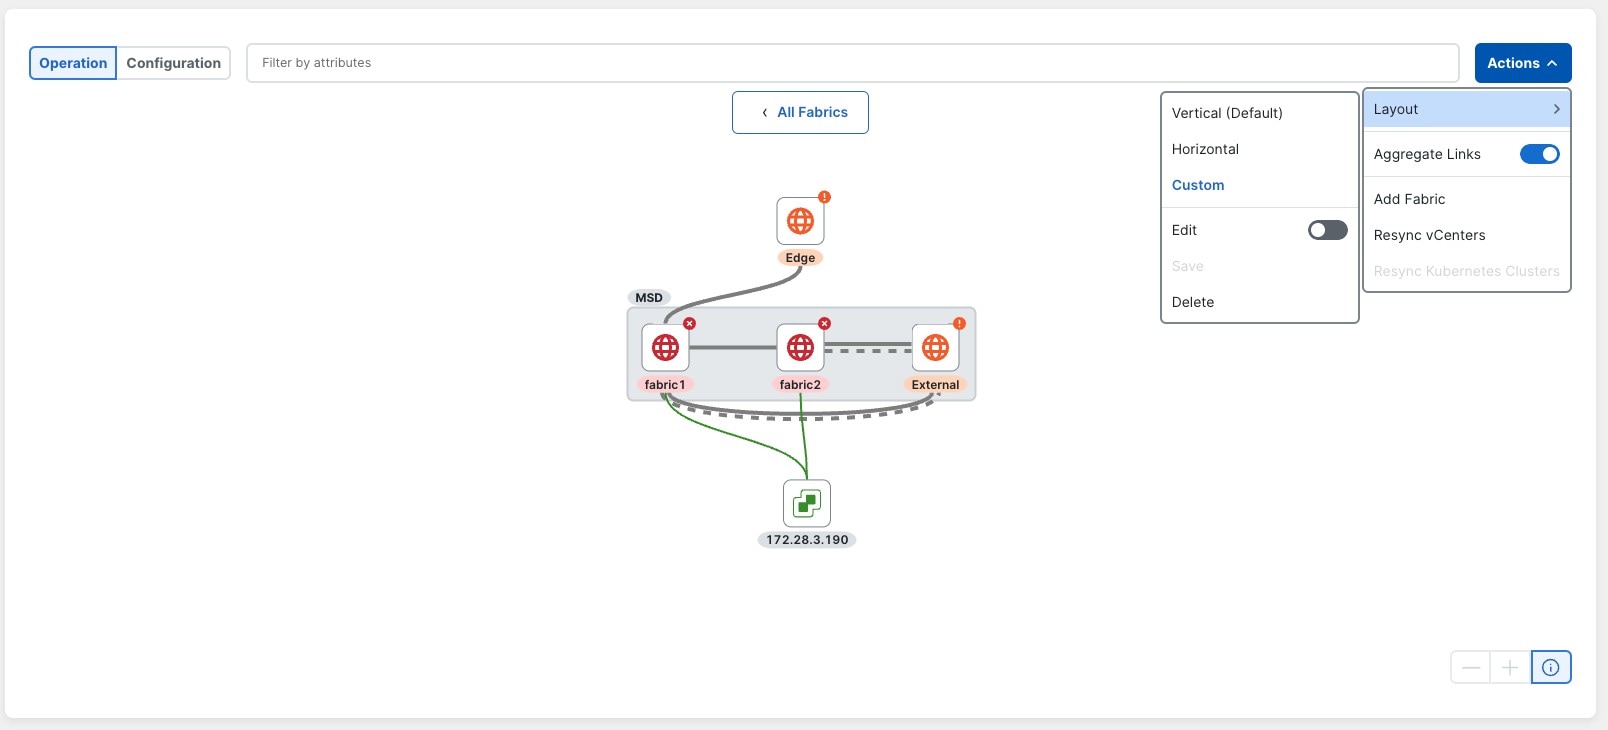
If you find that neither of these layouts provide the view that you want, click Actions > Layout, then toggle on the Edit option to go into a freeform edit mode. Move elements around on the screen in the Edit mode until you are satisfied with the result, then click Save to save this layout. This saved layout will then get loaded every time you come back into this view.
Note the following guidelines when you are in freeform edit mode:
-
You can only save one freeform layout edit at a time; if you click Edit again, then move elements around and click Save again, the previously saved freeform layout is overwritten.
-
Tooltips are disabled when you are in freeform edit mode. Click Actions > Layout, then toggle off the Edit option to re-enable tooltips.
Once you have saved a freeform layout, the Custom menu option appears and is selected under the Actions > Layout menu. A Delete option also becomes available, which you can use when you don’t want to use your freeform layout anymore. Note that the zoom controls are disabled when you are in a Custom layout.
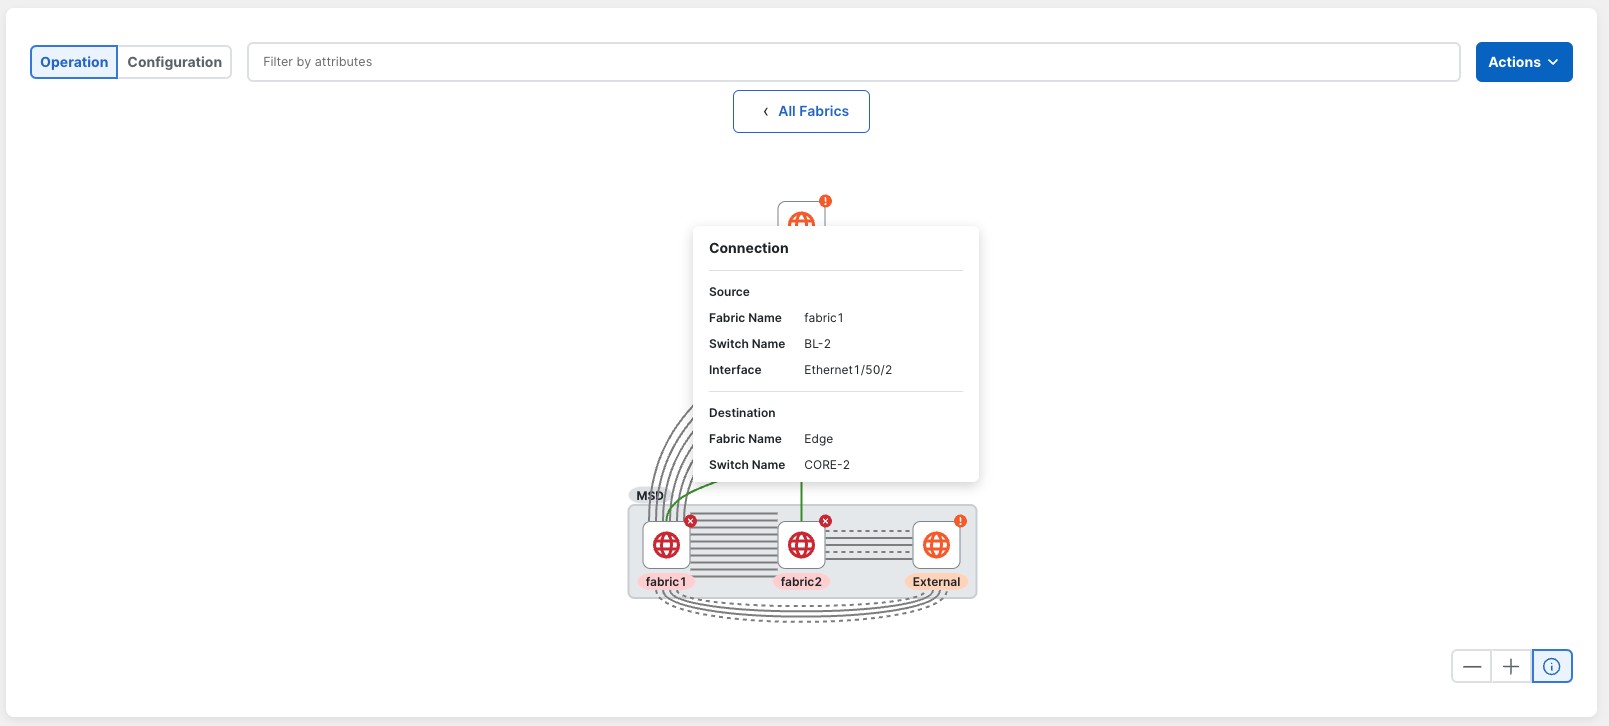
Tooltips
Single-click on an element to access a general summary of that element.
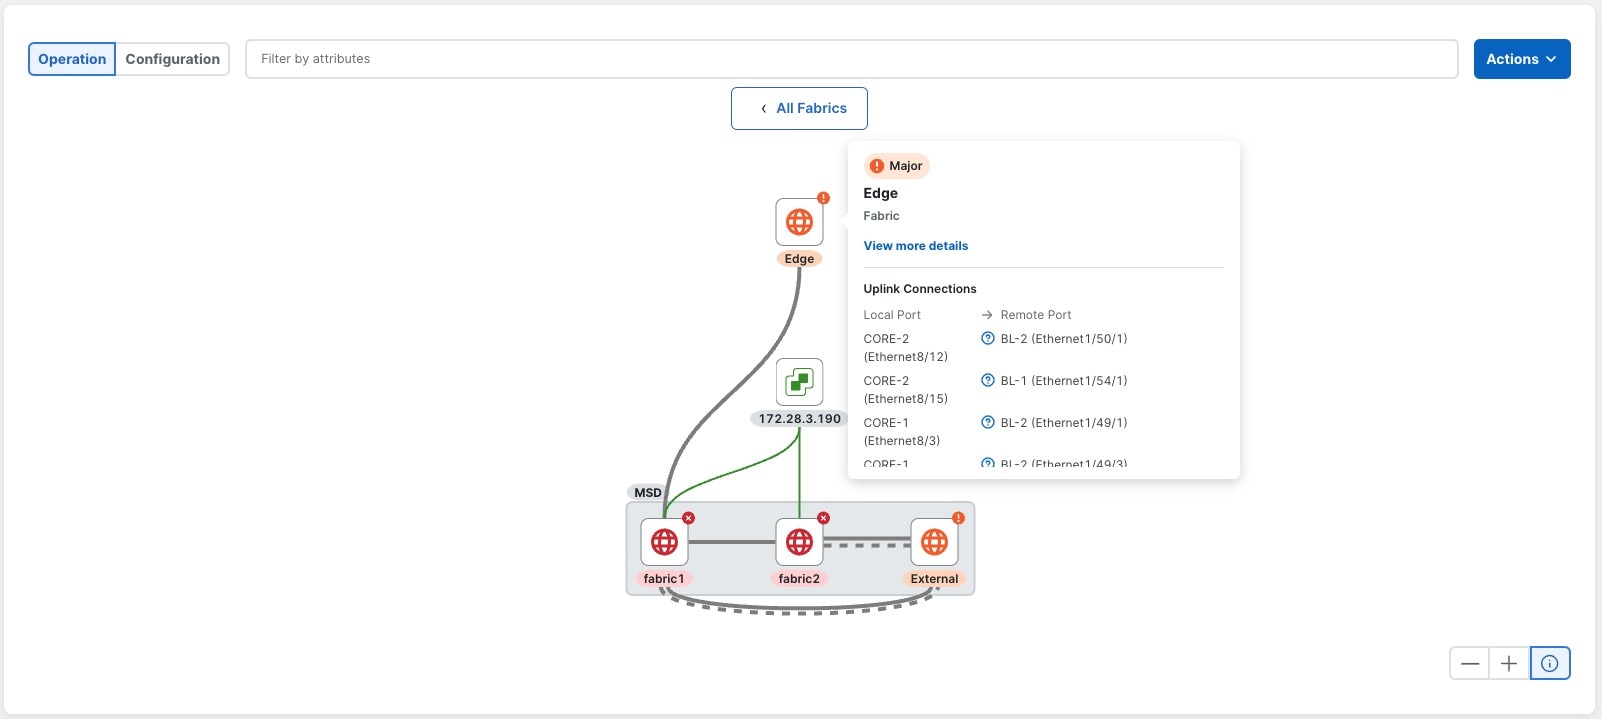
For example, single-clicking on a node provides tooltips that contain information about the existing connections, as well as a summary of general information. The content of the tooltips is scrollable.
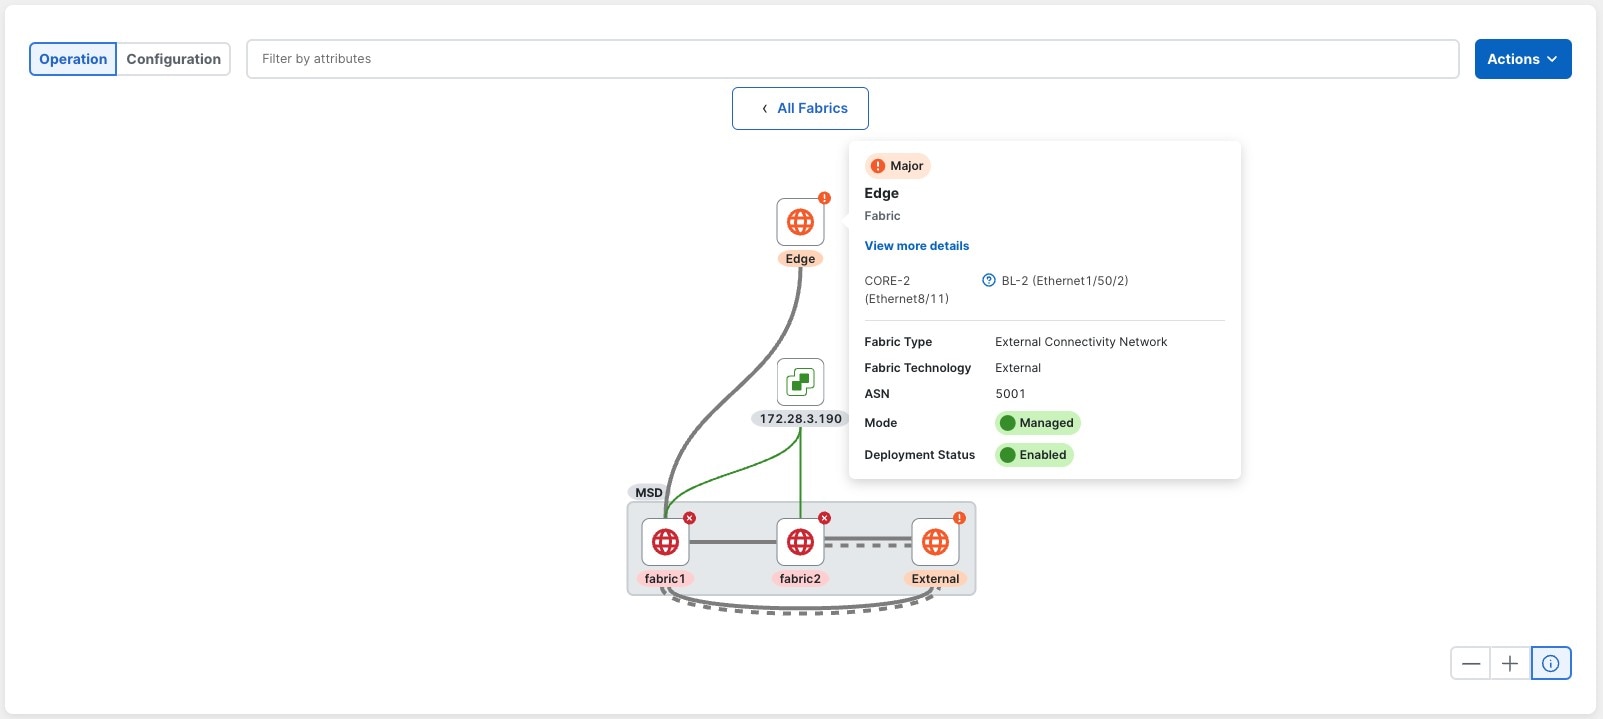
You can also get a more detailed view by clicking View more details on the top of the content.
When clicking on a link, you will get information related to the connected interfaces and the name of the connected devices.
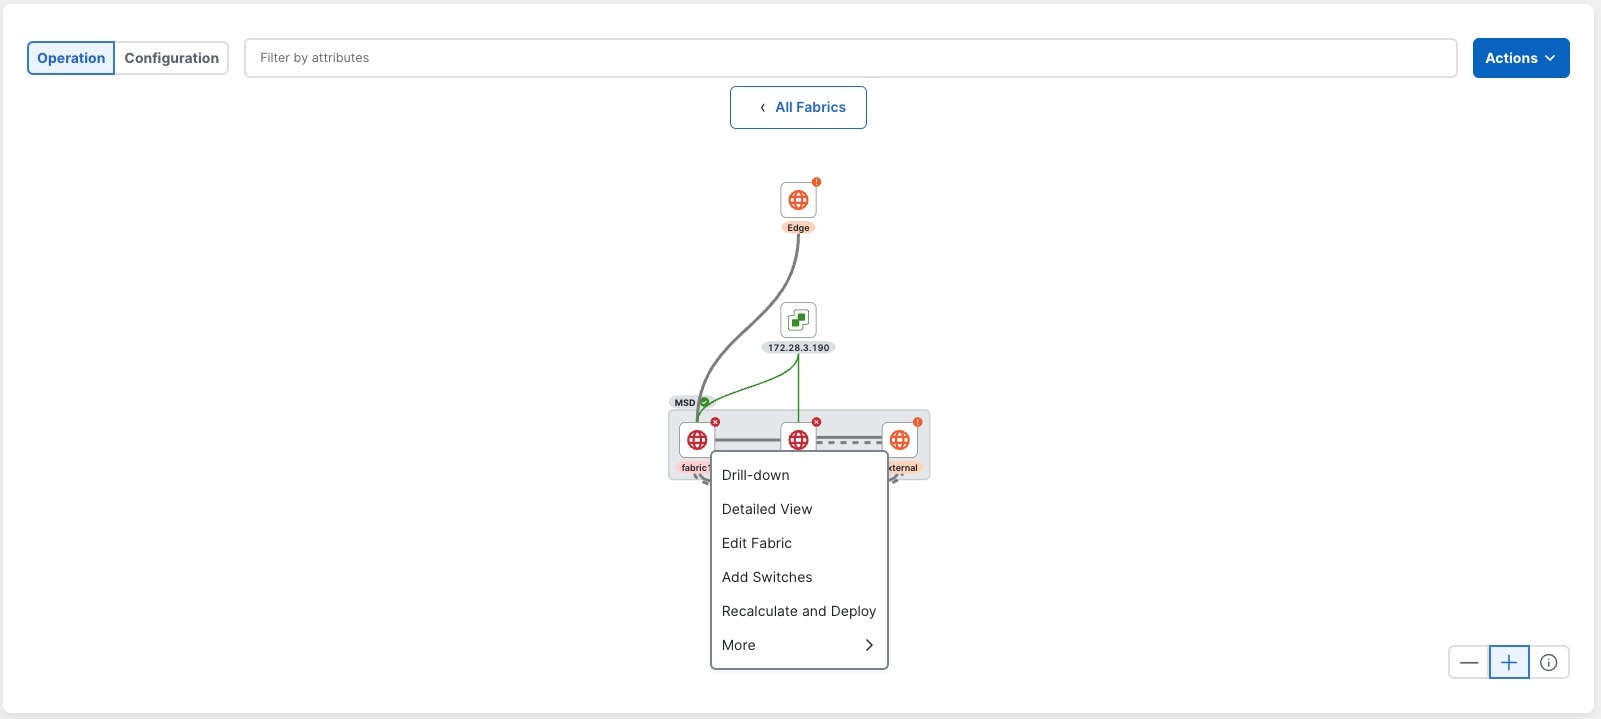
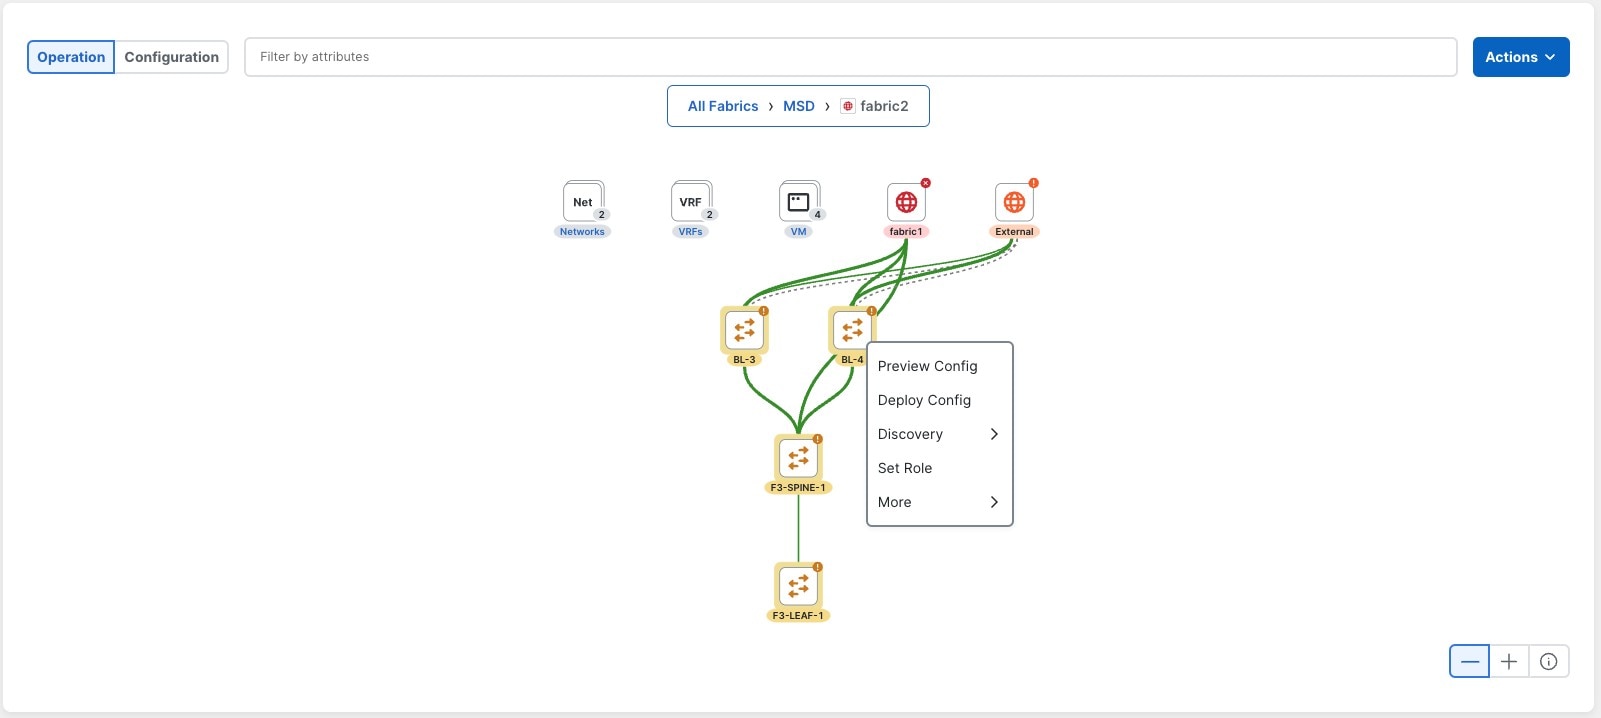
Contextual Menus
When you right-click on any of the rendered elements, a contextual menu opens.
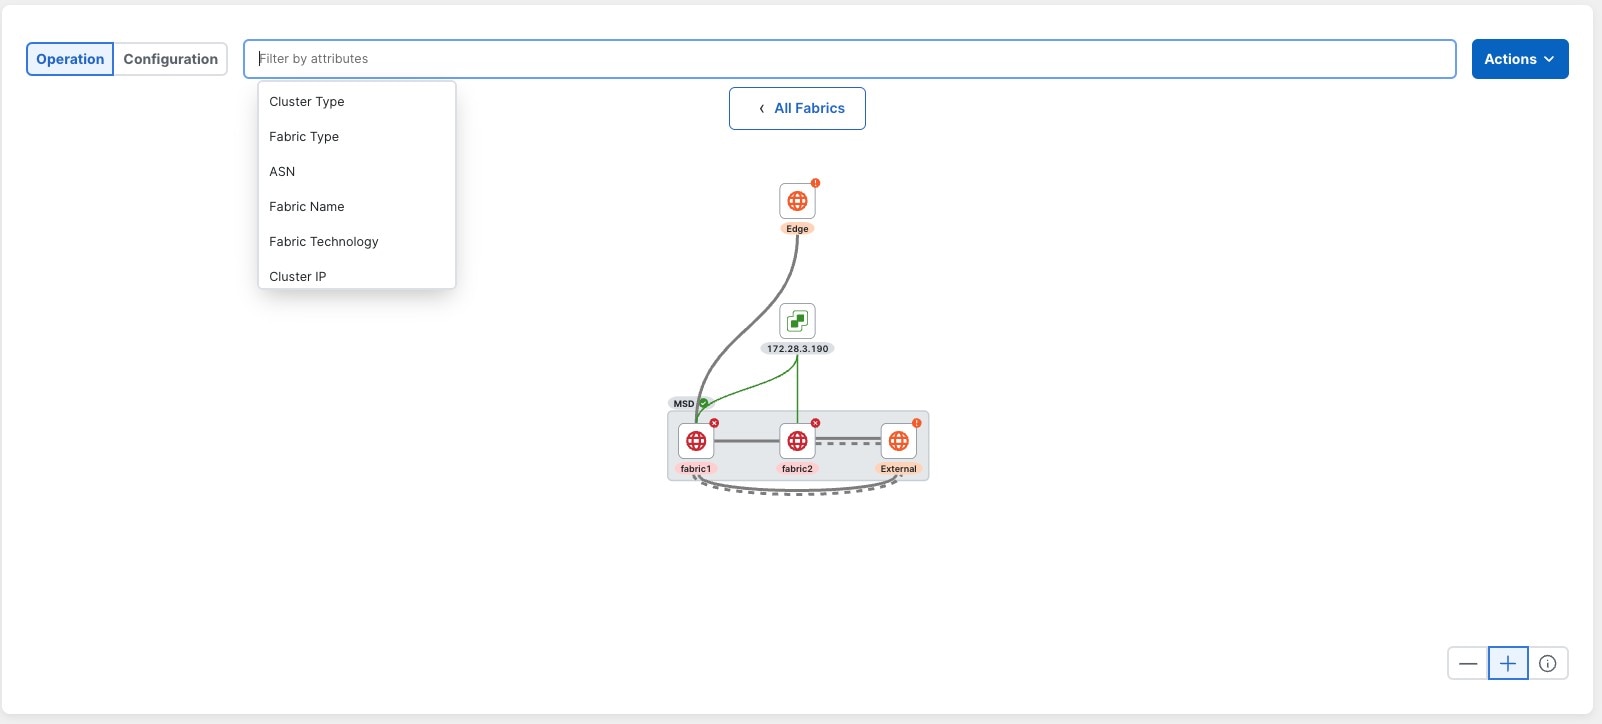
Filtering
The filter bar at the top of an element showcases possible filters and operators that can be applied to the view that you are in, as shown in the next figure. The filters change according to the view that you are in.
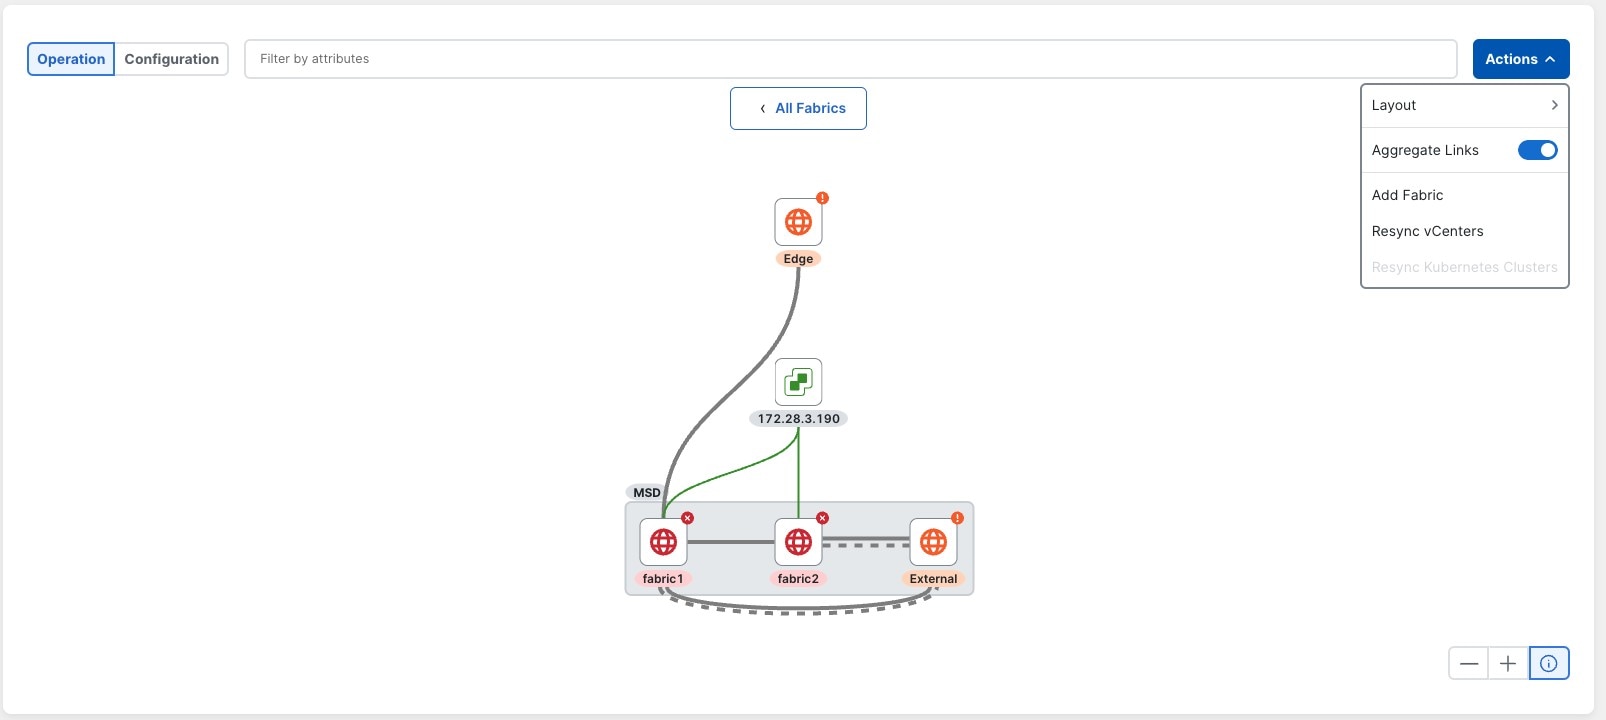
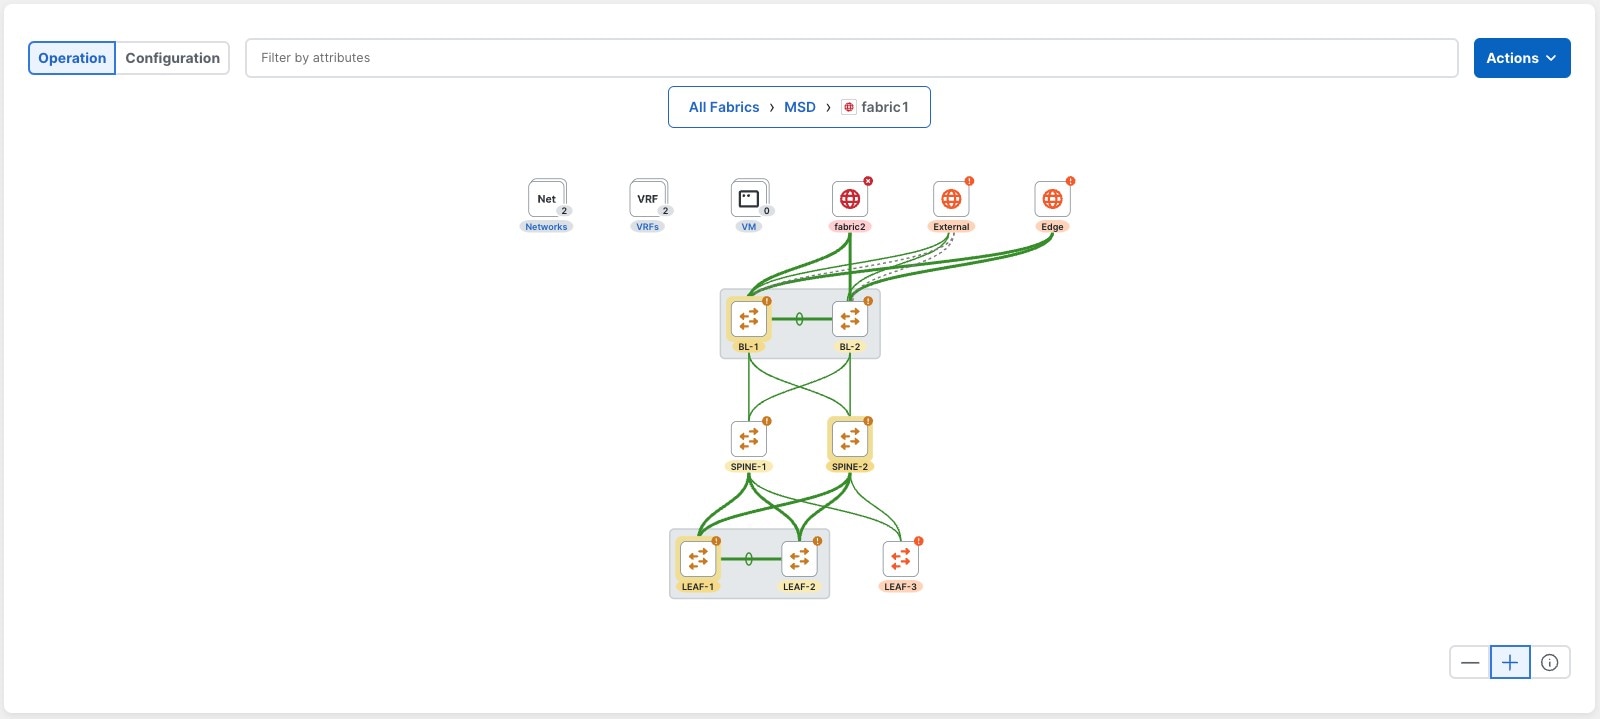
Link Aggregation
In the Actions dropdown, a toggle is available for Aggregate Links, which is enabled by default. This action transforms all individual full lines into one thick full line, while all individual dotted lines become one thick dotted line. The colour of this aggregated link is based on the least-healthy status of all its constituents.
This figure shows an example scenario where the Aggregate Links option is enabled:
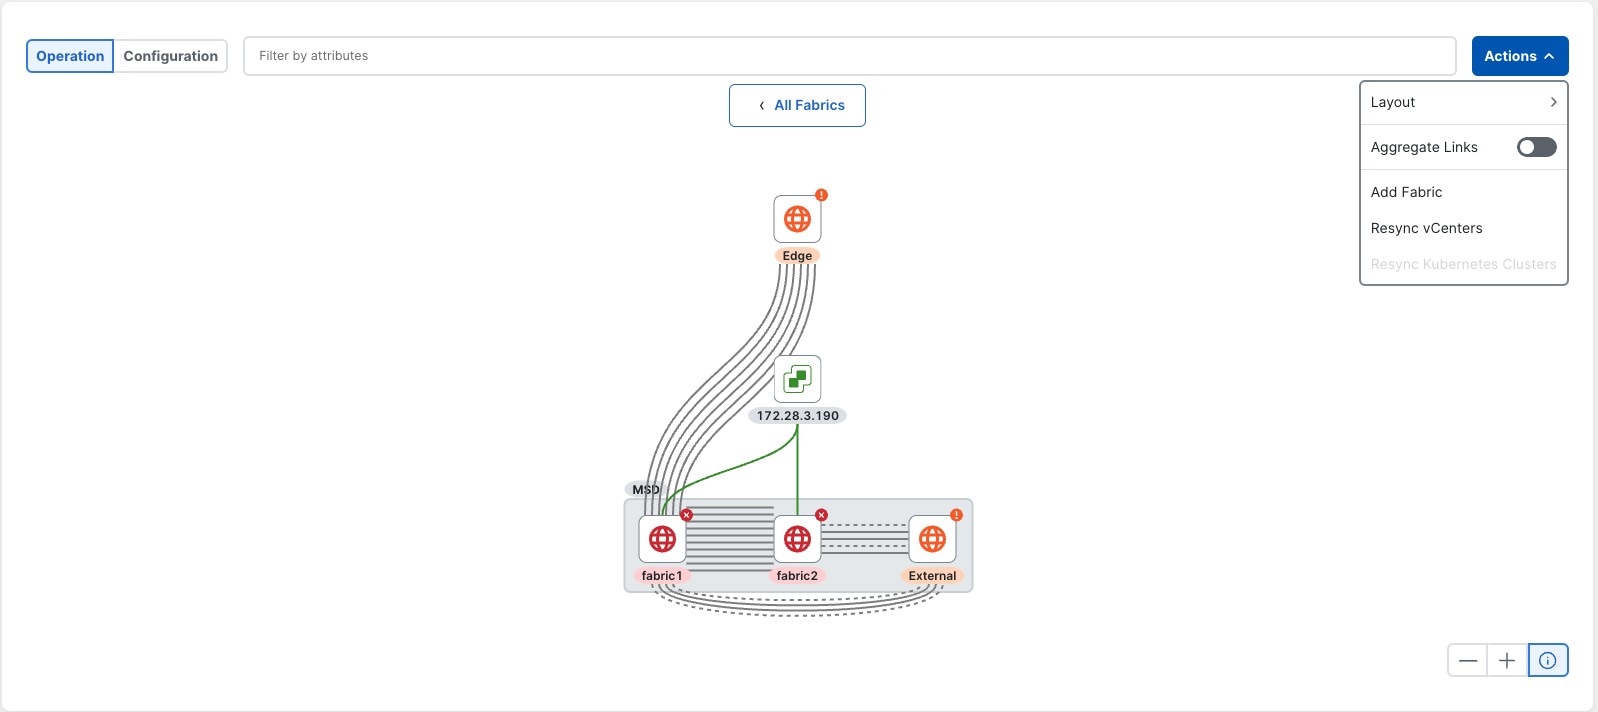
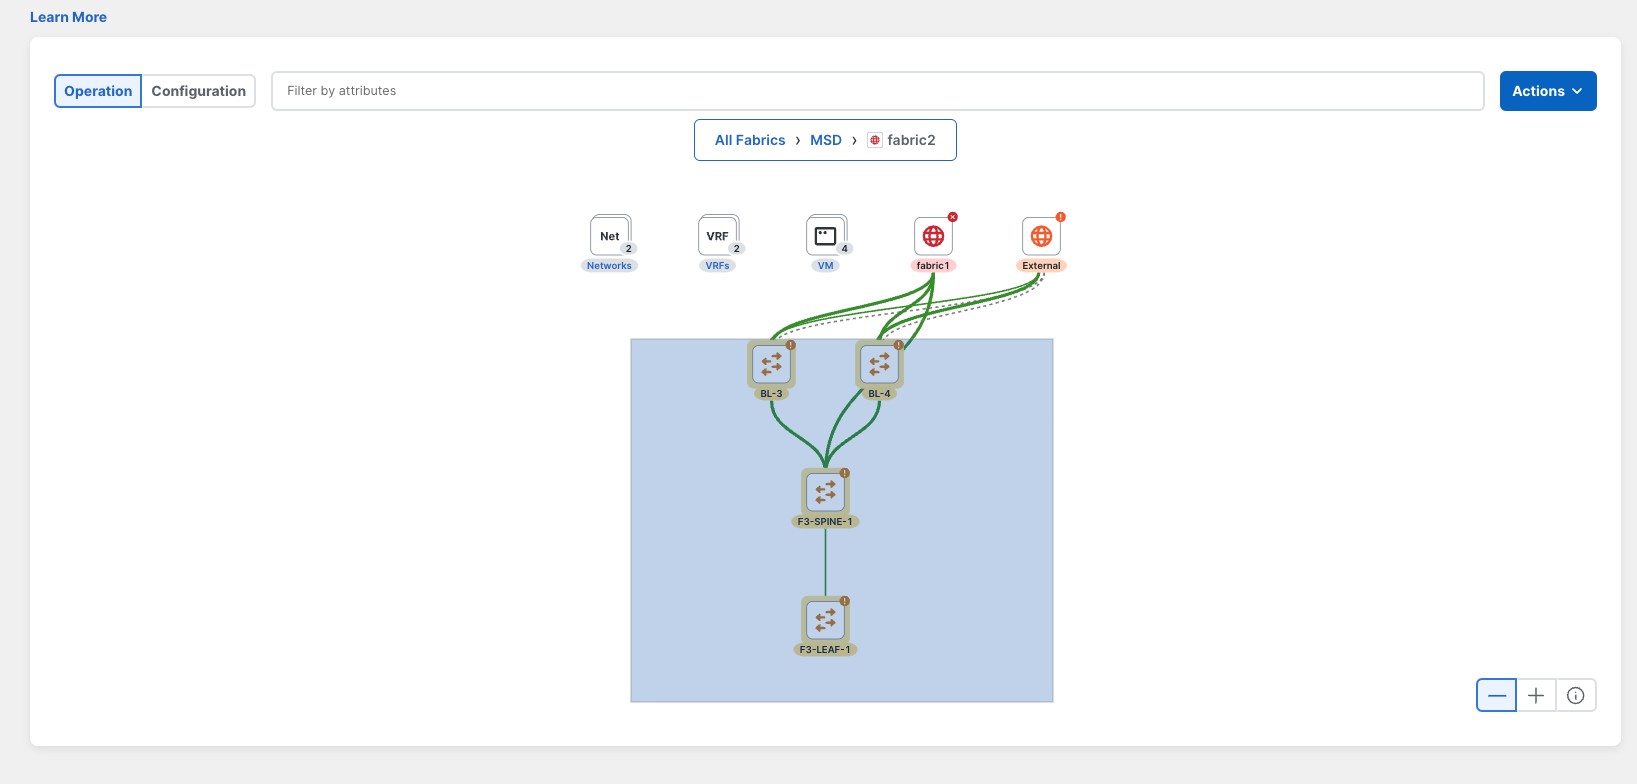
This figure shows an example scenario where the Aggregate Links option is disabled:
You can view a summary of all the connections by clicking on the line:
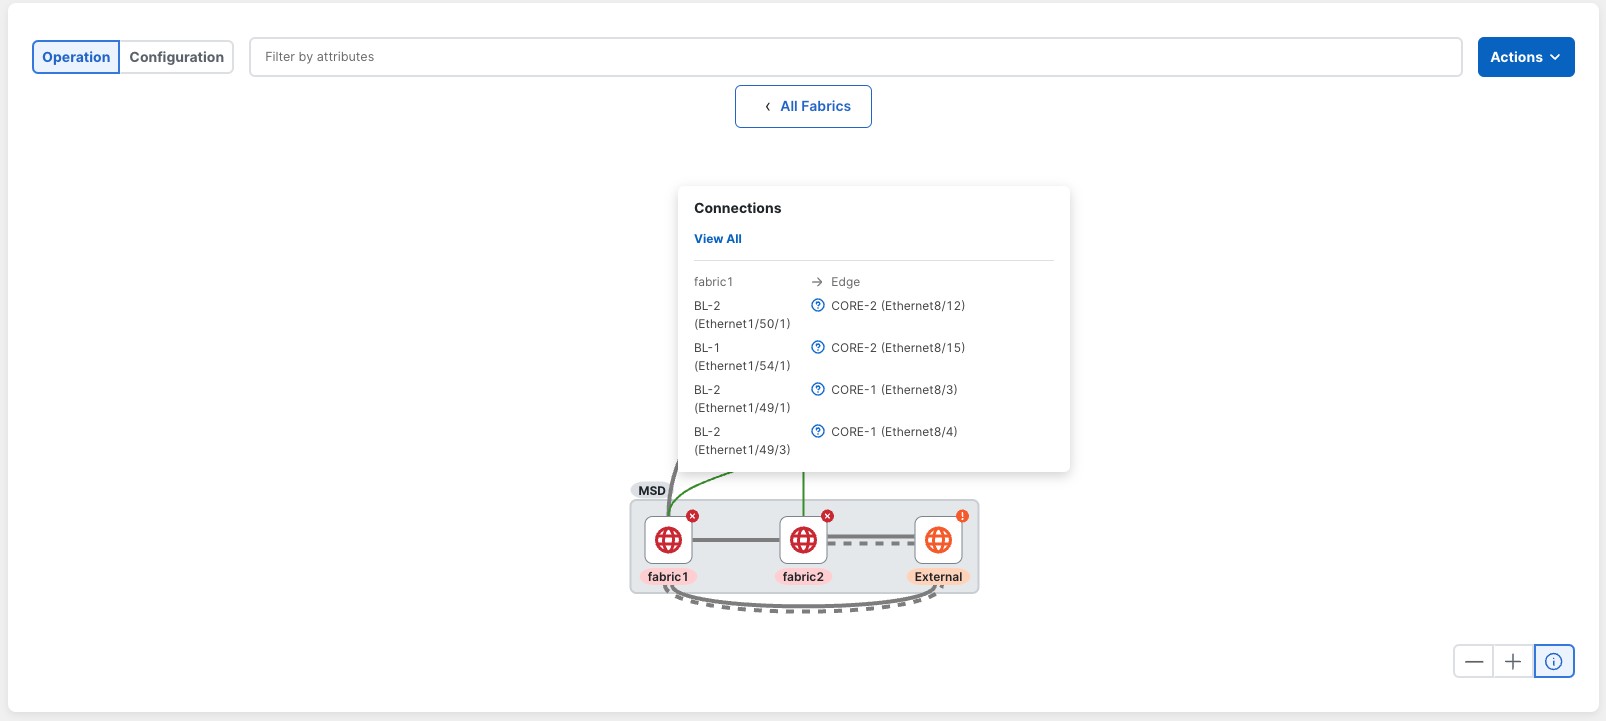
To access the actions for each of the aggregated links, click View All that is shown at the top of the depicted content. A side panel appears where all of the links are presented in a table.

If you click on the circle in a row of the table to select that element, then the Actions on the right top corner is enabled.
Navigating to a Fabric Group
A fabric group is depicted as a grey box encapsulating all of its child fabrics.
If you double-click on the grey area, a view showcasing all of its child fabrics up to switch level is opened.
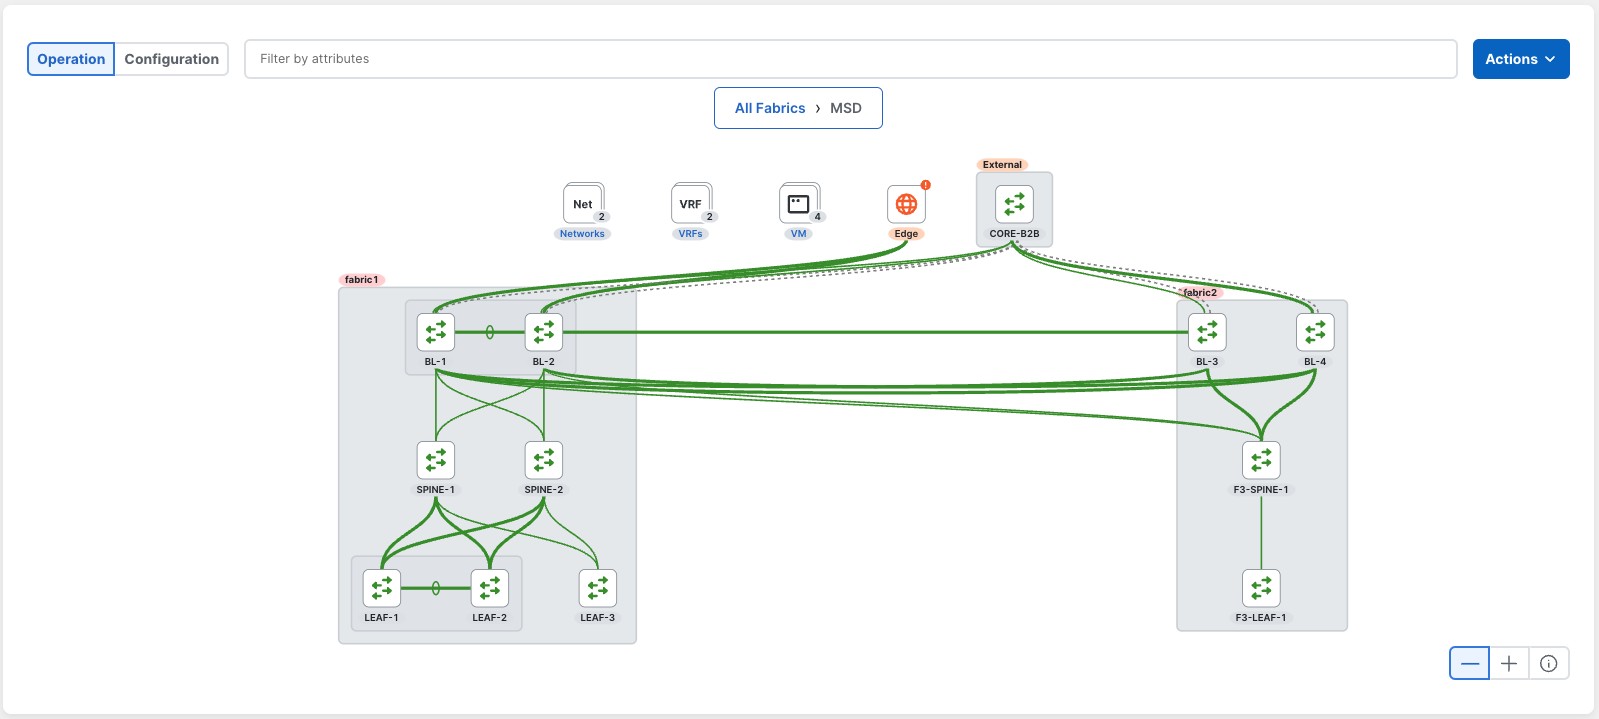
Double-click in the grey areas representing the fabric children to navigate to that fabric.
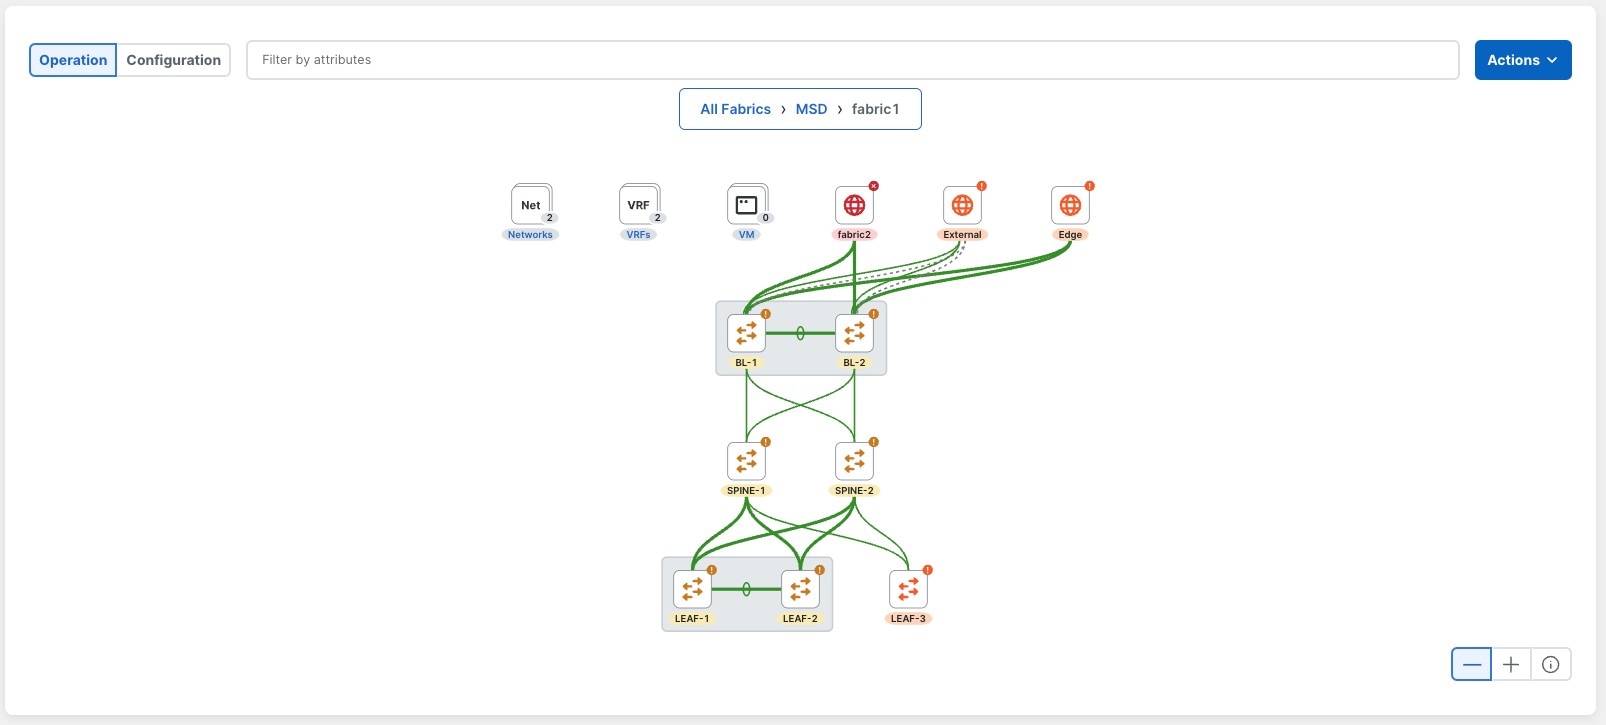
The breadcrumbs shown in the blue box in the middle top changes according to the selections made.
To go back to a previous view, single-click on any of the elements highlighted in blue.
Intra-Fabric Navigation
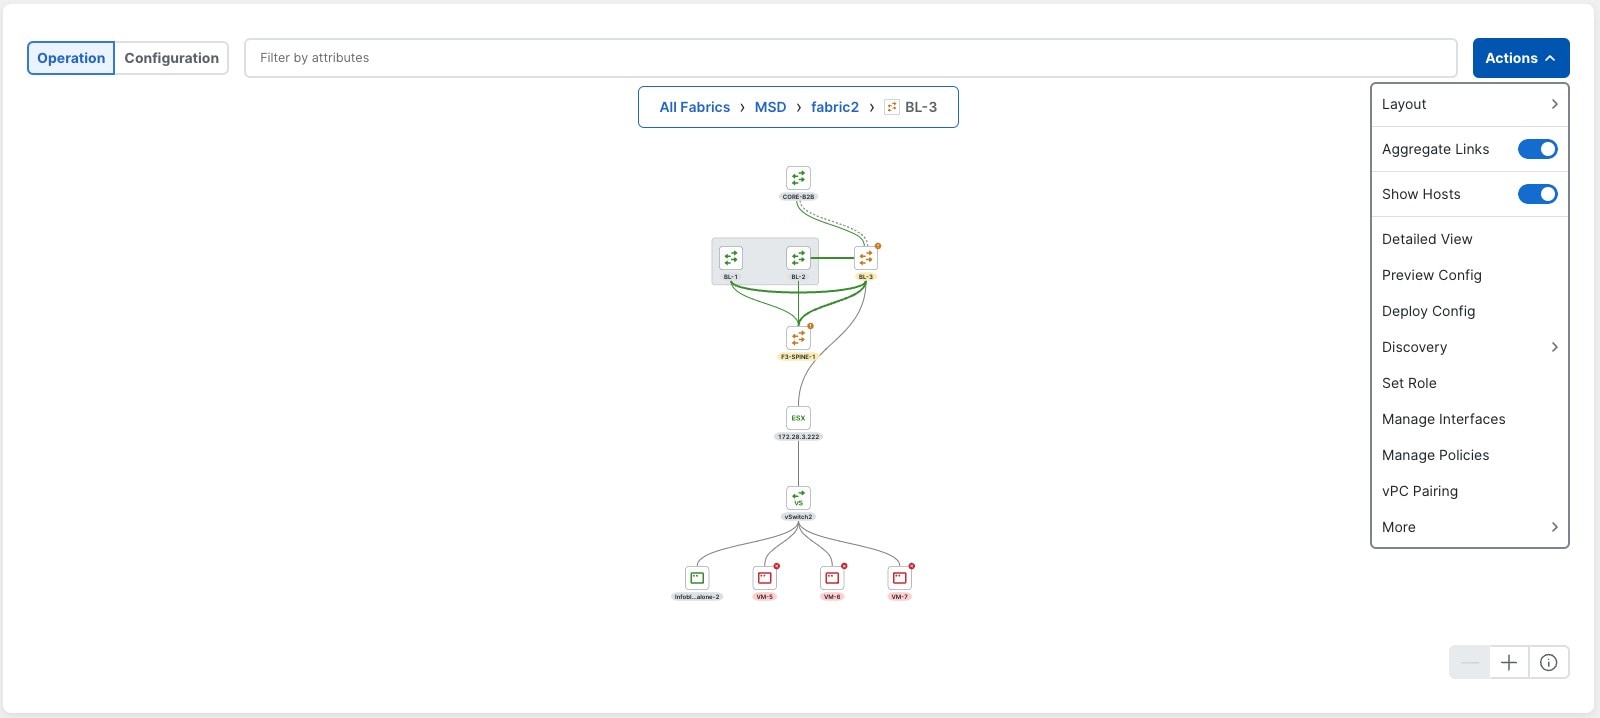
While in the All Fabrics view, you can double click on any of the nodes with a globe icon to open their topology up to the switch level.
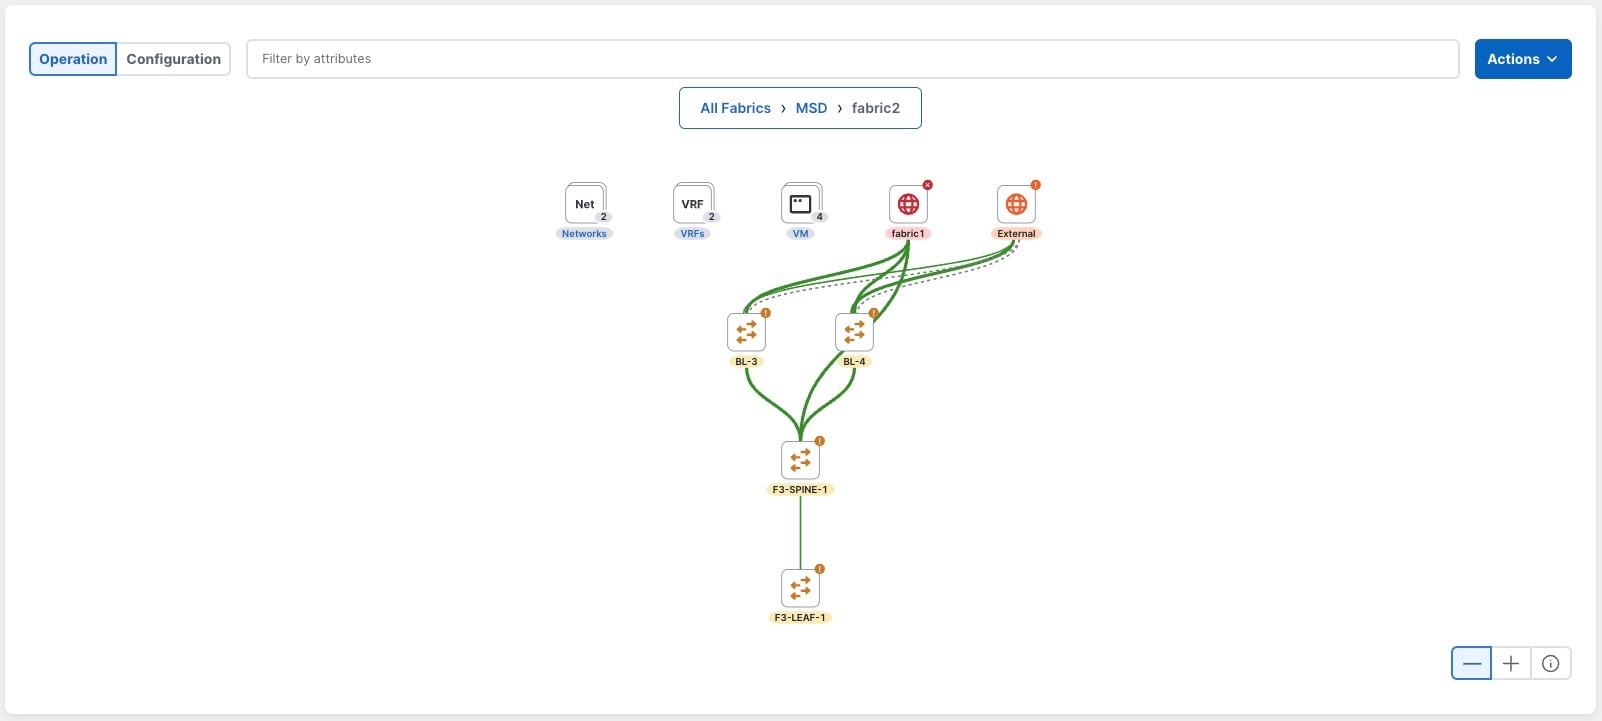
To see the topology for a given switch, double-click on any of the nodes.
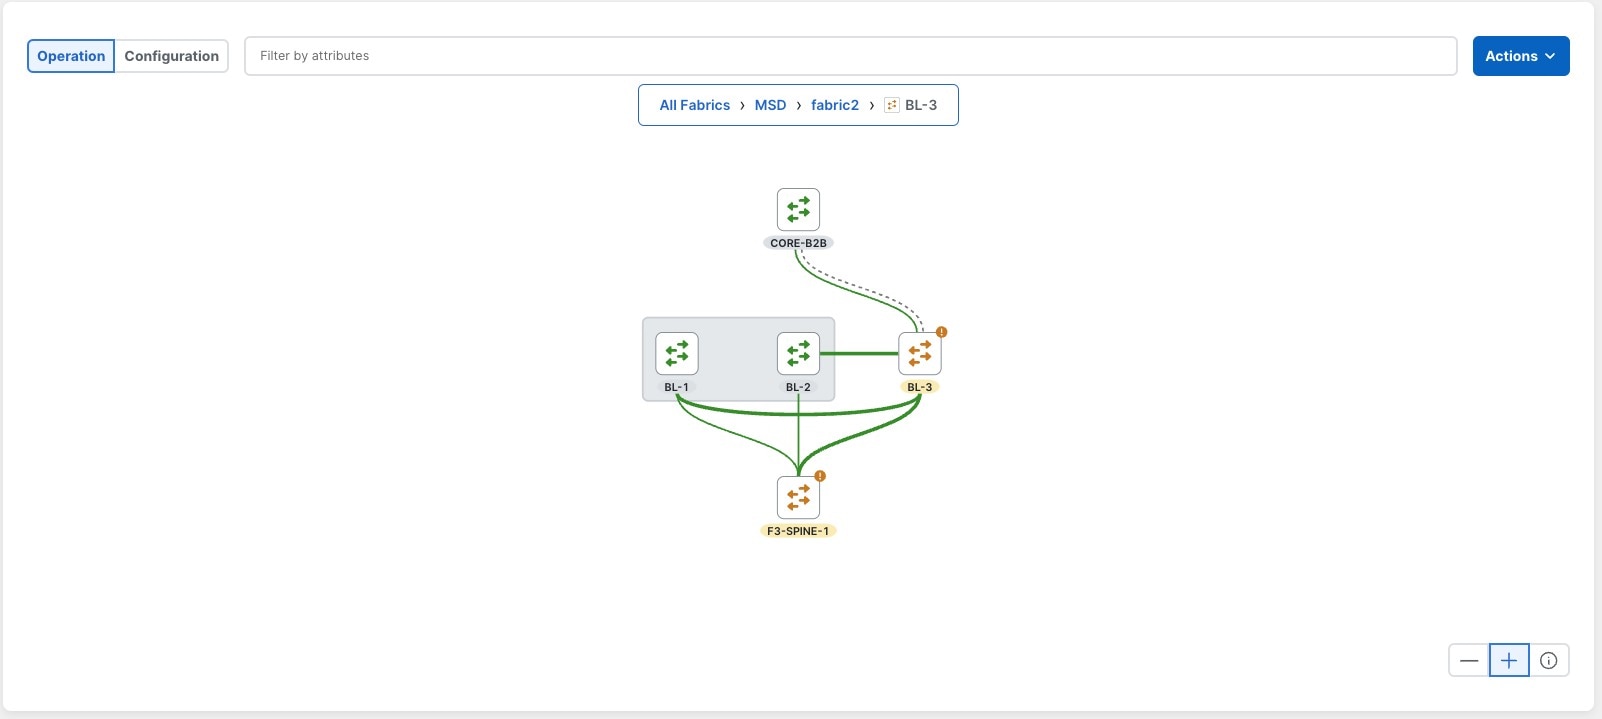
To display other connected devices in this view, click Actions, then toggle the Show Hosts option.
Overlays
Overlays are depicted as nodes with a number badge to their right that shows the total number of elements, while the text is a link that opens a side panel with the data displayed in a table.
You can open the same side panel by double-clicking on these nodes, or opening the tooltip and clicking on View All shown at the top of the section.
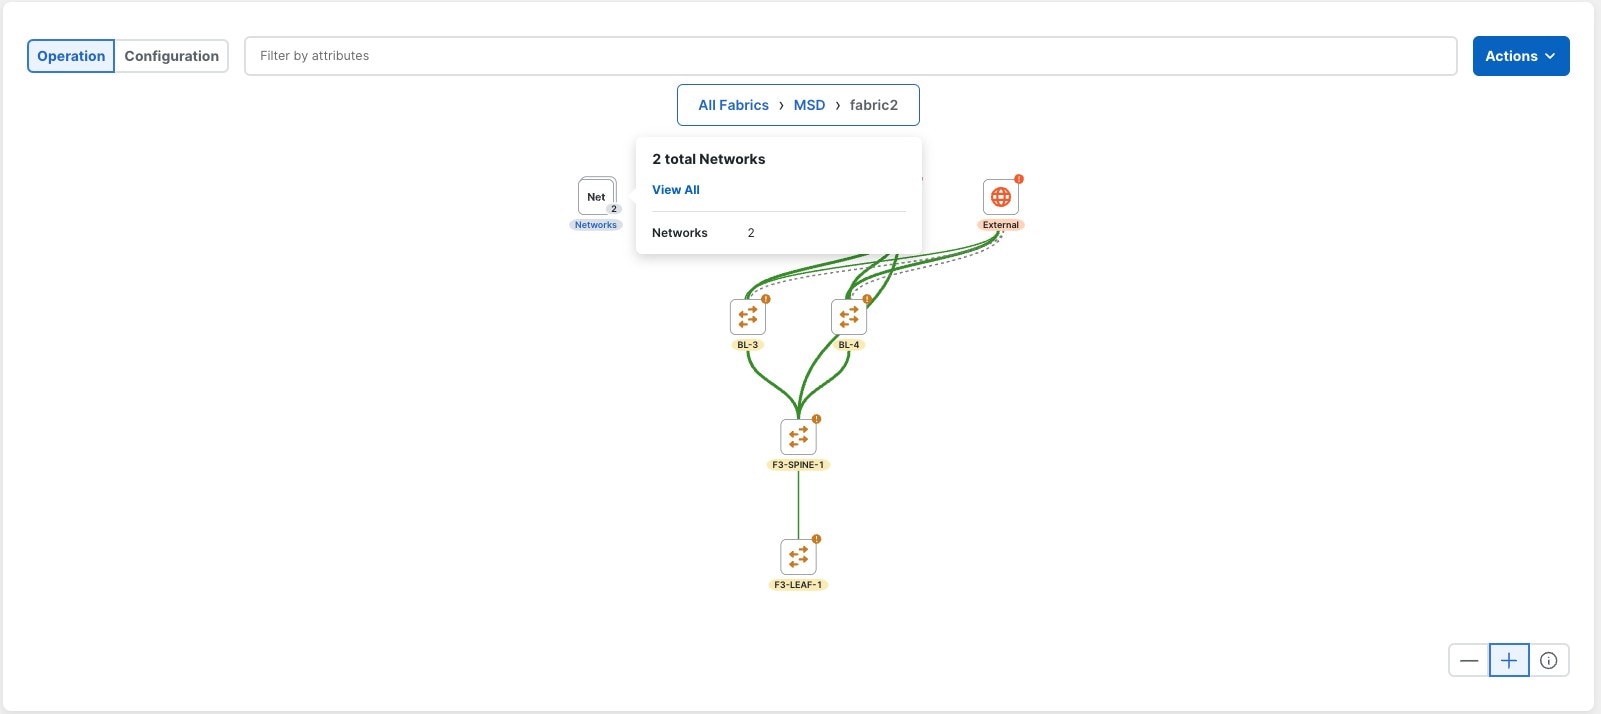
Network Overlays
To access all of the networks, click the number on the network overlay node to open the side panel. The first column displays an icon that is used to access the topology of each network.
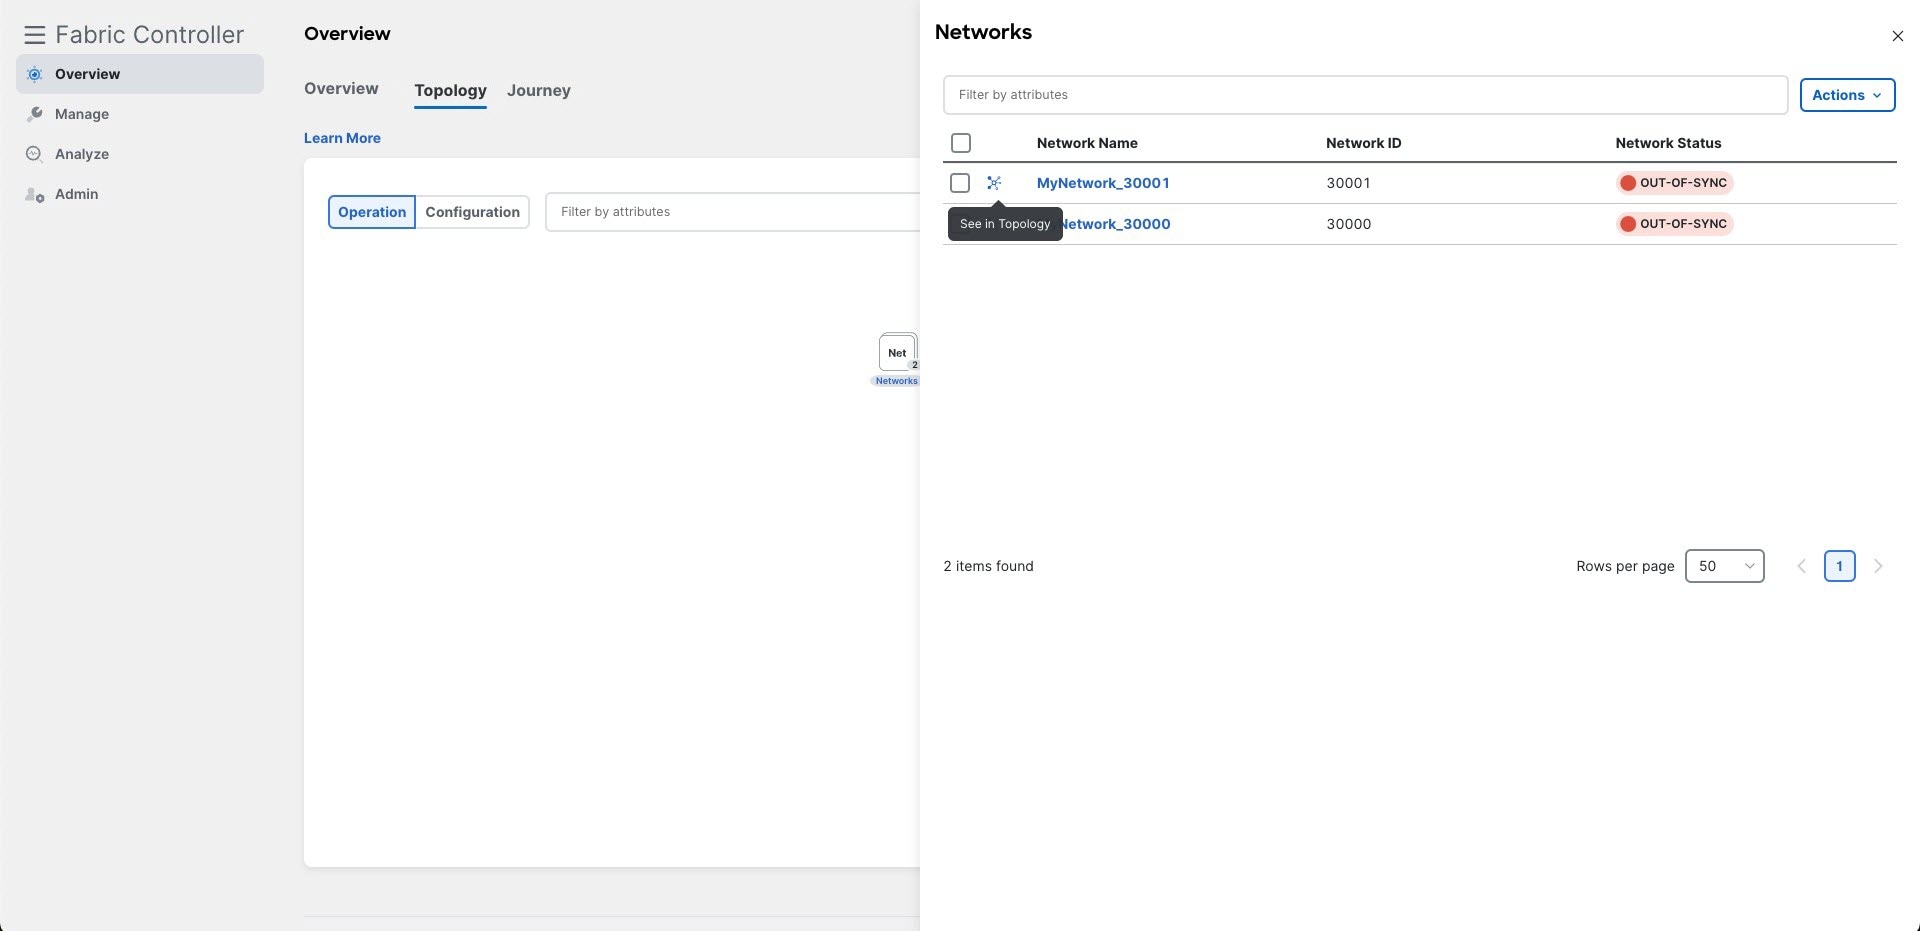
Click that icon to render the topology for this network. You are placed in the Configuration mode by default with the layout selection disabled.

VRF Overlays
To access all of the VRFs, click the number on the VRF overlay node to open the side panel. The first column displays an icon that is used to access the topology of each VRF.
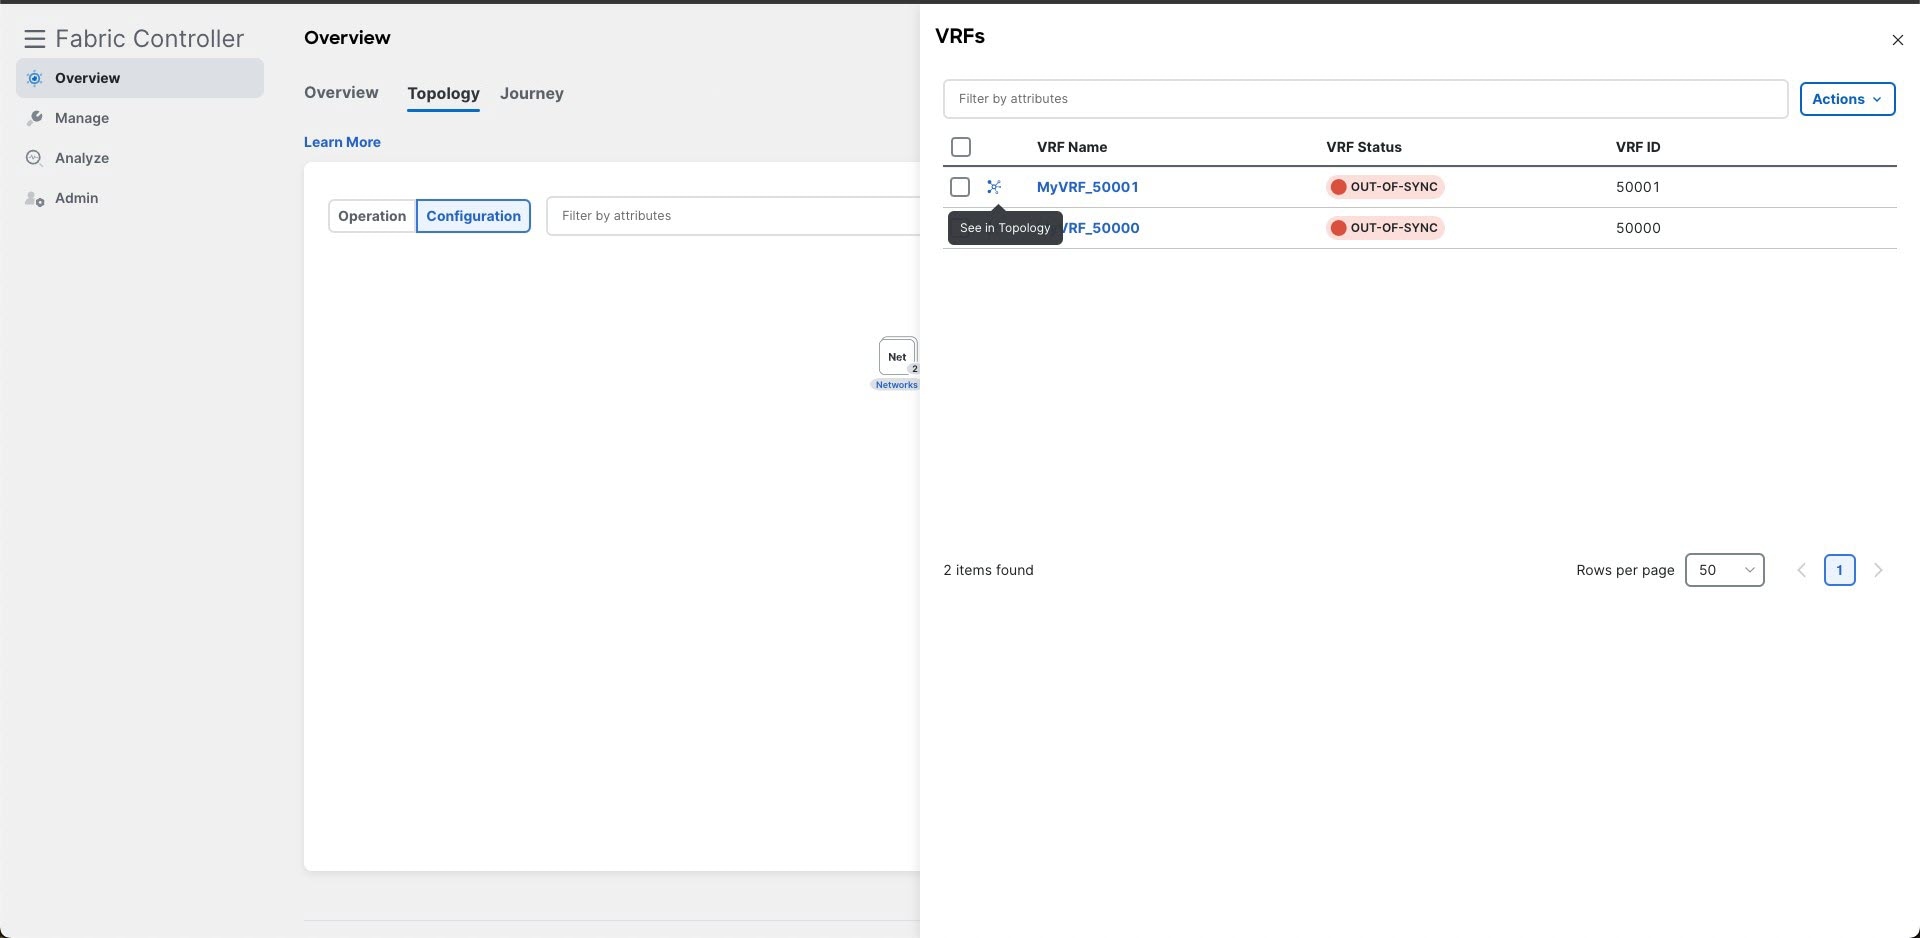
Click that icon to render the topology for this VRF. You are placed in the Configuration mode by default with the layout selection disabled.
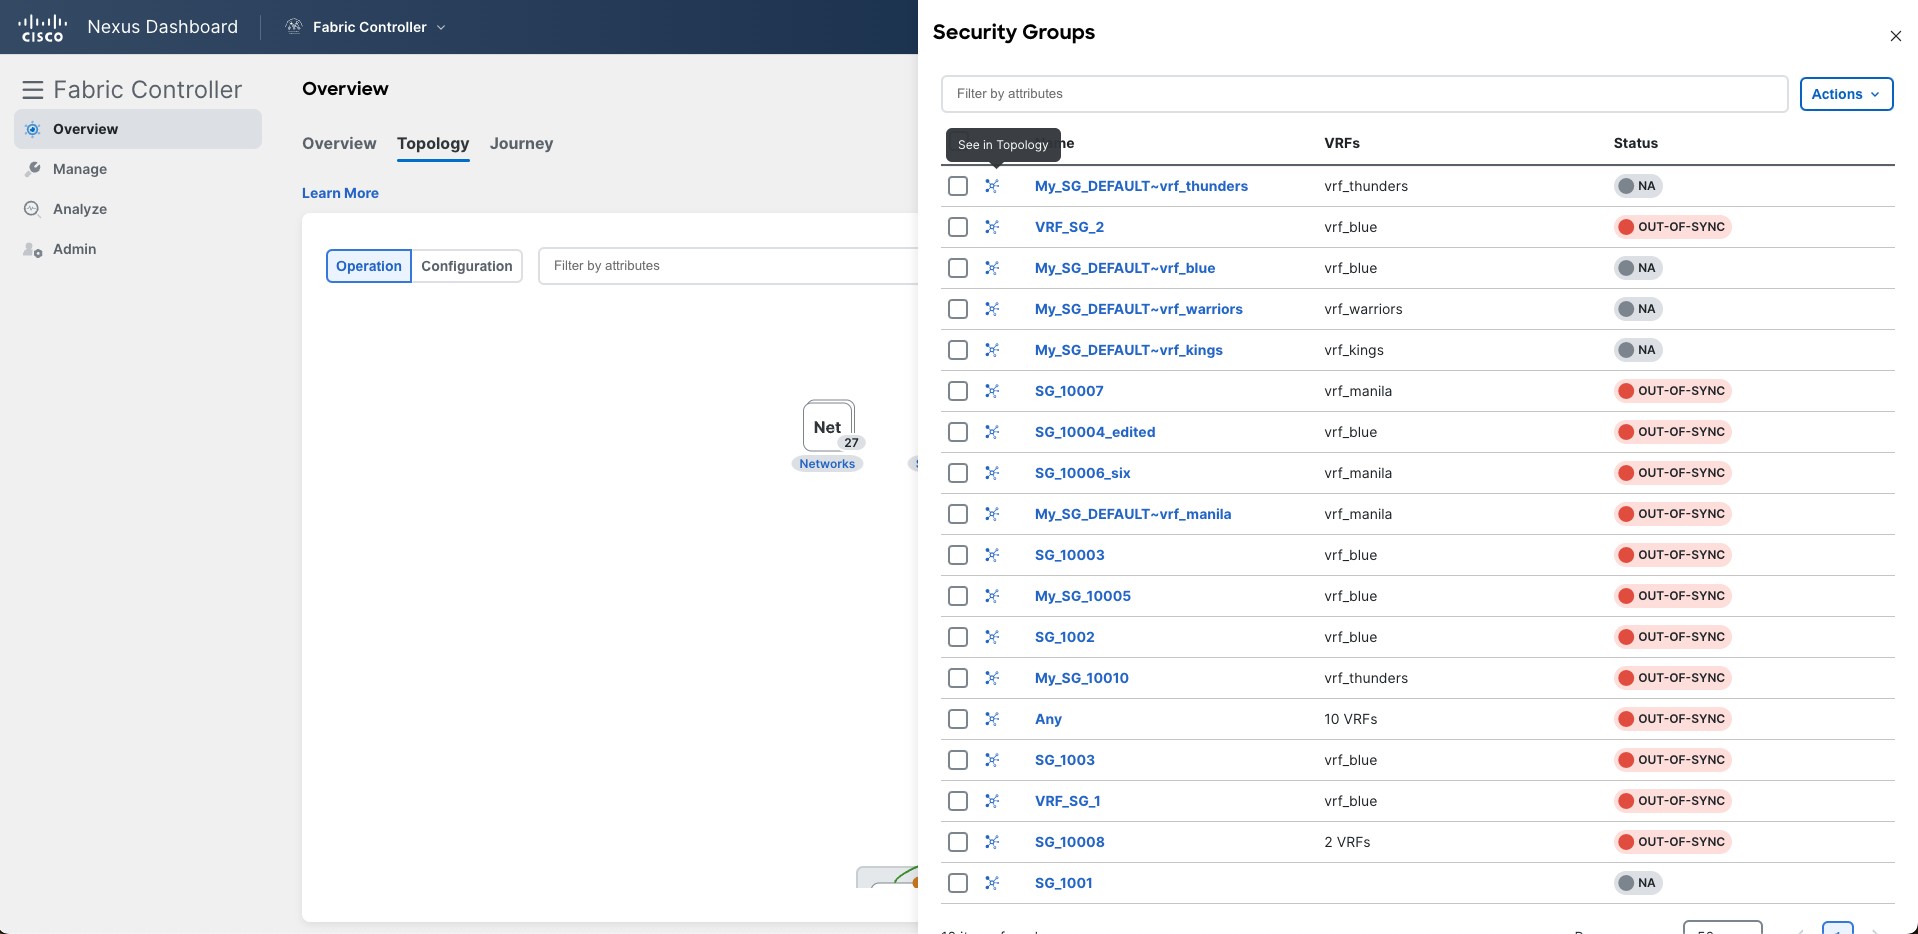
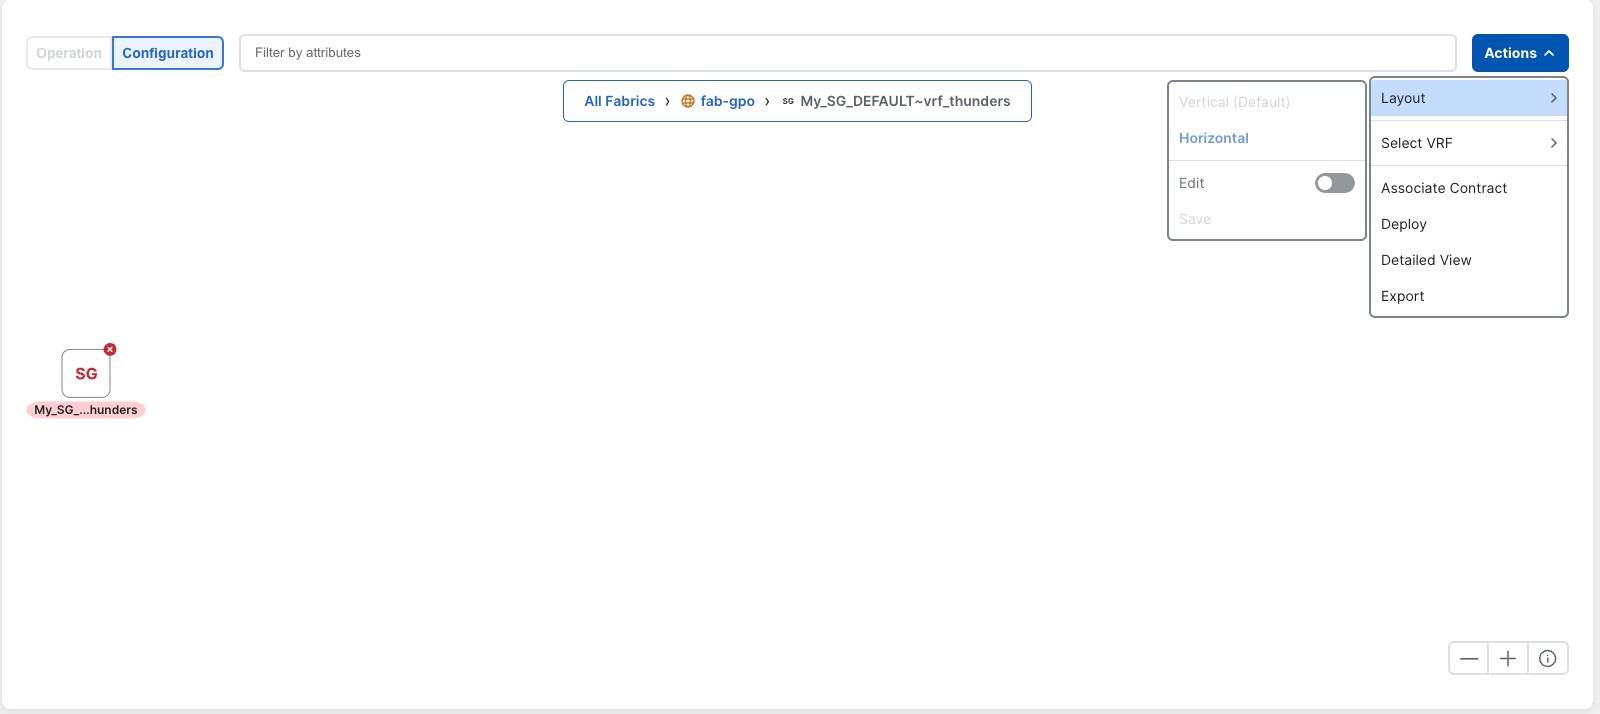
Security Group Overlays
To access all of the security groups, click the number on the security group overlay node to open the side panel. The first column displays an icon that is used to access the topology of each security group.
Click that icon to render the topology for this security group. You are placed in the Configuration mode by default with the layout selection disabled and the layout changed to horizontal.
VM Overlays
To access all of the VMs, click the number on the VM overlay node to open the side panel. The first column displays an icon that is used to access the topology of each VM.
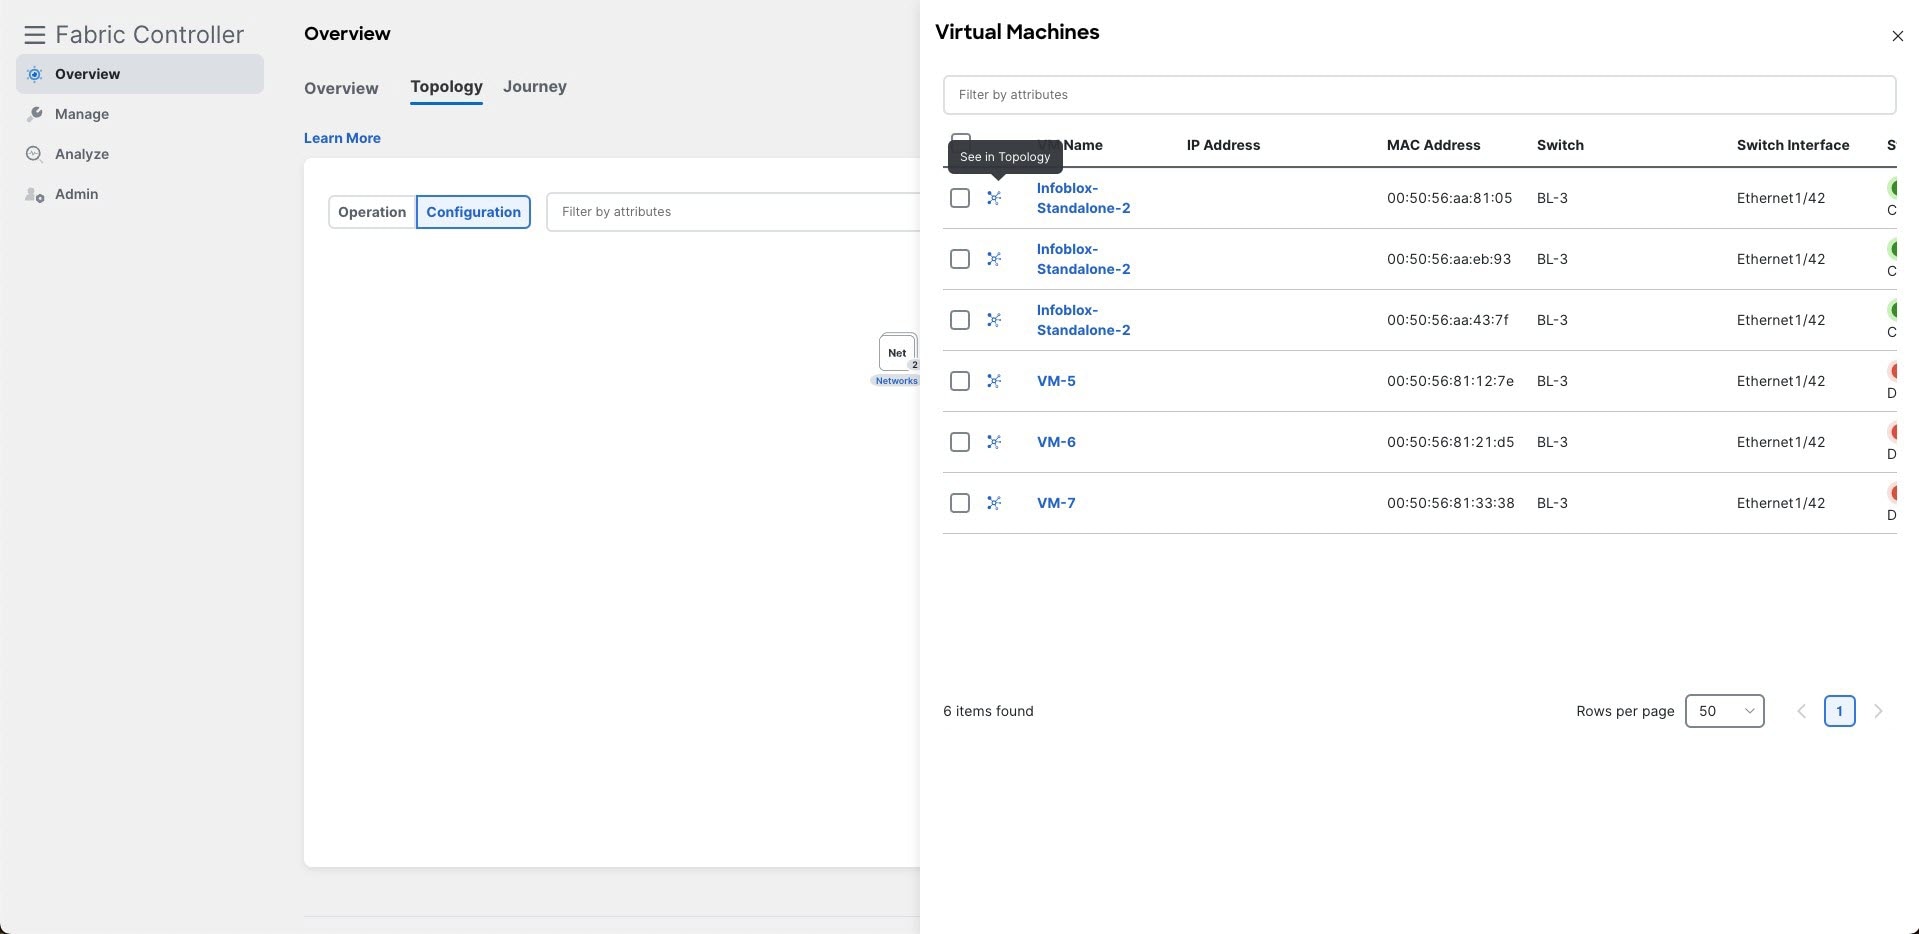
Click that icon to render the topology for this VM, with the layout selection disabled.
Multi-Node Selection
You can select multiple nodes using either of these methods:
-
By pressing ctrl as you click on each node that you want to select:
-
Or by clicking in an area, then, with the mouse still clicked, dragging the mouse across the area with the elements that you want to select:
The selected nodes will have a highlighted background.
To access actions for your selection, right-click on any of the selected elements.
Searching Topology
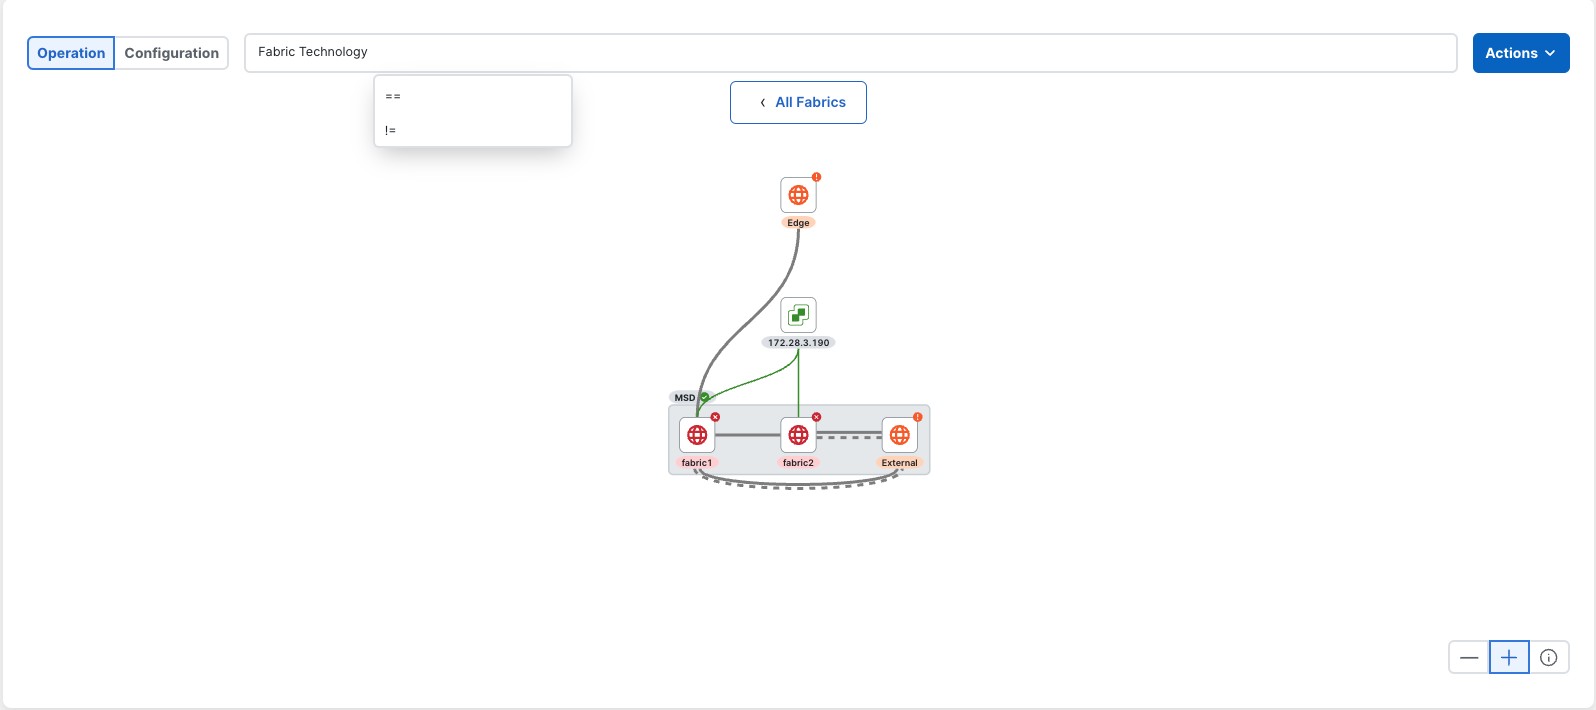
Use a combination of search attributes and search criteria in the search bar for an effective search. As you enter a combination of search attribute and search criteria in the search bar, the corresponding devices are highlighted in the topology.
You can apply the search criteria such as equals (=), does not equal (!=), contains (contains), and does not contain (!contains).
The search attributes that you can use for LAN fabrics are ASN, Fabric Type, Fabric Name, and Fabric technology. The fabric type attributes that you can use for search include switch fabric, multi-fabric domain, external, and LAN monitor. The fabric technology attributes that you can use for search include fabricpath fabric, VXLAN fabric, VLAN fabric, external, LAN classic, IPFM classic, IPFM fabric, switch group, multi-fabric domain, eBGP VXLAN fabric, eBGP routed fabric, MSO site group, meta fabric, LAN monitor fabric, and IOS-XE VXLAN fabric.
For IPFM fabrics, the following fields are available to search on: switch or hostname, switch or host IP address, switch MAC, and switch serial number. In the Generic Multicast mode, also, you can search the receiver-interface name or IP addresses in this window.
Initial Setup
The following topics provide initial setup information for the LAN operational mode in the Cisco Nexus Dashboard Fabric Controller.
Server Settings
The following topics provide initial setup information for the LAN operational mode in the Cisco Nexus Dashboard Fabric Controller.
Server Settings
You can set the parameters that are populated as default values.
To set the parameters of the Nexus Dashboard Fabric Controller server from the Cisco Nexus Dashboard Fabric Controller Web UI, perform the following steps:
-
Navigate to the Admin > System Settings page.
-
Click on the Server Settings tab.
NDFC classifies server settings by different tabs.
-
Modify the settings on any of the tabs in Server Settings based on your requirements.
-
Click Save to apply the settings.
Each microservice of an enabled feature has additional tabs and properties other than those listed below.
Each field has a short description. If there is an error when configuring any of the features in Server Settings, the corresponding tab displays in red. The Save button is disabled until you resolve those errors.
NDFC services perform comprehensive checks on the NDFC server. If there are any errors, those errors are displayed on the NDFC UI.
-
You can modify the properties in Server Settings without the support of Cisco TAC.
-
If the Nexus Dashboard is rebooted, NDFC services are down for a period of time.
Enable AAA Passthrough Feature
This feature is available in NDFC release 12.2.1. In the LAN-Fabric area in Server Settings, check the checkbox for the Enable AAA Passthrough feature to enable the authentication, authorization, and accounting (AAA) passthrough feature. When enabled, the AAA passthrough feature allows NDFC to automatically copy the NDFC user login credentials to the LAN switch credentials settings for that user. When a local user logs in, that user can set the default credentials. The local user workflow remains intact even after the local user enables the AAA passthrough feature.
NDFC maintains the LAN switch credentials settings in Admin > Switch Credentials > LAN Credentials Management > Default Credentials. When the user logs in to NDFC for the first time, NDFC does not display the message to enter the LAN switch credentials, as NDFC automatically copies the NDFC user login information to the LAN switch credentials.
You can still set per device login credentials to handle devices not using AAA. The default setting is disabled (check box is unchecked).
LAN Device Management Connectivity under Admin
You can change persistent IP addresses that are assigned for mandatory pods such as POAP-SCP and SNMP trap.
This setting determines the Persistent IPs usage for the PODs required for Nexus Dashboard Fabric Controller. When you select the Fabric Controller persona for the first time, there is a pre-check to determine if Persistent IPs are allocated on Nexus Dashboard. If Persistent IPs are not allocated, then you will see an error.
You can provide Persistent IPs in either the management network or the data network in Nexus Dashboard. Based on this selection, you must specify the option under LAN Device Management Connectivity, which can be found under Server Settings in the NDFC application page. By default, management is selected, but if you provide Persistent IPs under the Nexus Dashboard data network, then you must select Data as the option.
When you change the LAN Device Management connectivity from management to data or vice versa, some of the devices might have a SSH Unreachable critical error for a short time, but the connectivity will eventually be restored.
SMTP Host under SMTP
This setting is used as an email out-of-band notification for programmable reports and alarms.
You can receive NDFC alarms and reports through email notification. The SMTP Host address must be reachable through the Nexus Dashboard management interface. If the Nexus Dashboard management interface and SMTP Host are part of different IP subnets, then you must create a static route entry in the Nexus Dashboard Cluster configuration.
You can enter other texts for STMP fields. To initiate alarms to an external receiver, provide the IP address of the SNMP listener and the port that it is listening on.
Disable Deployment Across all Fabrics Under LAN Fabric
This setting disables deployments for all the fabrics that are defined in the NDFC instance. You will not be able to enable the deployment on a per fabric level. For example, if you have three fabrics, then all three fabrics will be disabled from the configuration point of view. You can continue to stage various configurations if necessary. Later, you can enable the deployment action by unchecking this server setting.
Collect Non-Link Physical Interfaces for LAN Switches Under PM
This setting enables collection of non-link physical information for LAN switches. Enable this checkbox when you want to view information for physical interfaces on LAN switches that are connected to non-NDFC managed devices. The default is not enabled.
Collect Temperature for LAN Switches Under PM
This setting enables NDFC to collect switch temperate details and show it in the Fabric Overview and the Metric areas. By, the default temperature data is not collected. After you enable this setting, you can view the temperature information of the fabric switches as well.
Feature Management
In Cisco DCNM Release 11.x, you must choose the install mode while installing the DCNM. From Release 12.0.1a, Cisco Nexus Dashboard Fabric Controller allows you to install the service on the Nexus Dashboard. After you launch the Nexus Dashboard Fabric Controller UI, you will see three different Install modes on the Feature Management page.
Nexus Dashboard Fabric Controller 12 allows you to dynamically enable the feature set and scale applications. Choose Admin > System Settings > Feature Management to choose the installer type and enable or disable few features on the selected deployment.
When you launch Nexus Dashboard Fabric Controller for the first time from Cisco Nexus Dashboard, the Feature Management screen appears. You can perform only Backup and Restore operations before you choose the feature set.
On the Feature Management page, you can choose one of the following install modes:
-
Fabric Discovery
-
Fabric Controller
-
SAN Controller
After you select a Feature Set, from the next login, Dashboard page opens when you launch Cisco Nexus Dashboard Fabric Controller from Nexus Dashboard.
Choosing Feature Set
When you launch Cisco Nexus Dashboard Fabric Controller 12 for the first time, none of the feature set is enabled. During this state, you can perform Backup and Restore to restore the DCNM 11.5(x) data on Nexus Dashboard Fabric Controller 12. Nexus Dashboard Fabric Controller will read the data from the backup file and select the installer type accordingly.
To deploy feature-set from Cisco Nexus Dashboard Fabric Controller Web UI perform the following steps:
-
Choose Admin > System Settings > Feature Management.
-
Select a persona to view the default set of features.
For information about the features available in Cisco NDFC personas, see Features with each Persona.
-
In the table below, select the check box against the feature name available with the feature set.
-
Click Apply.
The feature-set will be deployed. The selected applications will be enabled. A message appears that the feature set is installed, and you must refresh to take effect.
-
Refresh the browser to deploy Nexus Dashboard Fabric Controller with the selected feature set and applications.
The left pane shows the features supported specifically with the deployed feature set.
Features with each Persona
|
Feature Name |
Description |
|
Kubernetes Visualizer |
Network Visualization of K8s Clusters |
|
Endpoint Locator |
Tracking Endpoint IP-MAC Location with Historical Information |
|
IPAM Integration |
Integration with IP Address Management (IPAM) Systems |
|
Openstack Visualizer |
Network Visualization of Openstack Clusters |
|
Performance Monitoring |
Monitor Environment and Interface Statistics |
|
IP Fabric for Media |
Media Controller for IP Fabrics |
|
PTP Monitoring |
Monitor Precision Timing Protocol (PTP) Statistics |
|
VMM Visualizer |
Network visualization of Virtual Machines |
|
Fabric Builder |
Easy Fabric Functionality for NX-OS and Other devices |
After enabling this feature, reload to view left pane Virtual Management > Virtual Infrastructure Manager. This feature allows you to visualize Kubernetes cluster as Container Orchestrator with the Cisco NDFC. See the "Kubernetes Cluster" section in Virtual Infrastructure Manager for more information.
This feature allows real-time tracking of endpoints within a data center. The tracking includes tracing the network life history of an endpoint and getting insights into the trends that are associated with endpoint additions, removals, moves, and so on. See the "Monitoring Endpoint Locator" section in Endpoint Locator for more information.
IPAM Integrator allows read-only access to the IPAM and NDFC servers. See IPAM Integrator for more information.
Ensure that the vCenter cluster or Kubernetes cluster feature must be enabled to add an OpenStack cluster. See the "OpenStack Cluster" section in Virtual Infrastructure Manager
This feature is supported for IPFM fabrics. Enabling performance monitoring will monitor the performance of fabric. See IPFM Fabrics for more information.
You can enable this feature to configure fabrics related to IP Fabric for Media (IPFM). See IPFM Fabrics for more information.
You can either enable Fabric builder or IP Fabric for Media feature on NDFC. Enabling both features on single NDFC is not supported, it displays error message Features Fabric Builder and IP Fabric for Media are mutually exclusive. Please select only one at a time
PTP is a time synchronization protocol for nodes that are distributed across a network. On a local area network, it achieves clock accuracy in the sub-nanosecond range, making it suitable for measurement and control systems. See the "PTP Monitoring" section in About Switch Overview for LAN Operational Mode Setups for more information.
Enable this feature to configure network visualization of Virtual Machines on fabrics. See Virtual Infrastructure Manager for more information.
To configure fabrics and functionalities for NX-OS and other devices, enable this feature. See Understanding LAN Fabrics for more information.
If you are using a Virtual Nexus Dashboard Cluster before you begin, ensure that the Persistent IP address and required settings are enabled.
Changing across Feature-Set
Nexus Dashboard Fabric Controller 12 allows you to switch from one feature set to another. Choose Admin > System Settings > Feature Management. Select the desired feature set and applications in the table below. Click Save & Continue. Refresh the browser to begin using Cisco Nexus Dashboard Fabric Controller with the new feature set and applications.
There are a few features/applications supported with specific deployments. When you change the feature set, some of these features are not supported in the new deployment. The following table provides details about the pre-requisites and criteria based on which you can change the feature set.
|
From/To |
Fabric Discovery |
Fabric Controller |
SAN Controller |
|
Fabric Discovery |
- |
Only monitor mode fabric is supported in Fabric Discovery deployment. When you change the feature set, the fabric can be used in the Fabric Controller deployment. |
Not supported |
|
Fabric Controller |
You must delete the existing fabrics before changing the fabric set. |
If you’re changing from Easy Fabric to IPFM fabric application, you must delete the exiting fabrics. |
Not supported |
|
SAN Controller |
Not supported |
Not supported |
- |
LAN Credentials Management
While changing the device configuration, Cisco Nexus Dashboard Fabric Controller uses the device credentials provided by you. However, if you do not provide the LAN switch credentials, Cisco Nexus Dashboard Fabric Controller prompts you to open the Admin > Switch Credentials > LAN Credentials Management page to configure the LAN credentials.
Cisco Nexus Dashboard Fabric Controller uses two sets of credentials to connect to the LAN devices:
-
Discovery Credentials
Cisco Nexus Dashboard Fabric Controller uses these credentials during discovery and periodic polling of the devices.
NDFC uses discovery credentials with SSH and SNMPv3 to discover the hardware or software inventory from the switches. You can discover one inventory per switch. These discovery credentials are read-only and you cannot make configuration changes on the switches.
-
Configuration Change Credentials
Cisco Nexus Dashboard Fabric Controller uses these credentials when a user changes the device configuration.
LAN Credentials
You can use the write option on the LAN credentials page to do configuration changes on the switch. One credential is allowed per user for a single switch. A user role must access NDFC to use the write option for the switches to push configurations on it through an SSH connection.
For a user role created on NX-OS switches, an SNMPv3 user is created with the same password. Ensure that the SSH and SNMPv3 credentials match for the discovery of the credentials. If SNMP authentication fails, discovery of credentials stops displaying an error message. If SNMP authentication succeeds and SSH authentication fails, discovery of credentials continues, and the switch status displays a warning message for the SSH error.
If the user role created on the NX-OS switches uses AAA authentication, the SNMPv3 user is not created. Using this AAA authentication to discover or import a switch in NDFC, the controller detects that the local SNMPv3 user is not created on the switch. NDFC runs the exec command on the switch to create an SNMPv3 user with the same password on the switch. The SNMPv3 user role is temporary. Once the user role expires, the continual discovery of switches from NDFC creates the SNMPv3 user.
LAN credentials management allows you to specify configuration-change credentials. Before changing any LAN switch configuration, you must enter the LAN credentials for the switch. If you do not provide the credentials, the configuration change action is rejected.
These features get the device-write credentials from the LAN credentials feature.
-
Upgrade (ISSU)
-
Maintenance mode (GIR)
-
Patch (SMU)
-
Template deployment
-
POAP-write erase reload, rollback
-
Interface creation, deletion, or configuration
-
VLAN creation, deletion, or configuration
-
VPC wizard
You must specify the configuration-change credentials irrespective of whether the devices were discovered initially or not. This is a one-time operation. After the credentials are set, the credentials are used for any configuration-change operation.
Default Credentials
You use default credentials to connect all the devices that the user has access to. You can override the default credentials by specifying credentials for each of the devices in the Devices table.
Cisco Nexus Dashboard Fabric Controller tries to use individual switch credentials in the devices, to begin with. If the credentials (username/password) columns are empty in the devices, the default credentials are used.
Switch Table
The Devices table lists all the LAN switches that the user has access to. You can specify the switch credentials individually, which will override the default credentials. In most cases, you need to provide only the default credentials.
The LAN credentials for the Nexus Dashboard Fabric Controller Devices table has the following fields.
|
Field |
Description |
|
Device Name |
Displays the switch name. |
|
IP Address |
Specifies the IP address of the switch. |
|
Credentials |
Specifies whether the default or switch-specific custom credentials are used. |
|
Username |
Specifies the username that Nexus Dashboard Fabric Controller uses to login. |
|
Fabric |
Displays the fabric to which the switch belongs. |
The following table describes the action items, in the Actions menu drop-down list, that appear on the LAN Credentials Management page.
|
Action Item |
Description |
|
Edit |
Choose a device name and click Edit. Specify a username and password. You can edit local or custom- specific credentials. |
|
Clear |
Choose a device name and click Clear. A confirmation dialog box appears. Click Yes to clear the switch credentials from the NDFC server. |
|
Validate |
Choose a device name and click Validate. A confirmation message appears, indicating if the operation was successful or a failure. |
Robot Credentials
When you specify default credentials, you can enable the robot feature, enabling the robot flag.
The robot role is similar to an earlier role in DCNM. The robot user role helps with switch and device accounting. You can track all the changes done on NDFC with a general user account. If the user role changes on NDFC that impacts the change on the device, this is termed an out-of-band change. These changes are logged on the device as the changes made by a general user account. Therefore, you can track and distinguish between out-of-band changes and changes made on the device. This general user account is termed as a robot user role for the changes logged on the device.
For example, a user role of network-admin on NDFC has access to enter LAN device credentials to push configurations on the switches. With the network-admin user role, you can check the robot flag while creating the LAN credentials.
The username for the LAN credentials is displayed as a change logged on the device. If a username for the LAN credentials is changed to a controller and the robot flag is checked, the credentials for the device changes from default to robot. This user role pushes configurations on the switches in NDFC. These changes are logged in the History tab of the fabric as the changes made by the network-admin user role. The account log on the switch displays as the controller. The appropriate user-role details are logged on NDFC and the device.
In NDFC, the robot user role is considered the admin role for all the fabrics and the devices. If the default credential is not set on a fabric, you can use the robot user role, if it is set for different devices. If another user role with write access logs in to NDFC, this user role is not prompted to update the credentials as the robot user role is already set. The credentials are set in the following order: individual switch, robot, and then the default credentials.
On the Admin > Switch Credentials > LAN Credentials Management page, you can choose to either use default credentials or robot credentials while changing device configurations, unless you set custom credentials.
To set the default credentials, perform the following steps:
-
Choose the required Device Name and click Set.
The Set credentials dialog box appears.
-
Enter the appropriate details.
-
Choose the Robot checkbox to set the robot credentials.
You can choose the appropriate roles to push configurations to devices without adding device credentials.
If you enable the Enable AAA Passthrough feature, you cannot set the robot flag.
-
Click Save to apply the settings.
-
On the Admin > Switch Credentials > LAN Credentials Management > Default Credentials page, choose the required Device Name and click Clear.
A confirmation message appears.
-
Click Yes to clear the default device credentials.
Copyright
THE SPECIFICATIONS AND INFORMATION REGARDING THE PRODUCTS IN THIS MANUAL ARE SUBJECT TO CHANGE WITHOUT NOTICE. ALL STATEMENTS, INFORMATION, AND RECOMMENDATIONS IN THIS MANUAL ARE BELIEVED TO BE ACCURATE BUT ARE PRESENTED WITHOUT WARRANTY OF ANY KIND, EXPRESS OR IMPLIED. USERS MUST TAKE FULL RESPONSIBILITY FOR THEIR APPLICATION OF ANY PRODUCTS.
THE SOFTWARE LICENSE AND LIMITED WARRANTY FOR THE ACCOMPANYING PRODUCT ARE SET FORTH IN THE INFORMATION PACKET THAT SHIPPED WITH THE PRODUCT AND ARE INCORPORATED HEREIN BY THIS REFERENCE. IF YOU ARE UNABLE TO LOCATE THE SOFTWARE LICENSE OR LIMITED WARRANTY, CONTACT YOUR CISCO REPRESENTATIVE FOR A COPY.
The Cisco implementation of TCP header compression is an adaptation of a program developed by the University of California, Berkeley (UCB) as part of UCB’s public domain version of the UNIX operating system. All rights reserved. Copyright © 1981, Regents of the University of California.
NOTWITHSTANDING ANY OTHER WARRANTY HEREIN, ALL DOCUMENT FILES AND SOFTWARE OF THESE SUPPLIERS ARE PROVIDED “AS IS" WITH ALL FAULTS. CISCO AND THE ABOVE-NAMED SUPPLIERS DISCLAIM ALL WARRANTIES, EXPRESSED OR IMPLIED, INCLUDING, WITHOUT LIMITATION, THOSE OF MERCHANTABILITY, FITNESS FOR A PARTICULAR PURPOSE AND NONINFRINGEMENT OR ARISING FROM A COURSE OF DEALING, USAGE, OR TRADE PRACTICE.
IN NO EVENT SHALL CISCO OR ITS SUPPLIERS BE LIABLE FOR ANY INDIRECT, SPECIAL, CONSEQUENTIAL, OR INCIDENTAL DAMAGES, INCLUDING, WITHOUT LIMITATION, LOST PROFITS OR LOSS OR DAMAGE TO DATA ARISING OUT OF THE USE OR INABILITY TO USE THIS MANUAL, EVEN IF CISCO OR ITS SUPPLIERS HAVE BEEN ADVISED OF THE POSSIBILITY OF SUCH DAMAGES.
Any Internet Protocol (IP) addresses and phone numbers used in this document are not intended to be actual addresses and phone numbers. Any examples, command display output, network topology diagrams, and other figures included in the document are shown for illustrative purposes only. Any use of actual IP addresses or phone numbers in illustrative content is unintentional and coincidental.
The documentation set for this product strives to use bias-free language. For the purposes of this documentation set, bias-free is defined as language that does not imply discrimination based on age, disability, gender, racial identity, ethnic identity, sexual orientation, socioeconomic status, and intersectionality. Exceptions may be present in the documentation due to language that is hardcoded in the user interfaces of the product software, language used based on RFP documentation, or language that is used by a referenced third-party product.
Cisco and the Cisco logo are trademarks or registered trademarks of Cisco and/or its affiliates in the U.S. and other countries. To view a list of Cisco trademarks, go to this URL: http://www.cisco.com/go/trademarks. Third-party trademarks mentioned are the property of their respective owners. The use of the word partner does not imply a partnership relationship between Cisco and any other company. (1110R)
© 2017-2024 Cisco Systems, Inc. All rights reserved.