
New and Changed Information
The following table provides an overview of the significant changes up to this current release. The table does not provide an exhaustive list of all changes or of the new features up to this release.
| Release Version | Feature | Description |
|---|---|---|
|
NDFC release 12.2.2 |
One Manage feature is now available |
Beginning with NDFC release 12.2.2, the One Manage feature is available to provide the following functionality:
|
|
NDFC release 12.2.2 |
Support for IPFM fabrics in One Manage Dashboard |
With this release, IPFM fabrics are supported for One Manage Dashboard. For more information, see Viewing the Details. |
Creating and Managing Multi-Cluster Fabrics Using One Manage
Multi-Site Domains and Multi-Cluster Fabrics
The following terms are used throughout this article and are defined as follows:
-
Multi-site domain: Refers to a multi-site fabric that is created in a local NDFC cluster. Fabrics are added to a multi-site domain at the local NDFC cluster level. This term was in use prior to the One Manage feature that is introduced in NDFC release 12.2.2.
-
Multi-cluster fabric: Refers to a multi-site fabric that is created at the One Manage level. Fabrics, including multi-site domains, are added to a multi-cluster fabric at the local One Manage cluster level. This term is new as part of the One Manage feature that is introduced in NDFC release 12.2.2.
How One Manage Allows You to Create and Manage Multi-Cluster Fabrics
One Manage provides a single point to manage fabric groups and multi-site groups spanning across multiple NDFC clusters in a multi-cluster environment.
The One Manage feature introduced in NDFC 12.2.2 builds on existing multi-cluster functionality that has been available in Nexus Dashboard beginning with ND release 2.1, where Nexus Dashboard allows you to establish connectivity between multiple Nexus Dashboard clusters for a single pane of glass cluster administration, as well as access to any of the sites and services running on any of the connected clusters. For more information, see Multi-Cluster Connectivity in the Nexus Dashboard User Guide.
The following functionality is supported with the One Manage feature:
Aggregated Topology View of NDFC Multi-Cluster Fabrics
The One Manage topology view allows you to see inter-fabric connections within an NDFC controller as well as across NDFC clusters. You can also drill down to an individual fabric within a controller instance from this topology view, displaying behavior that is identical to a topology view for a single fabric as it currently exists. Note that you cannot make configuration changes in the topology view. For more information, see Monitoring Multi-Cluster Fabrics Using One Manage Dashboard.
Creation of VXLAN EVPN Multi-Site Domains for Fabrics Belonging to Different NDFC Clusters
You can create multi-cluster fabrics using One Manage, where you can add member fabrics from any NDFC that is part of a multi-cluster fabric and perform the multi-site operations that you would normally perform from a regular LAN fabric MSD. With this functionality, you can also import an existing MSD from any NDFC and then connect it to other VXLAN EVPN fabrics from the multi-cluster fabric.
When you click Recalculate & Deploy after creating a multi-site fabric using One Manage, if the auto-deployment settings are selected, the multi-site underlay connectivity is configured automatically between the border gateways and the core routers based on the CDP neighborships of the devices, and the multi-site overlay EVPN peering is configured between the border gateways, or between the border gateways and the route server, based on the type of overlay connectivity selected.
Guidelines and Limitations for One Manage
-
Interface, Policy, Policy History and Events that are available in a regular LAN fabric MSD are not available when you configure a multi-cluster MSD through One Manage. You must go to the individual fabric to perform operations related to Interface and Policy related operations in this case.
-
Change control is not supported with One Manage.
-
IPv6 underlay is not supported with One Manage.
-
Security groups are not supported with One Manage.
-
MSD operations are not permitted if the primary cluster is down.
-
If you use One Manage to manage Multi-Site fabrics, the following items will be disabled at the LAN fabric MSD level:
-
Adding and removing member fabrics
-
Adding and removing link operations
-
Creating and deleting VRFs and networks
-
-
Two NDFC controller instances can have fabrics with the same fabric name because the identity of each fabric is shown as controller-name + fabric-name. However, you cannot use the same name for different clusters within a multi-cluster fabric.
-
If you attempt to form a multi-cluster fabric using One Manage but one or more of the clusters is running on a release prior to NDFC release 12.2.2, you will see a message saying that those clusters should be upgraded to the latest release before you can use using One Manage to form a multi-cluster fabric.
-
With regards to NDFC API calls, you can reach the primary cluster by prefixing any API path with onemanage/{existing-api-path}.
Prerequisites Before Using One Manage
If you have upgraded from a previous release to ND release 3.2.1/NDFC release 12.2.2 and the corresponding ND clusters were already federated, prior to using One Manage, you must perform the following steps on the primary cluster:
-
Disconnect all the secondary clusters from multi-cluster connectivity.
-
Delete the federation, which also disconnects the primary cluster from multi-cluster connectivity.
-
Connect all the secondary clusters back to the primary cluster to form multi-cluster connectivity.
For those procedures, see the "Multi-Cluster Connectivity" section in Nexus Dashboard Infrastructure Management.
Navigate to the One Manage Page
-
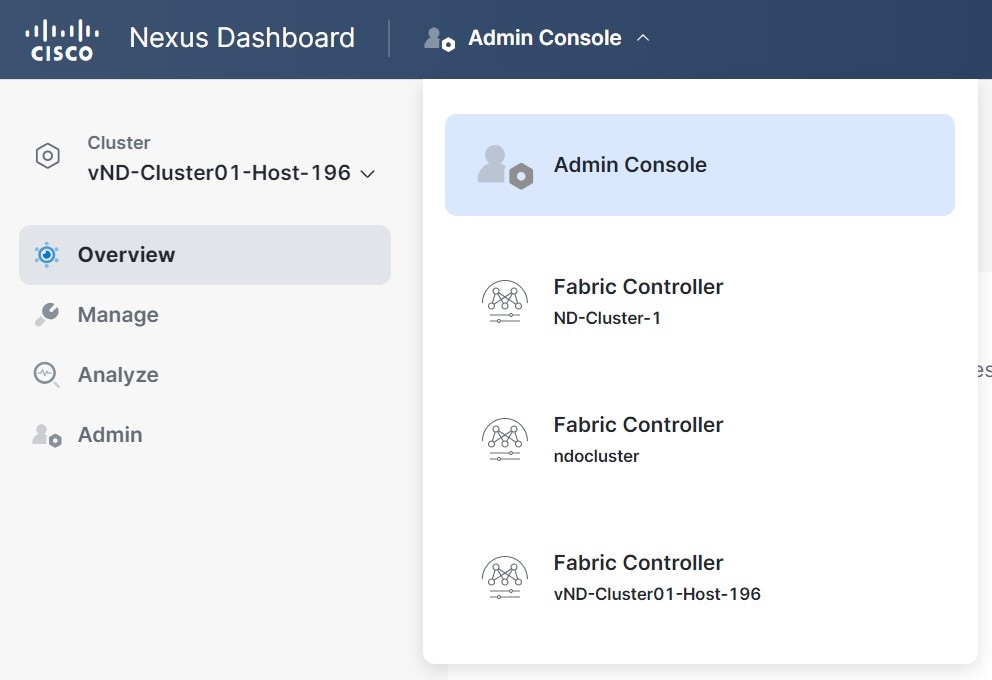
Log in to Nexus Dashboard as a remote user.
The Nexus Dashboard Admin Console opens.
-
In the Admin Console GUI, click the top banner dropdown list and choose the appropriate Fabric Controller cluster.
-
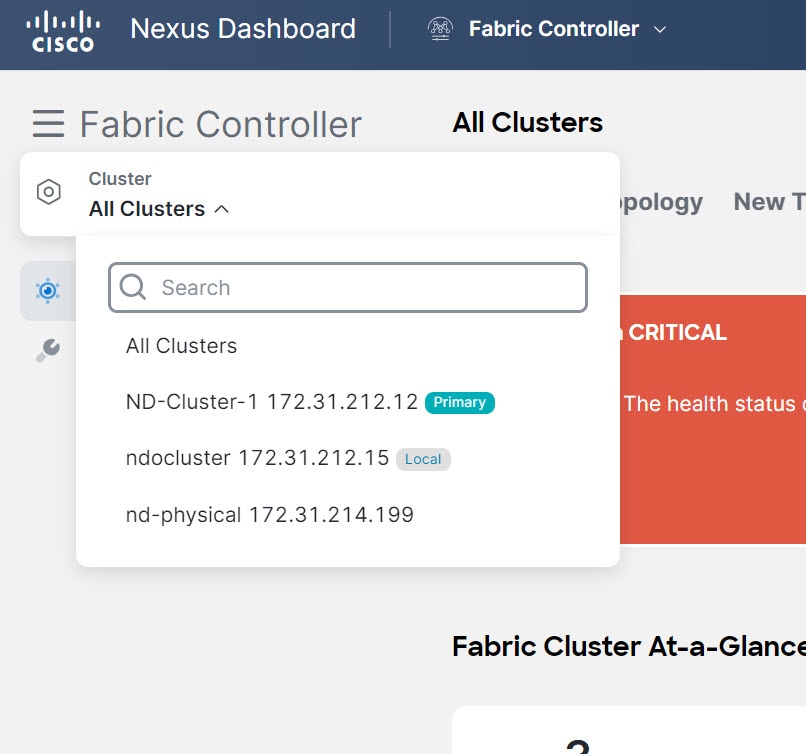
In the NDFC GUI, click the cluster dropdown list and choose All Clusters.
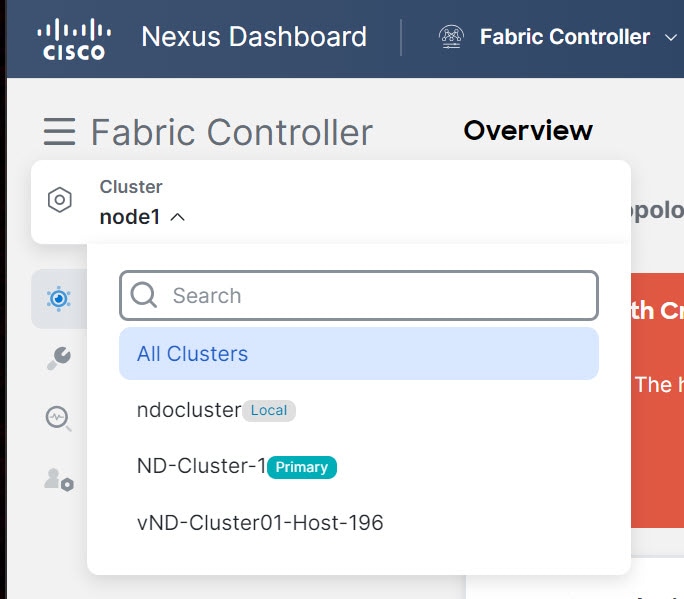
The One Manage page appears.


If the All Clusters selection or the One Manage do not appear, check that you have met the Prerequisites.

From the Cluster View dropdown list, you can also open an overview dashboard for any member of the federated clusters by selecting that cluster. See Viewing a Specific Cluster.
Create and Manage Multi-Cluster Fabrics Using One Manage
-
Navigate to the One Manage page.
See Navigate to the One Manage Page for those instructions.
-
Click Manage > Fabrics.
The Fabrics page appears, listing all of the multi-cluster fabrics that have been configured through One Manage.
-
Click Actions > Create Fabric Group.
The Create Fabric Group configuration wizard appears.
Navigate through the following steps to create a multi-cluster fabric:
1. Select Fabric Group Type
-
Select the type of multi-cluster fabric that you want to create.
For release 12.2.2, the VXLAN multi-cluster fabric type is the only available choice.
-
Click Next.
2. Select Child Fabric
-
Review the available child fabrics that are listed in the Select Child Fabric page.
The Select Child Fabric page lists any child fabrics that are part of an NDFC cluster that is available to have as part of your new multi-cluster fabric.
-
Click the circle next to a child fabric that you want to add to the new multi-cluster fabric that you’re creating.
You can select only one child fabric from the list to add to the multi-cluster fabric at this point in the process. However, you will be able to add additional child fabrics to the multi-cluster fabric at the end of these procedures, after you have completed the configuration process for the multi-cluster fabric.
You can also create a multi-cluster fabric without a child fabric in this step if necessary, and then add a child fabric later on.
-
Click Next.
3. Settings
-
Enter a name for your new multi-cluster fabric.
The entry in the Fabric Type field is based on the entry that you provided in [1. Select Fabric Type].
-
Enter the necessary field values to create a multi-cluster fabric.
The tabs and their fields in the screen are explained in the subsequent sections. The overlay and underlay network parameters are included in these tabs.
General Parameters
All mandatory fields in the General Parameters tab are prefilled. Update the relevant fields as needed.
| Field | Description |
|---|---|
|
Layer 2 VXLAN VNI Range |
Specifies the Layer 2 VXLAN segment identifier range. |
|
Layer 3 VXLAN VNI Range |
Specifies the Layer 3 VXLAN segment identifier range. |
|
Enable IPv6 Underlay for VXLAN Fabric |
IPv6 underlay is not supported with One Manage. Check the box to enable IPv6 underlay for the child VXLAN fabric. If you leave the box checked, then IPv4 underlay is used in the child VXLAN fabric. |
|
VRF Template |
Specifies the default VRF template for leaf devices. |
|
Network Template |
Specifies the default network template for leaf devices. |
|
VRF Extension Template |
Specifies the default VRF extension template for border devices. |
|
Network Extension Template |
Specifies the default network extension template for border devices. |
|
Enable Private VLAN (PVLAN) |
Check the box to enable private VLAN on VXLAN Multi-Site and its child fabrics. |
|
PVLAN Secondary Network Template |
This option is available if you enabled the Enable Private VLAN (PVLAN) option above. Specifies the default secondary PVLAN network template. |
|
Anycast-Gateway-MAC |
Specifies the anycast gateway MAC address. |
|
Multi-Site VTEP VIP Loopback Id |
Specifies the multisite routing loopback ID. |
|
Border Gateway IP TAG |
Routing tag associated with IP address of loopback and DCI interfaces |
|
ToR Auto-deploy Flag |
Enables automatic deployment of the networks and VRFs in VXLAN EVPN fabric connected to ToR switches in an External Fabric. The system enables this configuration on performing Recalculate and Deploy in the VXLAN EVPN Multi-Site fabric. |
What’s next: Complete the configurations in another tab, if required, or click Next when you have completed the necessary configurations for this fabric.
DCI
| Field | Description |
|---|---|
|
Multi-Site Overlay IFC Deployment Method |
Defines how the data centers connect through the border gateways:
The Multisite IFCs can be created between the border gateways in the VXLAN EVPN fabrics and router server in external fabric, or back-to-back between border gateways in two VXLAN EVPN fabrics. |
|
Multi-Site Route Server List |
Specifies the IP addresses of the route server. If you specify more than one, separate the IP addresses using a comma. |
|
Multi-Site Route Server BGP ASN List |
Specifies the BGP AS Number of the router server. If you specify more than one route server, separate the AS Numbers using a comma. |
|
Enable 'redistribute direct' on Route Servers |
Enables auto-creation of multi-site overlay IFCs on route servers. This field is applicable only when you have configured the deployment method for Multi-Site Overlay as Centralized_To_Route_Server. |
|
Route Server IP TAG |
Specifies the routing tag associated with route server IP for redistribute direct. This is the IP used in eBGP EVPN peering. |
|
Multi-Site Underlay IFC Auto Deployment Flag |
Enables auto configuration. Uncheck the check box for manual configuration. When this option is enabled, NDFC determines the physical connections between the border gateways if the Direct_to_BGWS option is selected in the Multi-Site Overlay IFC Deployment Method field, or between the core router and the border gateways if the Centralized_to_Route_Server option is selected in the Multi-Site Overlay IFC Deployment Method field. When enabling this option for multi-cluster deployments, NDFC also determines the interconnections between devices that are managed in each cluster. |
|
BGP Send-community on Multi-Site Underlay IFC |
Enables the Enable BGP Send-Community both setting in auto-created multi-site underlay IFC, which will generate the send-community both in the eBGP session for multi-site underlay. |
|
BGP log neighbor change on Multi-Site Underlay IFC |
Configures the Enable BGP log neighbor change setting in auto created multi-site underlay IFC. |
|
BGP BFD on Multi-Site Underlay IFC |
Configures the Enable BGP BFD setting in auto created multi-site underlay IFC. |
|
Delay Restore Time |
Specifies the Multi-Site underlay and overlay control planes convergence time. The minimum value is 30 seconds and the maximum value is 1000 seconds. |
|
Enable Multi-Site eBGP Password |
Check the box to enable eBGP password for Multi-Site underlay/overlay IFCs. |
|
eBGP Password |
Specifies the encrypted eBGP Password Hex String. |
|
eBGP Authentication Key Encryption Type |
Specifies the BGP key encryption type. It is 3 for 3DES and 7 for Cisco. |
What’s next: Complete the configurations in another tab, if required, or click Next when you have completed the necessary configurations for this fabric.
Security
The fields in the Security tab are described in the following table.
| Field | Description |
|---|---|
|
Enable Security Groups |
Security groups are not supported with One Manage, as described in Guidelines and Limitations for One Manage. Leave this field in the default |
|
Security Group Name Prefix |
Specify the prefix to use when creating a new security group. |
|
Security Group Tag (SGT) ID Range (Optional) |
Specify a tag ID for the security group if necessary. |
|
Security Groups Pre-Provision |
Check this check box to generate a security groups configuration for non-enforced VRFs. |
|
Multi-Site CloudSec |
Check the box to enable CloudSec configurations on border gateways. If you enable this field, the remaining three fields for CloudSec are editable. For more information, see the section "Support for CloudSec in Multi-Site Deployment" in VXLAN EVPN Multi-Site. |
|
CloudSec Key String |
Specifies the Cisco Type 7 encrypted octet key string. |
|
CloudSec Cryptographic Algorithm |
Choose AES_128_CMAC or AES_256_CMAC for the encryption type. |
|
CloudSec Enforcement |
Specifies whether the CloudSec enforcement should be strict or loose.
There should be at least two fabrics in VXLAN Multi-Site with border gateways that support CloudSec. If there is only one fabric with a CloudSec capable device, then the following error message is generated: CloudSec needs to have at least 2 sites that can support CloudSec. To remove the error, make sure you have at least two sites that can support CloudSec or disable CloudSec. |
|
CloudSec Status Report Timer |
Specifies the CloudSec Operational Status periodic report timer in minutes. This value specifies how often the NDFC polls the CloudSec status data from the switch. The default value is 5 minutes and the range is from 5 to 60 minutes. |
What’s next: Complete the configurations in another tab, if required, or click Next when you have completed the necessary configurations for this fabric.
Resources
| Field | Description |
|---|---|
|
Multi-Site VTEP VIP Loopback IP Range |
Specifies the Multi-Site loopback IP address range used for the EVPN Multi-Site function. A unique loopback IP address is assigned from this range to each member fabric because each member site must have a Multi-site Routing Loopback IP address assigned for overlay network reachability. The per-fabric loopback IP address is assigned on all the BGWs in a specific member fabric. |
|
DCI Subnet IP Range |
Specifies the Data Center Interconnect (DCI) subnet IP address. |
|
Subnet Target Mask |
Specifies the DCI subnet mask (range is 8-31). |
|
Multi-Site VTEP VIP Loopback IPv6 Range |
Specifies the Multi-Site loopback IPv6 address range used for the EVPN Multi-Site function. A unique loopback IPv6 address is assigned from this range to each member fabric because each member site must have a Multi-site Routing Loopback IPv6 address assigned for overlay network reachability. The per-fabric loopback IPv6 address is assigned on all the BGWs in a specific member fabric. |
|
DCI Subnet IPv6 Range |
Specifies the Data Center Interconnect (DCI) subnet IPv6 address. |
|
Subnet Target IPv6 Mask |
Specifies the DCI subnet IPv6 mask (range is 120-127). |
What’s next: Complete the configurations in another tab, if required, or click Next when you have completed the necessary configurations for this fabric.
Configuration Backup
| Field | Description |
|---|---|
|
Scheduled Fabric Backup |
Check the box to enable a daily backup of the multi-cluster fabric. This backup tracks changes in the running configuration of the fabric devices that are not tracked by configuration compliance. |
|
Scheduled Time |
Specifies the scheduled backup time in 24-hour format. This field is enabled if you check the Scheduled Fabric Backup check box. Select both the check boxes to enable both back up processes. |
What’s next: Complete the configurations in another tab, if required, or click Next when you have completed the necessary configurations for this fabric.
4. Summary
-
Review the information provided in the Summary page.
-
Click Create to create the multi-cluster fabric.
5. Result
The new multi-cluster fabric now appears in the Fabrics table in the All Clusters Fabrics page. Double-click on the new multi-cluster fabric to display the overview information for this new fabric and to make modifications to the fabric configuration, if necessary, such as:
-
Adding additional child fabrics to the multi-cluster fabric, as described in Add Additional Child Fabrics.
-
Using Multi-Attach to attach multiple switches and interfaces to the network at the same time, as described in the Networks section in the About Fabric Overview for LAN Operational Mode Setups article.
In addition, if you were to navigate back to the individual fabrics within the diffferent NDFC instances by clicking One Manage > individual-NDFC-instance, the information displayed for components that are part of the multi-cluster fabric is different. For example:
-
When navigating to the main Fabrics page for an NDFC instance (Manage > Fabrics), each fabric that is part of the multi-cluster fabric now has (Remote Fabric) shown in the Fabric Technology column, and also has the multi-fabric cluster name prepended to the Fabric Name.
-
Within each of these fabrics, switches are given a role of Meta.
Add Additional Child Fabrics
When you first configure a multi-cluster fabric, you are able to add only one child fabric as part of that configuration process. To add additional child fabrics to a multi-cluster fabric:
-
Navigate to the Multi Cluster Fabric Group Overview page for the multi-cluster fabric, if you are not there already.
-
Navigate to the One Manage page.
See Navigate to the One Manage Page for those instructions.
-
Click Manage > Fabrics.
-
Double-click on the appropriate multi-cluster fabric to display the overview information for that fabric.
-
-
In the Overview page for this multi-cluster fabric, click the Child Fabrics tab, then click Actions > Add Child Fabric.
A list of the remaining available child fabrics appears.
-
Click the circle next to a child fabric that you want to add to the new multi-cluster fabric, then click Select.
-
Repeat this step to add additional child fabrics to the multi-cluster fabric.
-
When you have finished adding additional child fabrics to the multi-cluster fabric, click Actions > Recalculate and Deploy.
This action generates the multi-site configurations on the border gateways in each of the VXLAN EVPN fabrics and configures the inter-fabric links between the child fabrics in the multi-cluster fabric.
-
In the Config Preview window, click the link in the Pending Config column to verify that all the planned configuration changes are correct for that child fabric.
-
Click Deploy All when you are ready to deploy the multi-cluster fabric with the newly added child fabrics.
The Deploy Progress window appears, displaying the progress of the multi-cluster fabric deployment.
Additional Multi-Cluster Fabric Configurations
Navigate to Manage > Fabrics, then double-click on the appropriate multi-cluster fabric to display the overview information for that fabric, where you can perform additional configurations on that multi-cluster fabric.
For the most part, the configuration options and procedures for a multi-cluster fabric are no different than the configuration options and procedures for a VXLAN EVPN Multi-Site fabric, as described in VXLAN EVPN Multi-Site and About Fabric Overview for LAN Operational Mode Setups. However, because the overview page for a multi-cluster fabric allows you to view configurations across clusters, you can also make configuration changes to components that may be associated with fabrics in different clusters.
For example, the procedures for creating a VRF in a multi-cluster fabric are identical to those procedures documented in the section "VRFs" in About Fabric Overview for LAN Operational Mode Setups, except that the switches listed in the VRF Attachments tab for a multi-cluster fabric might be associated with fabrics in different clusters. Similarly, when creating a network, the procedures provided in the section "Networks" in About Fabric Overview for LAN Operational Mode Setups apply as-is for multi-cluster fabrics; however, you can also use the Multi-Attach option for switches that might be associated with fabrics in different clusters.
The following sections describe areas that have configuration procedures that are specific to multi-cluster fabrics.
Link Configurations
In the overview page for a multi-cluster fabric, click the Links tab to display any configured links for that multi-cluster fabric. Click Actions > Create to create a link.
The following areas in the Create Link page are specific to a multi-cluster fabric:
-
Link Type: Because this is a multi-cluster fabric,
Inter-Fabricis the only available option in the Link Type field. -
Source Cluster and Destination Cluster: These fields allow you to select the source and destination cluster within the multi-cluster fabric. You can then select the source and destination fabrics within those selected source and destination clusters.
Event Analytics
In the overview page for a multi-cluster fabric, click the Event Analytics tab to display any configured alarms for that multi-cluster fabric. Cluster-specific tabs allow you to view event analytics information specific to those clusters.
History
In the overview page for a multi-cluster fabric, click the History tab to view the deployment history for that multi-cluster fabric. Cluster-specific tabs allow you to view deployment history information specific to those clusters.
Backing Up and Restoring Multi-Cluster Fabric Configurations
Back Up Multi-Cluster Fabric Configurations
-
Navigate to the One Manage page.
See Navigate to the One Manage Page for those instructions.
-
Click Manage > Fabrics.
The Fabrics page appears, listing all of the multi-cluster fabrics that have been configured through One Manage.
-
Double-click on the appropriate multi-cluster fabric to display the overview information for that fabric.
-
Click Actions > More > Backup Fabric.
The Create Fabric Backup window appears.
-
In the Backup Tag area, enter a name for the backup, then click Create Backup.
Restore Multi-Cluster Fabric Configurations
-
Navigate to the One Manage page.
See Navigate to the One Manage Page for those instructions.
-
Click Manage > Fabrics.
The Fabrics page appears, listing all of the multi-cluster fabrics that have been configured through One Manage.
-
Double-click on the appropriate multi-cluster fabric to display the overview information for that fabric.
-
Click Actions > More > Restore Fabric.
The Restore Multi-Cluster Fabric window appears.
-
Review the backups shown on this page.
The following table describes the columns that appear on the Restore Backup tab.
Fields Descriptions Backup Date
Specifies the backup date.
Backup Version
Specifies the version of backup.
Backup Tag
Specifies the backup name.
Backup Type
Specifies the backup type (for example, a golden backup).
The following table describes the fields that appear on the Action tab.
Actions Descriptions Mark as golden
To mark an existing backup as a golden backup, choose Mark as golden. Click Confirm in the confirmation window.
Remove as golden
To remove an existing backup from a golden backup, choose Remove as golden. Click Confirm in the confirmation window.
-
In the Select Backup step, click the radio button for the fabric backup that you want to restore, then click Next.
-
In the Restore Preview step, verify that the information is correct for the backup that you want to restore.
You can preview the details about the configuration in the backup file. You can also view the name and serial numbers for the switches in the Fabric backup. Click on Delta Config to view the configuration difference on the switches in the fabric.
-
Click Restore Intent.
-
In the Restore Status step, you can view the status of restoring the intent.
-
Click Next to view the preview configuration.
-
In the Configuration Preview step, you can resync the configurations on specific switches.
For the desired switch, check the Switch Name check box, and click ReSync.
-
Click Deploy to complete the Restore Fabric operation.
Monitoring Multi-Cluster Fabrics
Monitoring Multi-Cluster Fabrics Using One Manage Dashboard
You can use the One Manage Dashboard to monitor multi-cluster fabrics. The One Manage Dashboard aggregates status information from multiple NDFC-managed fabric clusters that have been configured in Nexus Dashboard, allowing a remote user to monitor a multi-cluster network from one screen.
The One Manage Dashboard is available only when more than one NDFC fabric cluster has been joined together in the Nexus Dashboard application.
The One Manage Dashboard is visible only to remote users, who must be authenticated by Nexus Dashboard using remote authentication such as RADIUS or TACACS. This view is not visible to a local user.
The One Manage Dashboard displays several dashlets along with summary information for the following:
-
Number of LAN clusters
-
Number of fabrics
-
Number of switches
Additional dashlets summarize fabric and switch health, switch release versions, and switch models. Next to each dashlet is a set of links that open expanded pages for each item in the summary.
The following figure is an example of the One Manage Dashboard.
You can click the Refresh link to manually refresh the dashboard.
The following table describes the dashlets that appear in the One Manage Dashboard:
| Dashlet | Description |
|---|---|
|
All Clusters |
Two horizontal tiles display the highest health condition severity of:
|
|
Fabric Cluster At-a-Glance |
Displays the following as a horizontal set of tiles.
|
|
Number of Fabrics |
Displays the total number of clustered fabrics in a color representing the highest health severity among the fabrics. This number is a clickable link. See Viewing Fabric Details. |
|
Fabric Health |
Displays the health status of the fabrics in the form of a circular chart with colors indicating different health condition severities. The Fabric Health status is based on the severity of the highest outstanding alarm for the fabric or its member switches. |
|
Number of Switches |
Displays the total number of switches in a cluster in a color representing the highest health severity among the switches. This number is a clickable link. See Viewing Switch Details. |
|
Switch Health |
Displays the health status of the switches in the form of a circular chart with colors indicating different health condition severities. The Switch Health status is based on the severity of the highest outstanding alarm for the switch or its interfaces. |
|
Switch Release Versions |
Displays the NX-OS versions in the form of a circular chart with colors indicating different release versions present in the switches in a cluster. |
|
Switch Models |
Displays the switch PIDs in the form of a circular chart with colors indicating different switch models in the fabric cluster. |
Prerequisites for the One Manage Dashboard
The following conditions must be met before you can view the One Manage Dashboard:
-
More than one NDFC fabric cluster has been joined together in the Nexus Dashboard application. Up to four NDFC clusters can be joined together in the Nexus Dashboard application.
-
You are logged in to Nexus Dashboard using remote authentication such as RADIUS or TACACS. You are not logged in as a local user.
Accessing the One Manage Dashboard
You can view the One Manage Dashboard by logging in as a remote user to a Nexus Dashboard controller that manages more than one fabric cluster.
-
Log in to Nexus Dashboard as a remote user.
The Nexus Dashboard Admin Console opens.
-
In the Admin Console GUI, click the top banner drop-down list and choose the appropriate Fabric Controller cluster.
-
In the NDFC GUI, click the One Manage drop-down list and choose All Clusters.
The One Manage Dashboard appears.
If the All Clusters selection or the One Manage Dashboard do not appear, check that you have met the Prerequisites.
From the Cluster View drop-down list, you can also open an overview dashboard for any member of the clusters by selecting that cluster. See Viewing a Specific Cluster.
Viewing the Details
By clicking certain objects in the One Manage Dashboard, you can open subpages containing detailed attributes of the selected object.
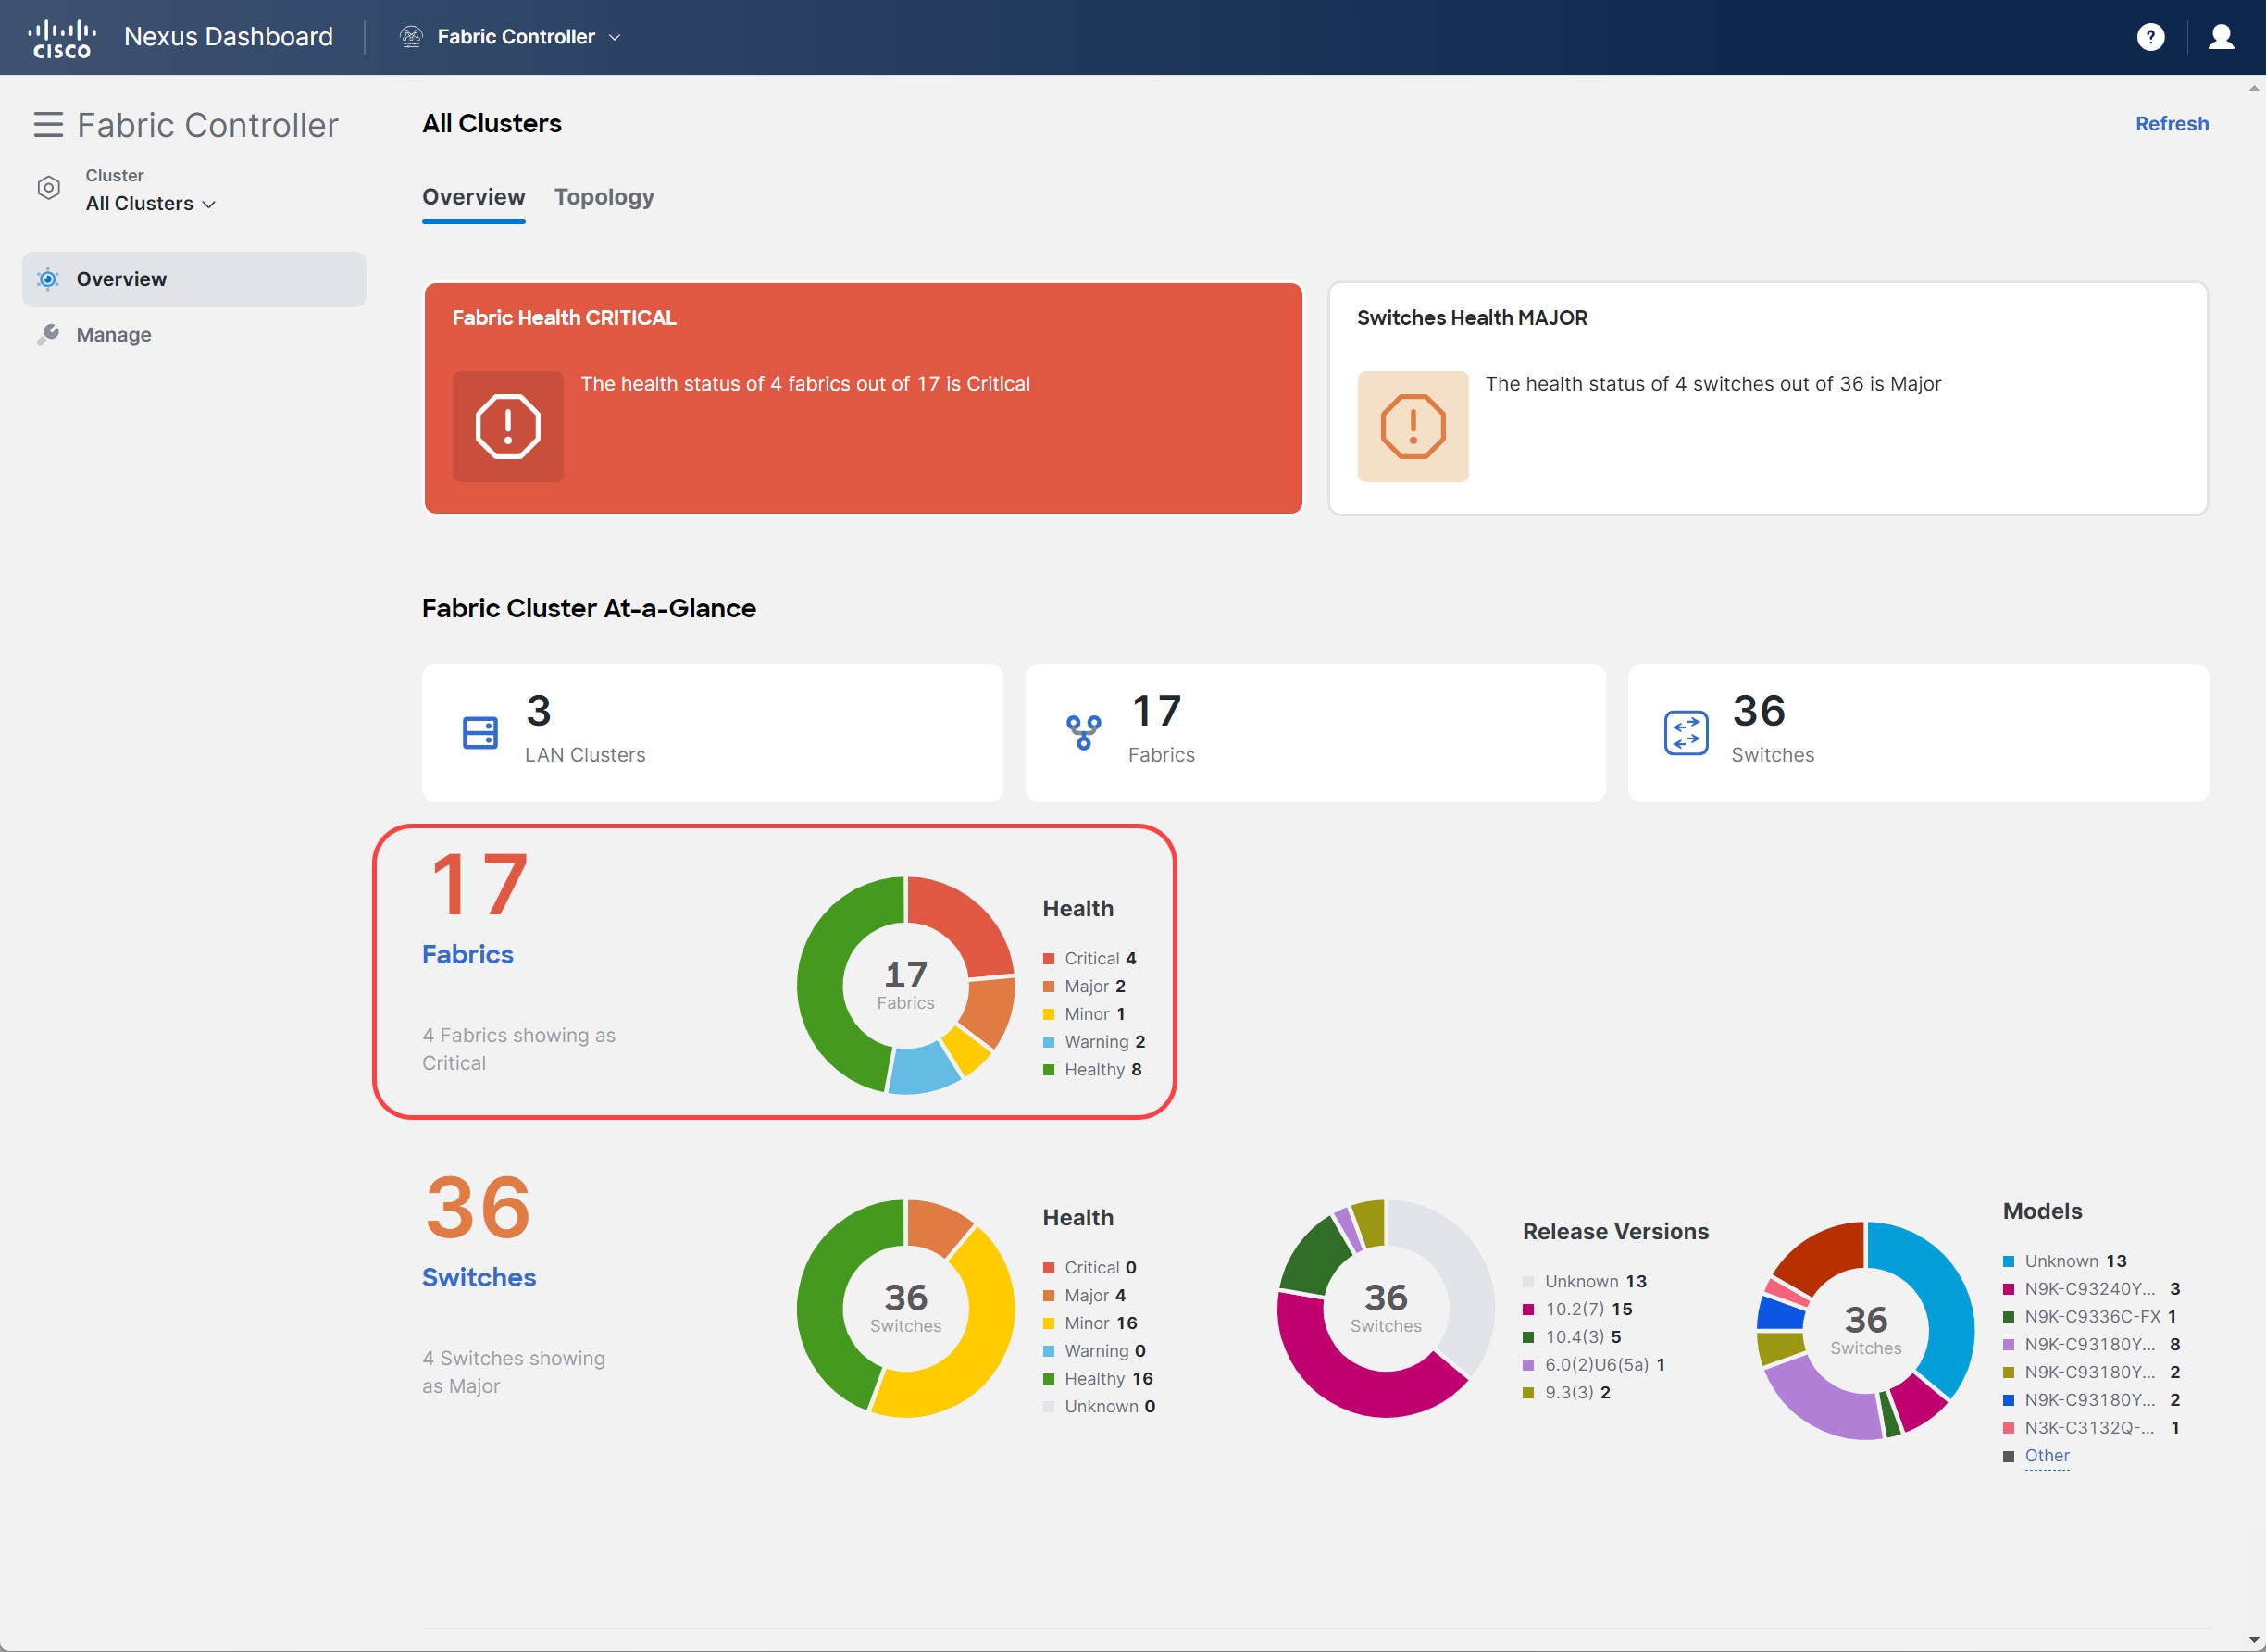
The Fabrics area in the One Manage Dashboard provides the following information:
-
The total number of fabrics in the cluster
-
Health status information for the fabrics in the cluster
Click the number shown in the total number of fabrics area to display a sidebar with a table of the fabrics in the cluster.
For each fabric, the table of clustered fabrics lists the following properties:
| Attributes | Description |
|---|---|
|
Controller Name |
The name of the fabric controller that manages this fabric. |
|
Fabric Name |
The name of the fabric. |
|
Fabric Technology |
|
|
Fabric Type |
Beginning with the NDFC 12.2.2 release, IPFM fabrics are supported for One Manage Dashboard.
|
|
ASN |
The Autonomous System Number (ASN) associated with this fabric. |
|
Fabric Health |
The current health severity of this fabric as reported by the fabric controller. |
VXLAN EVPN Multi-Site fabrics might appear in the One Manage Dashboard even though a filter might be set that should exclude them; this is because a true condition for a child fabric in the VXLAN EVPN Multi-Site fabric will cause that parent VXLAN EVPN Multi-Site fabric to also appear, even if that condition is false for the parent fabric. For example, if all of the child fabrics have an ASN value but the parent fabric does not (has NA as the ASN entry), a filter entry of ASN != NA will correctly show all of the child fabrics, but will also incorrectly show the parent VXLAN EVPN Multi-Site fabric because the parent fabric will appear along with the child fabrics.
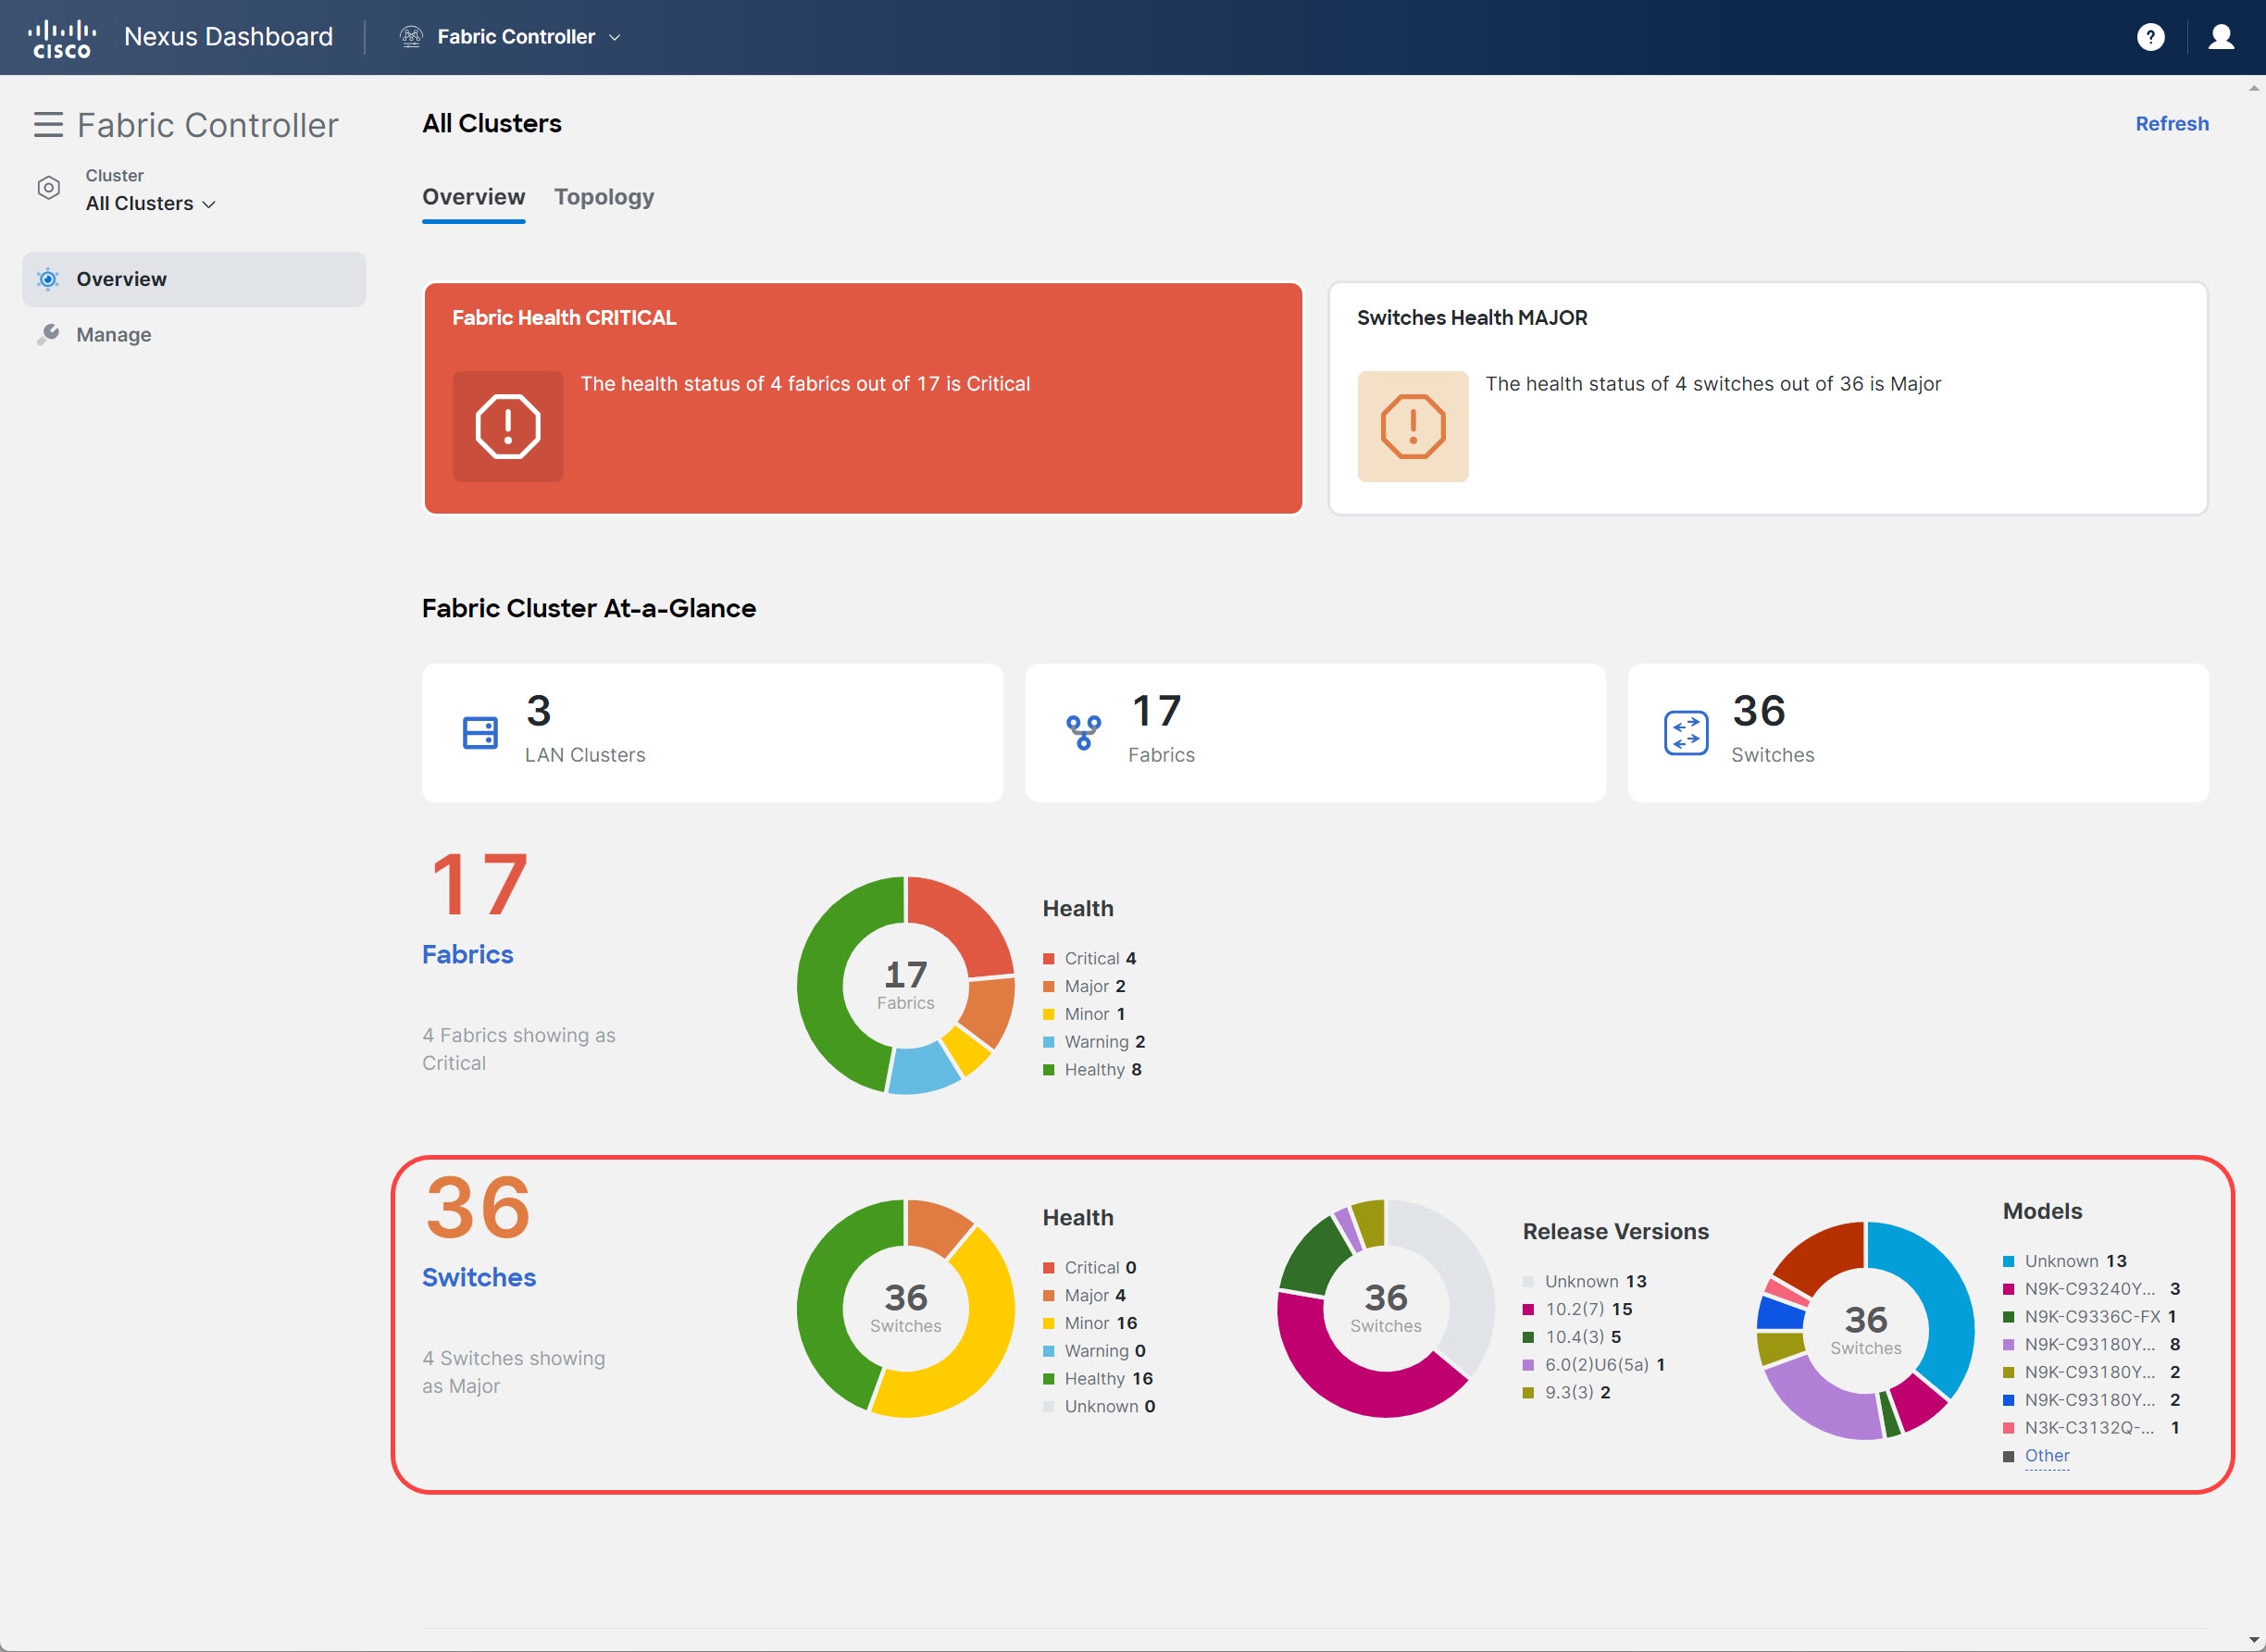
The Switches area in the One Manage Dashboard provides the following information:
-
The total number of switches in the cluster
-
Health status information for the switches in the cluster
-
The release versions for the switches in the cluster
-
The models for the switches in the cluster
Click the number shown in the total number of switches area to display a sidebar with a table of the switches in the cluster.
For each switch, the table of switches in a cluster lists the following properties:
| Attributes | Description |
|---|---|
|
Controller Name |
The name of the fabric controller for the fabric that includes the switch. |
|
Switch |
The name of the switch. |
|
IP Address |
The IP address of the switch (IPv4 or IPv6). |
|
Role |
Whether the switch is acting as a:
|
|
Serial Number |
The serial number of the switch. |
|
Fabric Name |
The name of the fabric that includes the switch. |
|
Mode |
|
|
Config Status |
|
|
Oper Status |
The current health severity of the switch. |
|
Discovery Status |
|
|
Model |
The Cisco model number of the switch. |
|
VPC Role |
If the switch is part of a VPC pair, whether it is the Primary or Secondary link. If applicable, whether it is Operational Primary or Secondary. |
|
VPC Peer |
If the switch is part of a VPC pair, the name of the peer switch. |
|
Software Version |
The NX-OS release running on the switch. |
|
Up Time |
The time elapsed since the last startup or reboot of the switch. |
To view a table of fabrics or switches with a specific health severity, click the corresponding color of the circular chart, or click the severity from the list next to the chart:

-
For fabrics, the resulting table shows the list of fabrics filtered by the selected Fabric Health property.
-
For switches, the resulting table shows the list of switches filtered by the selected Oper Status property.
To view a table of the switches running a specific NX-OS release, click the corresponding color of the Release Versions circular chart, or click the release from the list next to the chart.
The resulting table shows a list of switches filtered by the selected Software Version property.
To view a table of a specific model of switches present in the cluster, click the corresponding color of the Models circular chart, or click the model number from the list next to the chart.
The resulting table shows a list of switches filtered by the selected Model property.
Viewing a Specific Cluster
In the One Manage Dashboard, you can open an overview dashboard for any member of the clusters.
From the Cluster View drop-down list, choose one of the member clusters.
A view of the selected cluster appears.
Monitoring Multi-Cluster Fabrics Through One Manage Topology View
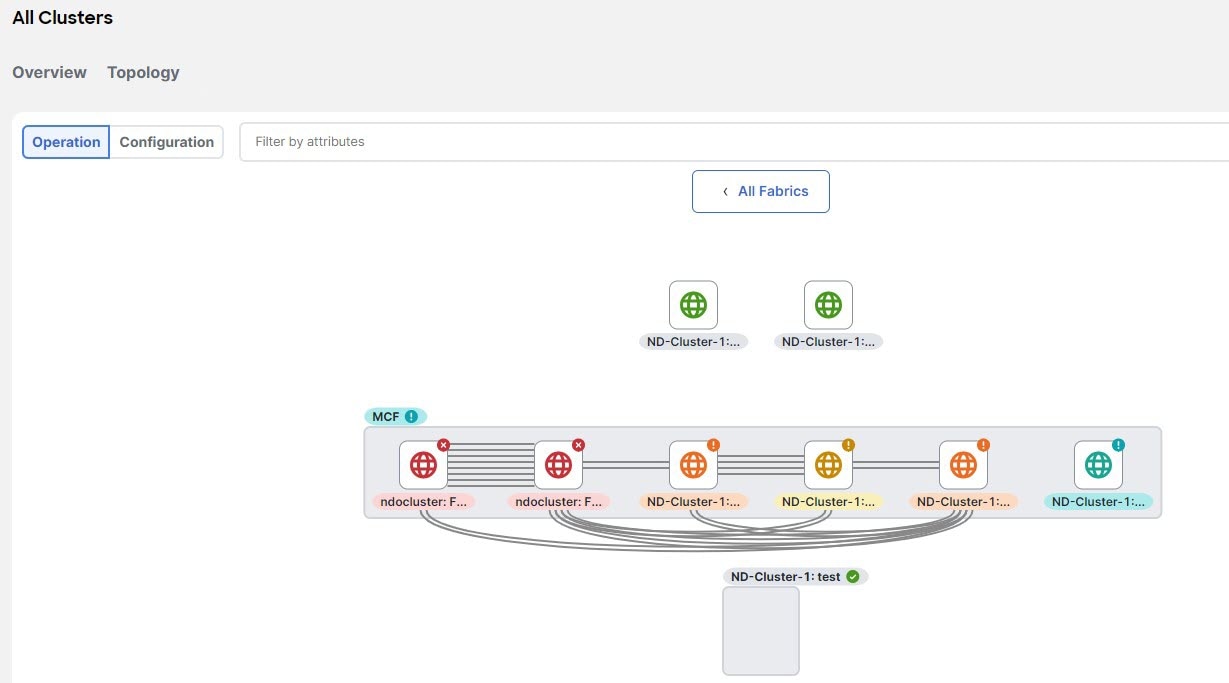
The One Manage topology view provides a combined topology of all the fabrics across all the clusters in a multi-cluster.
In the NDFC GUI, click Overview > Topology to navigate to the One Manage topology view.
-
The top level of this topology view displays all the fabrics from across all clusters, where the fabric names are qualified by cluster names. Inter-fabric discovered links and user-created inter-fabric links are also displayed at this level.
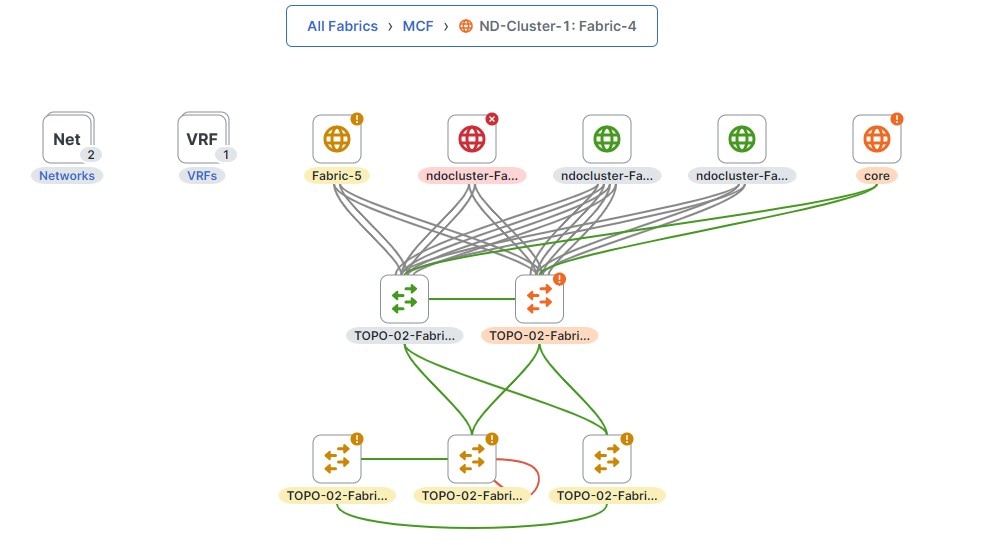
-
Double-click on an MSD to show all the member fabrics with their switches and their interconnections.
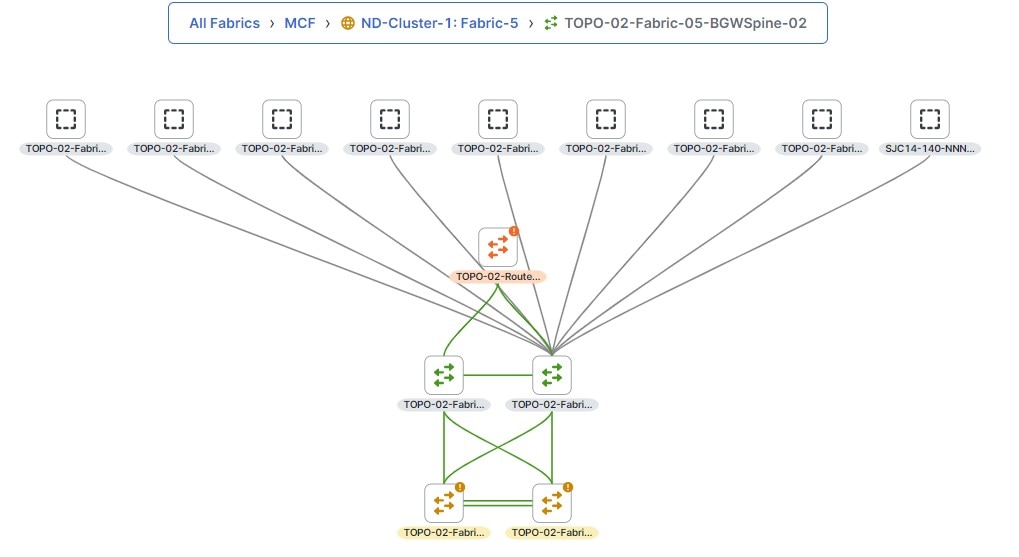
-
Double-click on a single fabric to show additional information at the individual fabric level.
Copyright
THE SPECIFICATIONS AND INFORMATION REGARDING THE PRODUCTS IN THIS MANUAL ARE SUBJECT TO CHANGE WITHOUT NOTICE. ALL STATEMENTS, INFORMATION, AND RECOMMENDATIONS IN THIS MANUAL ARE BELIEVED TO BE ACCURATE BUT ARE PRESENTED WITHOUT WARRANTY OF ANY KIND, EXPRESS OR IMPLIED. USERS MUST TAKE FULL RESPONSIBILITY FOR THEIR APPLICATION OF ANY PRODUCTS.
THE SOFTWARE LICENSE AND LIMITED WARRANTY FOR THE ACCOMPANYING PRODUCT ARE SET FORTH IN THE INFORMATION PACKET THAT SHIPPED WITH THE PRODUCT AND ARE INCORPORATED HEREIN BY THIS REFERENCE. IF YOU ARE UNABLE TO LOCATE THE SOFTWARE LICENSE OR LIMITED WARRANTY, CONTACT YOUR CISCO REPRESENTATIVE FOR A COPY.
The Cisco implementation of TCP header compression is an adaptation of a program developed by the University of California, Berkeley (UCB) as part of UCB’s public domain version of the UNIX operating system. All rights reserved. Copyright © 1981, Regents of the University of California.
NOTWITHSTANDING ANY OTHER WARRANTY HEREIN, ALL DOCUMENT FILES AND SOFTWARE OF THESE SUPPLIERS ARE PROVIDED “AS IS" WITH ALL FAULTS. CISCO AND THE ABOVE-NAMED SUPPLIERS DISCLAIM ALL WARRANTIES, EXPRESSED OR IMPLIED, INCLUDING, WITHOUT LIMITATION, THOSE OF MERCHANTABILITY, FITNESS FOR A PARTICULAR PURPOSE AND NONINFRINGEMENT OR ARISING FROM A COURSE OF DEALING, USAGE, OR TRADE PRACTICE.
IN NO EVENT SHALL CISCO OR ITS SUPPLIERS BE LIABLE FOR ANY INDIRECT, SPECIAL, CONSEQUENTIAL, OR INCIDENTAL DAMAGES, INCLUDING, WITHOUT LIMITATION, LOST PROFITS OR LOSS OR DAMAGE TO DATA ARISING OUT OF THE USE OR INABILITY TO USE THIS MANUAL, EVEN IF CISCO OR ITS SUPPLIERS HAVE BEEN ADVISED OF THE POSSIBILITY OF SUCH DAMAGES.
Any Internet Protocol (IP) addresses and phone numbers used in this document are not intended to be actual addresses and phone numbers. Any examples, command display output, network topology diagrams, and other figures included in the document are shown for illustrative purposes only. Any use of actual IP addresses or phone numbers in illustrative content is unintentional and coincidental.
The documentation set for this product strives to use bias-free language. For the purposes of this documentation set, bias-free is defined as language that does not imply discrimination based on age, disability, gender, racial identity, ethnic identity, sexual orientation, socioeconomic status, and intersectionality. Exceptions may be present in the documentation due to language that is hardcoded in the user interfaces of the product software, language used based on RFP documentation, or language that is used by a referenced third-party product.
Cisco and the Cisco logo are trademarks or registered trademarks of Cisco and/or its affiliates in the U.S. and other countries. To view a list of Cisco trademarks, go to this URL: http://www.cisco.com/go/trademarks. Third-party trademarks mentioned are the property of their respective owners. The use of the word partner does not imply a partnership relationship between Cisco and any other company. (1110R)
© 2017-2024 Cisco Systems, Inc. All rights reserved.