
Firmware Management (Cluster Upgrades)
This section describes how to manage different firmware versions and perform cluster upgrades.
The upgrade process involves uploading a new image and then deploying it. As such, the same workflow can be used for cluster firmware downgrades as well.

The following sections provide reference information for firmware upgrades. For the latest upgrade process information, see the online version of the Nexus Dashboard Deployment Guide.
Prerequisites and Guidelines
Before you upgrade your existing Nexus Dashboard cluster:
-
Ensure that you have read the target release’s Release Notes for any changes in behavior, guidelines, and issues that may affect your upgrade.
The upgrade process is the same for all Nexus Dashboard form factors. However, if your existing cluster is deployed using physical servers, VMware ESX, Linux KVM, Azure, or AWS, you will use the target release’s ISO image (nd-dk9.<version>.iso) to upgrade; if your existing cluster is deployed in Red Hat Enterprise Linux, you will use the RHEL-specific image (nd-rhel-<version>.tar).
-
Ensure that you have read the Release Notes and upgrade guides for any services you run in the existing cluster and plan to run on the target release for service-specific changes in behavior, guidelines, and issues that may affect your upgrade.
You can find the service-specific documents at the following links:
-
If you are upgrading a physical Nexus Dashboard cluster, ensure that the nodes have a supported CIMC version for the target Nexus Dashboard release.
Supported CIMC versions are listed in the Nexus Dashboard Release Notes for the target release.
CIMC upgrade is described in detail in Upgrading CIMC.
-
You must perform configuration backups of your Nexus Dashboard and services before the upgrade to safeguard data and minimize any potential risk before proceeding with the upgrade.
-
You must have valid DNS and NTP servers configured and reachable by all cluster nodes.
-
Ensure that your current Nexus Dashboard cluster is healthy.
You can check the system status on the Overview page of the Nexus Dashboard’s Admin Console or by logging in to one of the nodes as
rescue-userand ensuring that theacs healthcommand returnsAll components are healthy. -
Ensure that no configuration changes are made to the cluster, such as adding secondary or standby nodes, while the upgrade is in progress.
For a complete list of Nexus Dashboard and services interoperability support, see the Nexus Dashboard and Services Compatibility Matrix.
-
Nexus Dashboard does not support platform downgrades.
If you want to downgrade to an earlier release, you will need to deploy a new cluster and reinstall the services.
Adding Images
Before you can upgrade your Nexus Dashboard cluster, you need to make the upgrade image available by adding it using the GUI.
-
Download the Nexus Dashboard image.
-
Browse to the Software Download page.
https://software.cisco.com/download/home/286327743/type/286328258
-
Choose the Nexus Dashboard version you want to download.
-
Download the Cisco Nexus Dashboard image (
nd-dk9.<version>.iso).
You must download the
.isoimage for all upgrades, even if you used the VMware ESX.ova, Linux KVM.qcow2, or a cloud provider’s marketplace for initial cluster deployment.
-
(Optional) Host the image on a web server in your environment.
When you upload the image to your Nexus Dashboard cluster, you will have an option to provide a direct URL to the image.
-
-
Navigate to your Nexus Dashboard’s Admin Console.
-
Add the image.
-
From the main navigation menu, select Manage > Software Management.
-
In the main pane, select the Images tab.
The page will list any previously added images.
-
In the main pane, click Add Image.
-
-
In the Add Software Image window that opens, choose whether your image is stored on a remote server or local system.
-
If specifying a remote image, provide the full URL to the image.
-
If uploading a local image, click Choose File and select the image file from your local system.
If uploading from a local machine, slow upload speeds may cause the session to timeout which can interrupt the transfer. We recommend at least 40Mbps upload speed and increasing the session timeout to 1800 seconds (from the default 1200).
You can change session timeout in the Admin > Security page in your Nexus Dashboard GUI. System restarts the UI and it may possibly take a minute before you can re-login to the UI.
-
-
Click Upload to upload the image.
The Images tab will show the image upload progress, wait for it to finish before proceeding to the next section.
Upgrading the Cluster
You must have the upgrade image already added to the Nexus Dashboard cluster as described in Adding Images.
To upgrade your cluster:
-
Navigate to your Nexus Dashboard’s Admin Console.
-
Initiate an update.
-
From the main navigation menu, select Manage > Software Management.
-
In the main pane, select the Updates tab.
-
Click Set up Update or Modify Details.
If this is the first time you are upgrading your cluster, simply click the Setup Update button in the middle of the page.
If you have previously upgraded the cluster, the last upgrade’s details will be displayed in this page instead of the Setup Update button. In this case, click the Modify Details button at the top right of the screen.
-
-
In the Setup/Version Selection screen, select the target version and click Next to proceed.
If you uploaded multiple images to your Nexus Dashboard, they will be listed here.
-
Review the validation report and click Install to proceed with the upgrade.
Before the upgrade is triggered, the system will perform a number of validation checks and show the report.
-
In the Setup/Confirmation screen, review the details of the update and click Begin Install to proceed.
The screen will proceed to the Install tab and you will be able to see the progress of each node.
The process can take up to 2 hours and you can navigate away from this screen in the meantime.
-
Wait for the image installation to complete.
You can check the installation status by navigating back to Operations > Firmware Management screen and clicking View Details link in the Last Status tile.
-
Click Install.
If you navigated away from the installation screen, navigate back to Operations > Firmware Management screen and click View Details link in the Last Status tile.
It may take up to 20 additional minute for all the cluster services to start and the GUI may become unavailable during this process. The page will automatically reload when the process is completed. You can track the activation process in the Activate screen as shown below.
-
After the process is complete, check if services are active and verify health of the cluster. For more information on troubleshooting nodes, see Cisco Nexus Dashboard Troubleshooting.
Deleting Images
After an upgrade is completed, Nexus Dashboard will automatically remove the upgrade image that you uploaded for the upgrade. However, if you upload an upgrade image and then choose not to upgrade, you can delete the uploaded images using the following steps:
-
Navigate to your Nexus Dashboard’s Admin Console.
-
From the main navigation menu, select Manage > Software Management.
-
In the Nexus Dashboard Releases tile, click the trash icon next to the specific release image that you want to delete.
-
In the Confirm Delete prompt, click OK to confirm.
Tech Support
Tech support enables you to collect logs and activities in the system for further troubleshooting by Cisco TAC. Cisco Nexus Dashboard provides tech support collection and gives ability to download tech support for individual nodes, the whole cluster, or applications. Tech support files are hosted on the Cisco Nexus Dashboard and can be downloaded at any time.
To collect Tech Support information:
-
Navigate to your Nexus Dashboard’s Admin Console.
-
Collect Tech Support.
-
From the main navigation menu, select Analyze > Tech Support.
-
In the main pane, click Collect Tech Support.
-
-
In the Collect Tech Support window that opens, provide a description.
-
From the Scope dropdown, select the category for which you want to collect tech support information.
-
Systemcollects Infra tech support information. -
Service-specific selections collects tech support information for that specific service.
-
-
Click Collect.
After you begin Tech Support collection, you can see the progress in the same screen.
If for any reason the tech support collection process fails, you can also obtain the same information by logging into each node as the
rescue-userand running one of theacs techsupport collectcommands. For more information about specifictechsupport collectcommand options, see Useful Commands. -
Download the Tech Support archive.
After the collection is finished, you can download the archive by clicking Download next it:
If you want to delete an existing Tech Support package, simply select it in the Tech Support screen and choose Delete Tech Support from the Actions menu.
History and Logs
The Admin > History and Logs page allows you to see the system-wide list of events and alerts in your Nexus Dashboard cluster.
Events
The Events tab enables you to easily access your Nexus Dashboard’s platform-level events and audit logs. The Audit Logs tab displays all events that occur during the cluster operation. In addition to viewing the events and logs directly in the Nexus Dashboard GUI, you can also configure the cluster to stream the events to an external syslog server, as described in System Settings.
The Events tab includes high severity events that may require your attention to resolve:
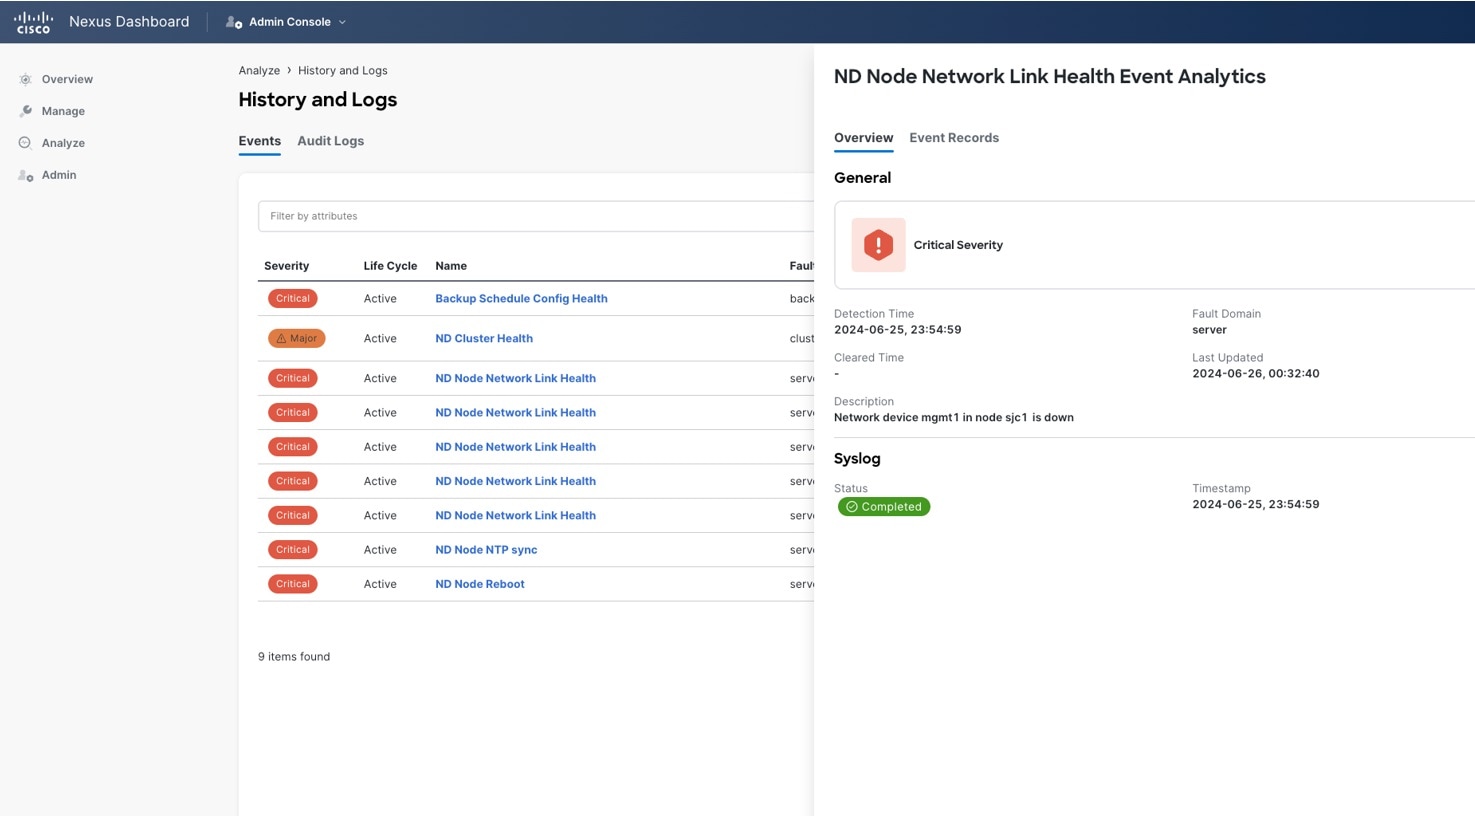
You can view a summary of all critical, major, and minor events in the list. Double-click any specific event for additional information about it. After you have viewed and analyzed an event, you can choose to acknowledge and clear it by clicking the Actions (…) menu next to the event in the list.
Audit Logs
Nexus Dashboard audit logging is automatically enabled when you first deploy the cluster and captures the operational changes made by the users in the environment.
You can view the audit logs directly in the GUI by selecting Analyze > History and Logs from the main navigation menu.
Note that the logs are not sorted by default; you can sort the list by clicking on any of the column headings.
You can choose to filter the list using the Filter by attributes field and providing a specific attribute and value pair.
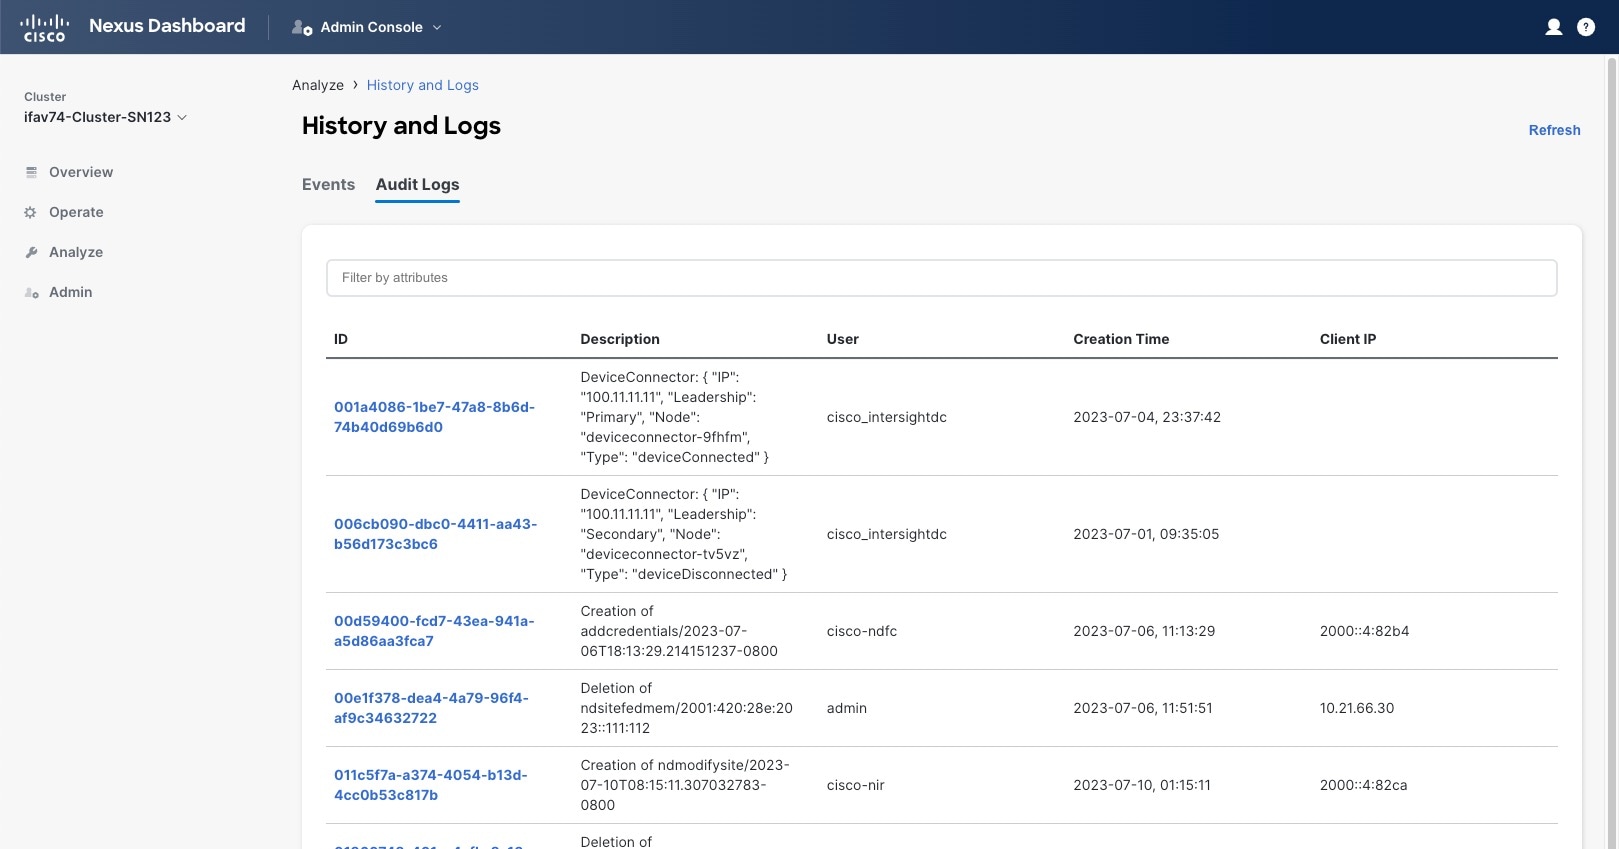
Additionally, to view detailed information about a specific entry, simply click the entry in the list to open the Details tab.
Exporting Events
Nexus Dashboard can host multiple services one or more of which can generate various events, faults, and alerts. This information is published on and stored using Apache Kafka. You can configure your cluster to export all platform-level, infrastructure-level, and service-level events to external monitoring and management systems. Each service running on Nexus Dashboard can define exactly which service-level events to aggregate and send to the cluster’s Kafka service to export.
When configuring event streaming, the following restrictions apply:
-
This release supports
syslogevent exporter only. -
The following table shows events that can be exported, along with a short description of the cause.
| Event | Description |
|---|---|
|
Node CPU Usage |
If the ND node level CPU crosses 80% usage. |
|
Node Memory Usage |
If the ND node level memory crosses 80% usage. |
|
Node Disk Usage |
If the ND node level disk crosses 80% usage. |
|
Node not reachable |
If the ND node is not reachable. |
|
Node rebooted |
Determines if the ND node has been rebooted. |
|
Node NTP sync state |
Determines if the ND node NTP synchronized. |
|
Node BGP Peer Health |
Determines if the ND node BGP peers are established. |
|
etcd cluster health |
Determines if the ND node etcd endpoints are healthy. |
|
kubelet software fault |
Determines if the ND node kubelet are healthy. |
|
ND Application Health |
If any of the app (NDI/NDFC/NDO) state is degraded. |
|
Network link health |
If the network devices (data & mgmt) are down. |
|
DNS health |
If the DNS servers are reachable. |
|
Cluster Health |
ND cluster is not healthy (shows a detailed description of the problem). |
|
Backup Schedule Config Health |
ND Backup schedules is not configured. |
|
Scheduled Backup Health |
ND Backup was scheduled successfuly. |
To configure event exporting:
-
Navigate to your Nexus Dashboard’s Admin Console.
-
From the main navigation menu, select Admin > System Settings.
-
In the Syslog tile, click the Edit icon.
In the Syslog dialog that opens, click +Add Remote Destinations to add a new server. Then provide the IP address, protocol, and port number for the server and choose whether you want to enable streaming to this syslog server at this time.
Cisco Intersight
Cisco Intersight is a Software-as-a-Service (SaaS) infrastructure management platform that is augmented by other intelligent systems. It provides global management of the Cisco Unified Computing System (Cisco UCS) and Cisco HyperFlex hyperconverged infrastructure, Cisco APIC, and other platforms including Nexus Dashboard.
Data center apps, such as Cisco Nexus Dashboard Insights, connect to the Cisco Intersight portal through a Device Connector that is embedded in the management controller of each system, in this case your Nexus Dashboard platform. Device Connector provides a secure way for the connected devices to send information and receive control instructions from the Cisco Intersight portal, using a secure internet connection.
When an Intersight-enabled device or application starts, the Device Connector starts at boot by default and attempts to connect to the cloud service. If the Auto Update option is enabled, the Device Connector is automatically updated to the latest version through a refresh by the Intersight service when you connect to Cisco Intersight. For more information on the Auto Update option, see Configuring Device Connector Settings.
For additional information on Cisco Intersight, see https://www.intersight.com/help/saas/getting_started/overview.
Nexus Dashboard does not require additional licensing to claim Nexus Dashboard on Intersight.
The Intersight account used to claim Nexus Dashboard licence should also be registered with Smart Licensing. Please follow Cisco Intersight Help Center documentation for instructions on how to register Intersight with Cisco Smart Software Manager.
Configuring Device Connector Settings
Devices are connected to the Cisco Intersight portal through a Device Connector, which provides a secure way for the connected devices to send information and receive control instructions from the Cisco Intersight portal.
All device connectors must properly resolve svc.intersight.com and allow outbound initiated HTTPS connections on port 443. If a proxy is required for an HTTPS connection, you must configure the proxy settings in your Nexus Dashboard.
This section describes how to configure the basic Device Connector settings.
-
Navigate to your Nexus Dashboard’s Admin Console.
-
From the main navigation menu, select Admin > Intersight.
-
In the top right of the main pane, click Settings.
-
Click the General tab to configure basic options.
-
Use the Device Connector knob to enable or disable the Device Connector.
This enables you to claim the device and leverage the capabilities of Intersight. If it is disabled, no communication is allowed to Cisco Intersight.
-
In the Access Mode area, choose whether to allow Intersight the capability to make changes to this device.
-
Allow Control(default) — enables you to perform full read or write operations from the cloud based on the features available in Cisco Intersight. -
Read-only— ensures that no changes are made to this device from Cisco Intersight.For example, actions such as upgrading firmware or a profile deployment will not be allowed in read-only mode. However, the actions depend on the features available for a particular system.
-
-
Use the Auto Update knob to enable automatic Device Connector updates.
We recommend that you enable automatic updates so that the system automatically updates the Device Connector software. When enabled, the Device Connector will automatically upgrade its image whenever there is any upgrade push from Intersight.
If you disable the automatic updates, you will be asked to manually update the software when new releases become available. Note that if the Device Connector is out-of-date, it may be unable to connect to Cisco Intersight.
-
-
Click Save to save the changes.
-
Click the Certificate Manager tab if you want to import additional certificates.
By default, the device connector trusts only the built-in certificate. If the device connector establishes a TLS connection and a server sends a certificate that does not match the built-in certificate, the device connector terminates TLS connections because it cannot determine if the server is a trusted device.
You can choose to upload additional certificates by clicking the Import button in this screen. The imported certificates must be in the
.pem(base64 encoded) format. After a certificate is successfully imported, it is listed in the list of Trusted Certificates and if the certificate is correct, it is shown in the In-Use column.You can click the View icon at the end of the certificate’s row to view its details such as name, issue and expiration dates.
Target Claim
This section describes how to claim the Nexus Dashboard platform as a device for Cisco Intersight.
You must have configured the Intersight Device Connector as described in Configuring Device Connector Settings.
To claim the device:
-
Navigate to your Nexus Dashboard’s Admin Console.
-
From the main navigation menu, select Admin > Intersight.
-
Check whether the Device Connector is already configured.
-
If you see a green dotted line connecting Internet to Intersight in the Device Connector page and the text Claimed, then your Intersight Device Connector is already configured and connected to the Intersight cloud service, and the device is claimed. In this case, you can skip the rest of this section.
-
If you see a red dotted line connecting to Internet in the Device Connector page, you must configure a proxy for your Nexus Dashboard cluster to be able to access the Internet, as described in System Settings before continuing with the rest of this section.
-
If you see a yellow dotted line and a caution icon connecting Internet to Intersight in the Device Connector page and the text Not Claimed, then your Intersight Device Connector is not yet configured and connected to the Intersight service, and the device is not yet claimed. Follow these procedures to configure the Intersight Device Connector and connect to the Intersight cloud service, and claim the device. In this case, proceed with the rest of the steps to configure the device.
-
-
If necessary, update the device connector software.
If there is a new Device Connector software version available and you do not have the Auto Update option enabled, you will see a message at the top of the screen informing you that Device Connector has important updates available. Enabling the auto-update feature is described in Configuring Device Connector Settings.
To manually update the Device Connector, click the Update Now link.
-
Note down the
Device IDandClaim Codelisted on the Nexus Dashboard’s Intersight page. -
Log into the Cisco Intersight cloud fabric at https://www.intersight.com.
-
Follow the instructions described in the Target Claim section of the Intersight documentation to claim the device.
After the device is claimed in Intersight, you should see green dotted lines connecting Internet to Intersight in your Nexus Dashboard’s Device Connector page along with the text Claimed.
You may need to click Refresh in top right of the page to update the latest status.
Unclaiming the Device
To unclaim the Nexus Dashboard as a device from Intersight:
-
Navigate to your Nexus Dashboard’s Admin Console.
-
From the main navigation menu, select Admin > Intersight.
-
In the main pane, click Unclaim.
Trademarks
THE SPECIFICATIONS AND INFORMATION REGARDING THE PRODUCTS IN THIS MANUAL ARE SUBJECT TO CHANGE WITHOUT NOTICE. ALL STATEMENTS, INFORMATION, AND RECOMMENDATIONS IN THIS MANUAL ARE BELIEVED TO BE ACCURATE BUT ARE PRESENTED WITHOUT WARRANTY OF ANY KIND, EXPRESS OR IMPLIED. USERS MUST TAKE FULL RESPONSIBILITY FOR THEIR APPLICATION OF ANY PRODUCTS.
THE SOFTWARE LICENSE AND LIMITED WARRANTY FOR THE ACCOMPANYING PRODUCT ARE SET FORTH IN THE INFORMATION PACKET THAT SHIPPED WITH THE PRODUCT AND ARE INCORPORATED HEREIN BY THIS REFERENCE. IF YOU ARE UNABLE TO LOCATE THE SOFTWARE LICENSE OR LIMITED WARRANTY, CONTACT YOUR CISCO REPRESENTATIVE FOR A COPY.
The Cisco implementation of TCP header compression is an adaptation of a program developed by the University of California, Berkeley (UCB) as part of UCB’s public domain version of the UNIX operating system. All rights reserved. Copyright © 1981, Regents of the University of California.
NOTWITHSTANDING ANY OTHER WARRANTY HEREIN, ALL DOCUMENT FILES AND SOFTWARE OF THESE SUPPLIERS ARE PROVIDED “AS IS" WITH ALL FAULTS. CISCO AND THE ABOVE-NAMED SUPPLIERS DISCLAIM ALL WARRANTIES, EXPRESSED OR IMPLIED, INCLUDING, WITHOUT LIMITATION, THOSE OF MERCHANTABILITY, FITNESS FOR A PARTICULAR PURPOSE AND NONINFRINGEMENT OR ARISING FROM A COURSE OF DEALING, USAGE, OR TRADE PRACTICE.
IN NO EVENT SHALL CISCO OR ITS SUPPLIERS BE LIABLE FOR ANY INDIRECT, SPECIAL, CONSEQUENTIAL, OR INCIDENTAL DAMAGES, INCLUDING, WITHOUT LIMITATION, LOST PROFITS OR LOSS OR DAMAGE TO DATA ARISING OUT OF THE USE OR INABILITY TO USE THIS MANUAL, EVEN IF CISCO OR ITS SUPPLIERS HAVE BEEN ADVISED OF THE POSSIBILITY OF SUCH DAMAGES.
Any Internet Protocol (IP) addresses and phone numbers used in this document are not intended to be actual addresses and phone numbers. Any examples, command display output, network topology diagrams, and other figures included in the document are shown for illustrative purposes only. Any use of actual IP addresses or phone numbers in illustrative content is unintentional and coincidental.
Cisco and the Cisco logo are trademarks or registered trademarks of Cisco and/or its affiliates in the U.S. and other countries. To view a list of Cisco trademarks, go to this URL: http://www.cisco.com/go/trademarks. Third-party trademarks mentioned are the property of their respective owners. The use of the word partner does not imply a partnership relationship between Cisco and any other company. (1110R)
© 2017-2024 Cisco Systems, Inc. All rights reserved.
First Published: 2024-03-01
Last Modified: 2024-03-01
Americas Headquarters
Cisco Systems, Inc.
170 West Tasman Drive
San Jose, CA 95134-1706
USA
http://www.cisco.com
Tel: 408 526-4000
800 553-NETS (6387)
Fax: 408 527-0883